On The Detection Of Ionizing Radiation Arising From Star–Forming Galaxies At Redshift –4 : Looking For Analogs Of “Stellar Reionizers”
Abstract
We use the spatially–resolved, multi–band photometry in the GOODS South field acquired by the CANDELS project to constrain the nature of candidate Lyman continuum (LyC) emitters at redshift identified using ultra–deep imaging below the Lyman limit (1-sigma limit of 30 AB in a 2′′ diameter aperture). In 18 candidates, out of a sample of 19 with flux detected at 3-sigma level, the light centroid of the candidate LyC emission is offset from that of the LBG by up to 1.5′′. We fit the SED of the LyC candidates to spectral population synthesis models to measure photometric redshifts and the stellar population parameters. We also discuss the differences in the UV colors between the LBG and the LyC candidates, and how to estimate the escape fraction of ionizing radiation () in cases, like in most of our galaxies, where the LyC emission is spatially offset from the host galaxy. In all but one case we conclude that the candidate LyC emission is most likely due to lower redshift interlopers. Based on these findings, we argue that the majority of similar measurements reported in the literature need further investigation before it can be firmly concluded that LyC emission is detected. Our only surviving LyC candidate is a LBG at , which shows the bluest color among LBGs at similar redshift, a stellar mass of , weak interstellar absorption lines and a flat UV spectral slope with no Ly in emission. We estimate its to be in the range 25%-100%, depending on the dust and intergalactic attenuation.
Subject headings:
galaxies: distances and redshifts - galaxies: high-redshift - galaxies: formation1. Introduction
The origin of the ionizing radiation, whether from galaxies or AGN, responsible for the re-ionization of the universe at high redshift, , and for keeping it ionized at later epochs, is still poorly constrained. The contribution of quasars to the hydrogen ionizing background increases as we look back in time from to as the peak of the quasar luminosity function is approached (e.g., Fanidakis et al. 2011). Beyond redshift 2 their contribution significantly decreases and the hydrogen photoionization rate is most probably maintained by stellar emission (e.g., Siana et al. 2008; Faucher-Giguère et al. 2009; Haardt & Madau 2011; but see Fiore et al. 2011). The star-forming galaxies at are therefore the leading candidates to provide the remaining ionizing photons. The severe IGM absorption at prevents us from observing directly the Lyman continuum (LyC) emission (Meiksin 2006; Inoue & Iwata 2008). This is particularly true during the re–ionization of the Universe (). It is therefore essential to identify diagnostics of the LyC emitters at lower redshift, (at Å), and infer if galaxies with these characteristics are more common during the epoch of re–ionization (one Gyr earlier, or ).
At the direct detection of LyC emission from galaxies is still difficult, because ionizing radiation is severely attenuated by neutral gas and by dust in the interstellar and circumgalactic medium (ISM and CGM) of the source itself, as well as by the intervening IGM. As a result, the number of reported detections of star–forming galaxies at high redshift, typically selected as Lyman–break galaxies or with equivalent criteria, with LyC emission is very small (Shapley et al. 2006; Iwata et al. 2009; Nestor et al. 2011; S06, I09 and N11, hereafter; Vanzella et al. 2010b, V10b, hereafter; Boutsia et al. 2011). The issue is further complicated by the relatively high probability of finding faint low–redshift galaxies at very close angular separation, i.e., 1 arcsec or less, from a high–redshift galaxy with brighter apparent magnitude (Vanzella et al. 2010a, V10a, hereafter). These interlopers, for which spectroscopic identification is not viable, can be wrongly interpreted as spots of LyC emission from the host galaxy if high–angular resolution multi–band photometry is not available, as is often the case, to recognize their nature.
Recently, searches of LyC emitters with deep imaging below the Lyman limit have yielded samples of candidates at redshift z where the region of emission of the candidate LyC ionization radiation is spatially offset from that of the non–ionizing rest far–UV light (dubbed “nLyC” in what follows), namely the main body of the galaxy typically observed between 1500Å and 2000Å. The displacement of these putative LyC–emitting “blobs” is generally less than one arcsec, but in some cases values as high as 2′′ have been reported (I09; N11), corresponding to separation in the range of several kpc to a few tens of kpc. In other words, the candidate LyC emission would come from regions of the galaxies that are well separated from the center, which is where most of the LyC photons are produced, and in some cases so far from it to be classified as separate sources. If confirmed this would provide important empirical constraints on how LyC escapes from galaxies. Future observations with the new HST/WFC3 in the LyC rest-frame at will help exploring this issue further. In the meantime, however, motivated by the potential importance if the above findings are confirmed, we use spatially resolved, multi–band photometry from HST to constrain the nature of a sample of LyC emitter candidates that we have selected in the GOODS South, one of the fields targeted by the CANDELS project (Grogin et al. 2011; Koekemoer et al. 2011) from ultra–deep U–band imaging below the Lyman Limit of star–forming galaxies with known spectroscopic redshift . We also report on the only one Lyman Break Galaxy in our sample at (, hereafter) with a clear LyC emission.
2. Analysis of a Sample of Candidates LyC Emitters in GOODS–South
We have selected a sample of LyC emitter candidates from ultra–deep imaging in the U–band of the GOODS–South field (V10b). The U–band images, which are described in Nonino et al. (2009), were aimed to probe the spectral region below the Lyman limit of these galaxies for possible emission of ionizing radiation. The images are very deep, reaching 1- flux upper limit of about 30 mag (AB) for an unresolved source within a circular aperture of 2′′ diameter.
A relatively large number of sources, selected as Lyman–break galaxies, have secure redshift identification in the GOODS-S field (Vanzella et al. 2008, 2009; Popesso et al. 2009; Balestra et al. 2010). As described in V10b, we start from a spectroscopic sample of 122 B–band dropouts at selected by Giavalisco et al. (2004) from the GOODS/ACS images for which we have robust redshifts, i.e., Quality Flag QF=A. The lower limit of the redshift range is the lowest value such that the 912Å Lyman limit is outside, redward of the system throughput in the U filter, while the upper is chosen because the rapid increase of opacity of the IGM produces too small transparency at higher redshift to make analysis of galaxies useful (see V10b). 7 out of 122 B–band dropouts are detected in the Chandra images in the CDF-S (Xue et al. 2011) and classified as AGN. Among these 122 sources we have flagged as potential LyC emitter candidates the 32 of them which have flux detection at the level or larger within a circular aperture of 1.2′′ diameter in the U–band image. In this work we discuss in detail these U-band emitters (named hereafter).
As we noticed in V10b, in 28 of the 32 sources the U–band emission, i.e., the candidate LyC light, is spatially offset relative to the centroid of the rest–frame far–UV light of the LBG (the nLyC at wavelength around Å). A visual inspection of the HST/ACS images showed that in 9 of the 28 sources the U–band flux light can unambiguously be explained as coming from the outer isophotes of nearby sources, which most likely are foreground interlopers (e.g., see Figures 4 and 5 of V10b). We have eliminated these galaxies from the sample of LyC candidates. The remaining 19 candidates are listed in Tab. 1 and are analyzed here. They have counterparts in the ACS and WFC3 images which are close to the targeted host LBG with angular separations in the range 0.4′′–1.9′′. Image cutouts for these sources are shown in V10b, here we show in Figure 2 and the Appendix the more critical cases where the angular separation is smaller than 1′′. All but one of the U–band sources are fainter, in AB magnitudes, than their ACS optical (rest UV) nLyC counterparts. Tab. 1 reports the ratio of for the 19 objects.
The remaining 4 U–band detections of the initial sample of 32 are co–spatial with the ACS and WFC3 images of the host sources, in the sense that the centroid of the U–band light falls within the errors ( 0.1′′) on the location derived from the optical HST/ACS images. As discussed in V10b (and reported in their Table 3), 3 out of 4 are detected in the 4 Msec X–ray Chandra images (0.5-8 keV), and also show typical signatures of AGN in their optical spectra, such as high ionization emission lines (e.g., C IV, N V). The forth source, which we call Ion1, is our only robust candidate LyC emitter and we will describe it further in Sect. 6.
2.1. The Effect Of The Intergalactic Attenuation
The method we are adopting here is based on an intermediate–band filter (Å, U–band), and is similar to the typical narrow–band imaging only in the cases where (9 out of 19 LBGs), i.e. the between the Lyman limit of the galaxy and the red cut-off of the filter is minimal. In this case, the greater depth of our image compensate for the larger noise due to the broader bandpass. For example, if compared with the NB3640 narrow–band filter used by N11 (Å), the depth of our U-band image nearly exactly compensate for the differet filter setup.
Differences between the methods arise if we consider, as in our approach, a variable redshift. Indeed, the LyC region probed by our filter is redshift dependent, e.g., it is Å at , respectively. We have investigated the effect of the IGM attenuation as a function of redshift by running MC simulations as in V10b (where the IGM attenuation is extensively taken into account). To this end, as a reference, we adopt a magnitude of and a ratio (V10b, Siana et al. 2007). We then apply 10000 different IGM transmissions convolved with the U-band filter and add photometric noise to the estimated flux in the U-band (see (V10b)). In these conditions, at we retrieve of the sources in their LyC (U-band) at ( if ). As redshift increases, the fraction of recovered sources decreases because the IGM attenuation (see Figure 1). The inner box of Figure 1 shows how the IGM affects the fraction of recovered sources as a function of redshift (normalized to the case).
It is worth noting that the majority of the sources analyzed here are at (15 out of 19). Moreover, two examples at relatively high redshift have recently been reported: a LBG at (Ion1, also discussed in this work) and a AGN at with , for which a LyC emission at Å and Å is detected at S/N of 5.2 and 3.3 by our deep U-band imaging, respectively (V10b). This suggest that despite the low average IGM transmission at , its stochastic behavior makes the variance to be relatively large. Indeed, at fixed redshift, the distribution of the IGM transmissions (U-band convolved) is asymmetric with an extended tail toward high values (Inoue & Iwata 2008). The reason is that the Lyman continuum absorption by the IGM is very stochastic because it is related to the presence of relatively rare Lyman limit systems (LLS) or damped Lyman system (DLA), having . With a Lyman limit system, the transmission is suddenly cut down at the corresponding wavelength. Conversely, without a LLS (or DLA system) near the source, we can expect a significant transmission even far below the source Lyman limit (see Inoue & Iwata 2008).
Having this in mind, we decided to keep the whole sample up to in the analysis performed in the present work. If we could establish that the U–band selected sources observed in proximity of their LBG were at the same redshift of their companions then we would safely conclude that they are LyC emitters. Before to investigate the nature of their redshift, in the following section we briefly recall the issue of the contamination by lower redshift sources randomly placed at small angular separations from the higher redshift LBG.
3. The Occurrence Of Foreground Contamination
The likelihood that a foreground interloper located in the vicinity of a LBG is responsible for the detection in the U band increases with redshift of the LBG, with the angular separation and the quality and depth of the observations. Siana et al. (2007), I09 and N11 calculated analytically the probability that candidate LyC emission from a LBG is due to an interloper, given the characteristics of the data (quality and depth). V10a performed the same calculations and ran Monte-Carlo simulations to quantify this effect.
The displacement of the U–band light relative to that at redder wavelengths, as measured from the light centroid in the U–band and ACS images, for the sample 19 galaxies discussed here, is in the range arcsec; in all cases there always is a counterpart to the U–band source in the HST/ACS and WFC3 images. We calculated that the number of sources observed in the two annular bins with radii 0′′-1′′ and 1′′-2′′ from the LBG centroid in the ACS –band images is equal, within the errors, to the expectations for foreground galaxies at increasing separations. That is, given the number counts and assuming a uniform distribution, the fraction of intercepted foreground sources increases with the area of the annulus considered.
One of the parameters adopted in V10a was the seeing (the PSF of the images), strictly related to the possibility to deblend close sources and related to the probability of superposition, which increases for the worst seeing conditions. The fact that the LyC emission could be intrinsically offset from the main galaxy (as reported in N11 and I09) further complicates the interpretation, if the redshift of these potential emitters is not known. This is still true if high spatial resolution images are available and the sources are well separated, i.e., in absence of the redshift information an intrinsically offset LyC emission is fully compatible with the emission of a lower redshift object.
On the one hand, the effects of this foreground contamination can be corrected statistically. On the other hand, it is worth investigating carefully each LyC candidate, since any consideration about the mechanisms that allow the LyC photons to escape primarily depend on the reliability of the LyC detection. Therefore we now turn to the discussion of observational evidence that will help us to constrain the redshift, and hence the nature, of these sources in our sample (Sect. 4).
4. Constraining the redshift of the candidates LyC emitters in the GOODS-S sample
4.1. The Escape Fractions
In this section we calculate the absolute and relative Lyman continuum escape fractions (defined below) of our potential LyC emitters assuming that they are at the same redshift of the LBG. Since and () have to obey to clear limits, this in turn puts constraints on other quantities, in particular the redshift. In order to do that, we have to first define the relation among various quantities and calculate the escape fraction where spatially offset LyC and nLyC emissions are present.
4.1.1 Escape Fraction From a Morphologically Resolved Lyman Continuum
Following Siana et al. (2007) the observed flux ratio between the 1500Å and the Lyman continuum is affected by several factors and is expressed as :
| (1) | |||||
where LyC is the wavelength at which the Lyman continuum is observed, is the intrinsic luminosity density ratio, () is the differential dust attenuation (in magnitudes), is the line-of-sight opacity of the IGM for LyC photons (and transmission is ), and is the optical depth of the Lyman continuum absorption from H i within the observed galaxy’s interstellar medium, ISM (whose transmission is defined as ).
The relative fraction of escaping LyC photons relative to the fraction of escaping nLyC (1500 Å) photons is obtained rearranging the above equation :
| (2) |
it compares the observed flux density ratio (corrected for the IGM opacity) with models of the ultraviolet spectral energy distribution of star-forming galaxies. If the dust attenuation is known, can be converted to as (e.g., Inoue et al. 2005; Siana et al. 2007). Again, from the above equations, can be written as:
| (3) |
the two factors on the right side have values in the range [0–1]. Clearly, their product, i.e., , cannot be greater than 1.
It has been recently argued by N11 that due to the details of the radiative transfer and sources of the corresponding photons, any Ly emission and escaping LyC flux will not be necessarily co-spatial with either each other or with the bulk of the rest-frame UV flux in a given galaxy. This is true when considering Ly emission, which typically arises from backscattering of moving hydrogen gas that can be spatially decoupled from the ionizing sources. The observed light centroids (barycenter) of LyC and nLyC can be displaced in the case in which the LyC arises from a sub-region of a larger area, however, the emission is not spatially shifted, i.e., if the ionization radiation is measured in some sub-region, then the nLyC radiation is expected to be detected too (typically with brighter magnitude). The crucial point here is that the two quantities and must be measured in the same spatial (i.e., physical) region, where the ionizing and non-ionizing radiation arise.
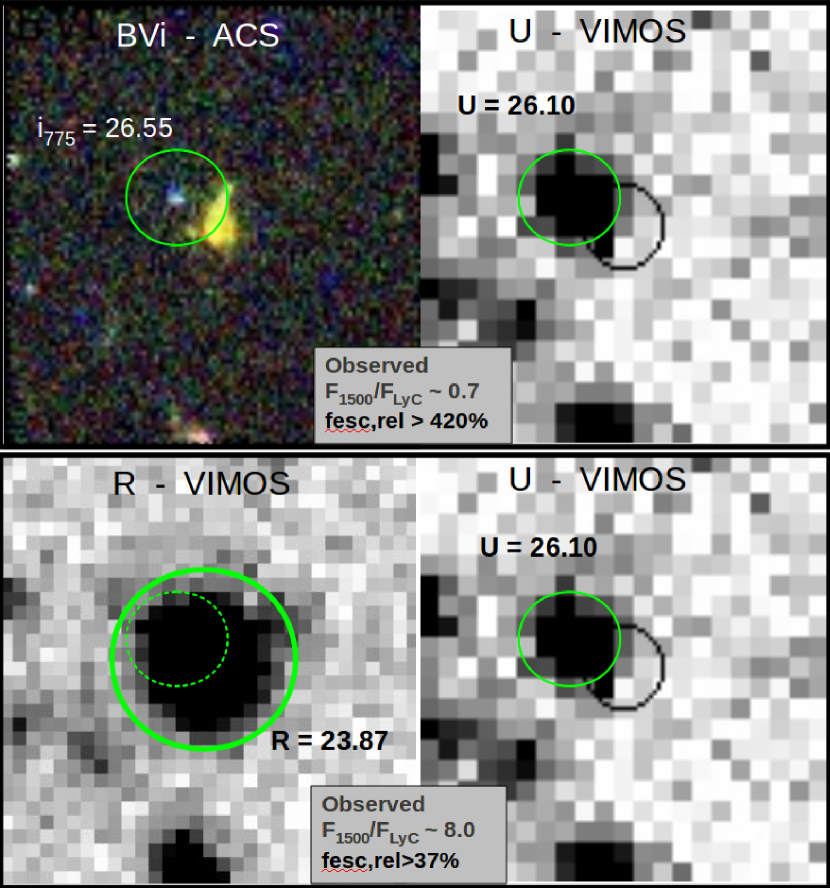
Conversely, recent works have performed measures with the aim to include both the fluxes and by enlarging the apertures (I09) or by deriving fluxes from the images regardless of the misalignment (e.g., SExtractor MAG-AUTO in and bands, as in N11), resulting in measures within different apertures size and/or shape. In this way, the measured observed ratio , and consequently the quantity, are strongly biased. In particular the resulting would be severely underestimated, because the correct value would be smaller. Figure 3 shows an illustrative example in the GOODS-S field (also discussed below and reported in Tab. 1) in which the observed ratio has been calculated with and without taking into account of the offset emission, top and bottom panels, respectively. Under the same assumptions (intrinsic luminosity ratio and IGM transmission), the former method (top panel) produces an that is times lower than the latter (bottom panel).
The consequence is that if the estimated exceeds the value of 100% then some other quantity has to be revised. It is even more significant if this happens under conservative assumptions of , dust and IGM attenuation.
If, from one hand, the has to be less than 100%, the constraints can be even more stringent if has to be less than 100%. Indeed from Eq. 1 and 2 it turns out that :
| (4) |
In order to have the transmission of the ISM correctly in the range [0–1] (right side), the has to be less than , which in turns is a quantity less than one (see Siana et al. 2007, their Figure 2). Therefore also the relative escape fraction has to be less than one.
4.1.2 Anomalous Escape Fractions In Our Sample
Following the discussion of the previous section, we have estimated for our sample in the correct way, i.e., in same spatial regions where the –band emission is observed, assuming that the U–band sources are at the same redshift as the LBG, i.e., they are LyC emitters. Following Eq. 2 we calculate the by assuming an intrinsic ratio (Shapley et al. 2006) and the maximum IGM transmission at the redshift of the LBG.111 has been calculated following the Inoue & Iwata (2008) prescription convolved with the VIMOS/U band filter, as described in V10b; here we include in the calculations the recent statistics of the LLS provided by Prochaska et al. (2010) and Songaila & Cowie (2010), that increase slightly (see Inoue et al. 2011). Transmissions at the redshift of the LBG have been calculated on 10000 random line of sights. The intrinsic ratio is also justified by the fact that the sources show an UV spectral slope (from their color) similar or redder than their LBGs. Therefore the adopted ratio is a conservative assumption.
The values are reported in the last column of Table 1. All but one U–band LyC candidates have larger than 100%, that would implies a less dust attenuation for shorter wavelengths, i.e., , in contrast to any dust extinction law. This is even more evident if we adopt the ratio (e.g., Siana et al. 2007; V10b), that increases the values of Table 1 of a factor . The one case with has inconsistent photometric redshift and UV colors as described below.
4.2. The UV Colors
The color of galaxies at the redshift considered here largely depends on the cosmic opacity of the IGM (see Madau 1995), specifically due to the effects of the Ly forest. Given the spatial correlation scale of the IGM, if the U-band companions are at the same redshift as their associated LBGs, their colors should therefore be similar.
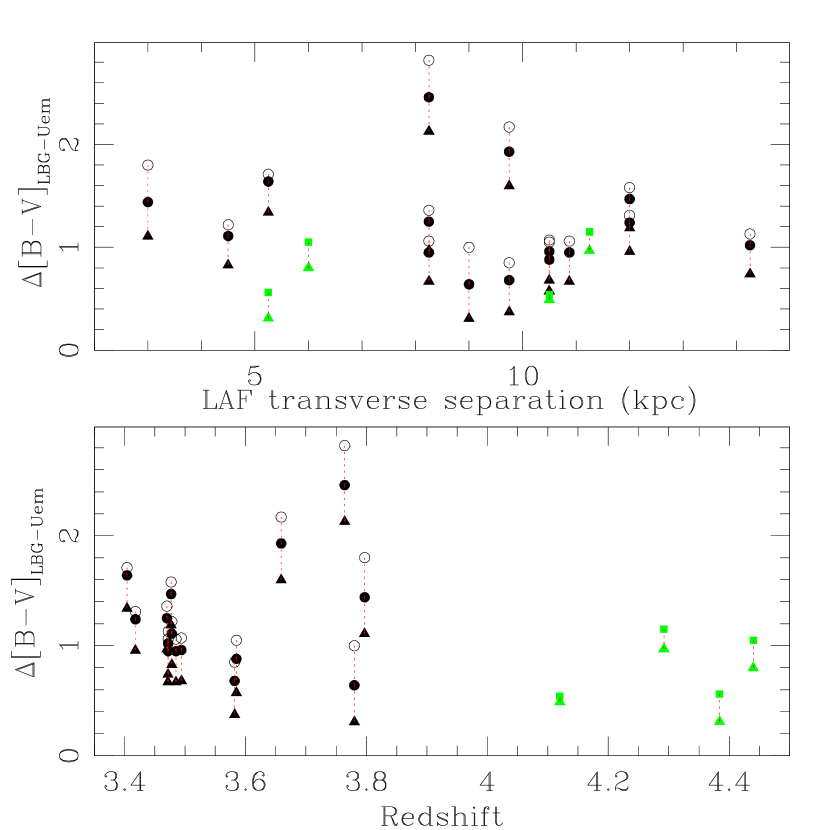
Figure 4 shows the difference of the observed color between the LBG and their companions LyC candidates (empty circles, ) as a function of the transverse separation (physical) calculated at the mean redshift of the Ly forest. The same is shown for the four galaxies for which the has been adopted, more suitable than the color in probing the IGM decrement. For all, the typical error in the color is 0.1 mag, because these sources are detected at more than 10-sigma in each band. As the figure illustrates, the LyC candidates are much bluer than their companion LBGs, implying either a very high fraction of escaping ionizing radiation and/or an high transmission of the IGM, or more likely as we are about to argue, that their redshift is significantly lower than that of the LBG, in agreement with the previous result and the photometric redshift analysis (reported in the next section). This is seen through a Monte Carlo simulations in which we have simulated for the LyC candidates in the UV rest–frame continuum probed by the -band and we have conservatively assumed that the IGM transmission at Å is the same as that at Å (for the simulations we used the IGM transmission by Inoue et al. (2008, 2011) and the SB99 UV templates with age 100 Myr, continuous star formation and metallicity z=0.004 and Salpeter IMF). We can then correct the observed color of the LyC emitters and recalculate the , which we plot in the Figure 4 as filled circles (case in which the ). The corrected color differences still show that the LyC candidates are much bluer than their putative LBG companions. An even much more conservative correction can be made by assuming unitary IGM transmission blueward of the Ly line, in all cases and recomputing the color differences (filled triangles), which still shows that the candidates would be much bluer than the LBG.
The observed median color and its 68% percentile interval of the LyC candidates is , significantly bluer than that of the LBG sample, which is , in contrast with what would be expected if their redshift were the same as that of the LBG and their stellar populations were similar (e.g., Meiksin 2006).
We also explored a more extreme possibility by calculating at a given redshift and the expected colors arising from population III stars (Pop III). The Pop III stars of Inoue (2011) template (with zero metallicity), convolved with the U-band filter and the IGM transmissions (1000 lines of sight) are partially able to reproduce the observed colors only in the case of high transparency of the IGM. Moreover, the presence of Pop III stars produces a very steep UV spectral slope (with a color ), that is in contrast to what observed in our sample, i.e., 222The bluest sources in our sample (two with ) have a color that is bluer than the bluest value among the 1000 realizations calculated for Pop III stars.. Therefore we exclude the presence of Pop III stars.
Regardless of theoretical expectations, in all cases that we considered the U–band companions have color that are bluer by more than one magnitude (see in Tab. 1) than their corresponding LBG. If placed at the same redshift, the line of sight to each LyC candidate/LBG pair would be probing the IGM at transverse separations smaller than 20 kpc (physical) at the mean redshift of the Lyman forest. This is much smaller than the transverse cross-correlation function observed in QSO pairs separated of several arcminutes, for which the coherence length in the IGM is at least of the order of 500 kpc proper, (e.g., Fang et al. (1996); D’Odorico et al. (1998); Rauch et al. (2005); Cappetta et al. (2010)). This implies that the IGM attenuation due to the forest should be the same for the LyC candidates and their associated LBG if they were at the same redshift. Since the colors of the sources are similar or even redder than those of the LBG, implying comparable or even redder ultraviolet spectral slope (similar stellar populations and obscuration properties), their colors should also be similar, since the IGM attenuation would be in practise the same.
Thus, we interpret these simulations as evidence that the LyC candidates are not regions of the LBG where ionizing radiation is escaping from but rather relatively unobscured star–forming galaxies at significantly lower redshift than the LBGs.
4.3. Photometric Redshift and SED Fitting
To further investigate the nature of the U–band sources, namely whether regions of the host LBG from where LyC ionizing radiation is escaping or sources located at different, very likely lower, redshifts, we have fit the spatially–resolved CANDELS multi–band HST (BVizJYH), ground–based (U and K) and Spitzer/IRAC photometry to templates and spectral population synthesis models to derive their photometric redshifts and the parameters of their stellar populations (stellar mass, star–formation rate, dust obscuration and age).
The images in the above bands have different angular resolution, and to robustly measure the photometry of our sources we have used the TFIT software package, developed by the GOODS and CANDELS teams (Laidler et al. 2007), which uses positional priors and PSF information to measure apparent magnitudes in matched apertures. For each source, TFIT uses the spatial position and morphology from the HST high–resolution images (we used both the ACS z–band and the WFC3/IR H band) to construct a template image, which includes nearby sources. While these are fully resolved at the HST angular resolution, they might be marginally or even heavily blended in the other images. This template is then fit to the images of the object in all other low-resolution bands after convolution with the appropriate PSF. During the fitting procedure, the fluxes of the object in low-resolution bands are left as free parameters. The best-fit fluxes are considered as the fluxes of the object in low-resolution bands. These procedures can be simultaneously done for several objects which are close enough to each other in the sky. Experiments on both simulated and real images show that TFIT is able to measure accurate isophotal photometry of objects to the limiting sensitivity of the image (Laidler et al. 2007).
We derive the photometric redshift and the physical properties of the LyC emitter candidates by fitting the observed spectral energy distributions (SEDs) to stellar population synthesis models. Models used to measure photo-zs are extracted from the library of PEGASE 2.0 (Fioc & Rocca-Volmerange 1997). Instead of using the redshift with the minimum , we integrate the probability distribution function of redshift (zPDF) and derive the likelihood-weighted average redshift. When the zPDF has two or more peaks, we only integrate the main peak that has the largest power.
Since the U–band selected LyC candidates have counterparts in the HST z and H bands in each case, we have generated two sets of fits, one based on positional priors from the ACS z–band images, which sample the rest far–UV SED of the galaxies at Å, and the other on priors from the WFC3 H–band images ( Å). The first (GOODS) set uses photometry in the U and the ACS BViz bands, in the VLT/ISAAC JHK images of GOODS-South described by Giavalisco et al. (2004) and Retzlaff et al. (2010), and in the four GOODS Spitzer/IRAC bands. The second (CANDELS) set uses the WFC3/IR YJH near–IR photometry in place of the ground–based one. The z–band positional priors might better reflect the spatial location of the LyC emitting regions, since essentially the same stars that power it also power most of the light in the nLyC far UV spectrum. The z–band images also have better angular resolution than the H–band ones. The second set offers an independent set of measures, which takes advantage of the generally more sensitive and higher–resolution WFC3 data; it lacks, however, the K–band data.
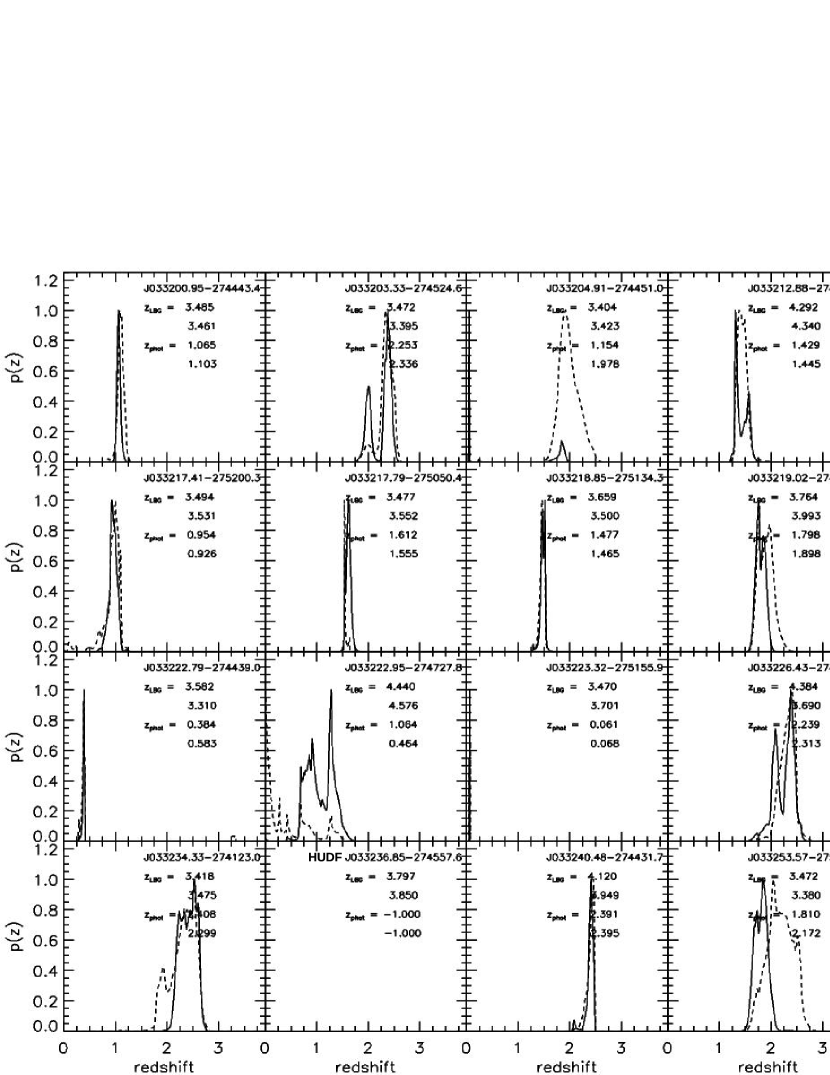
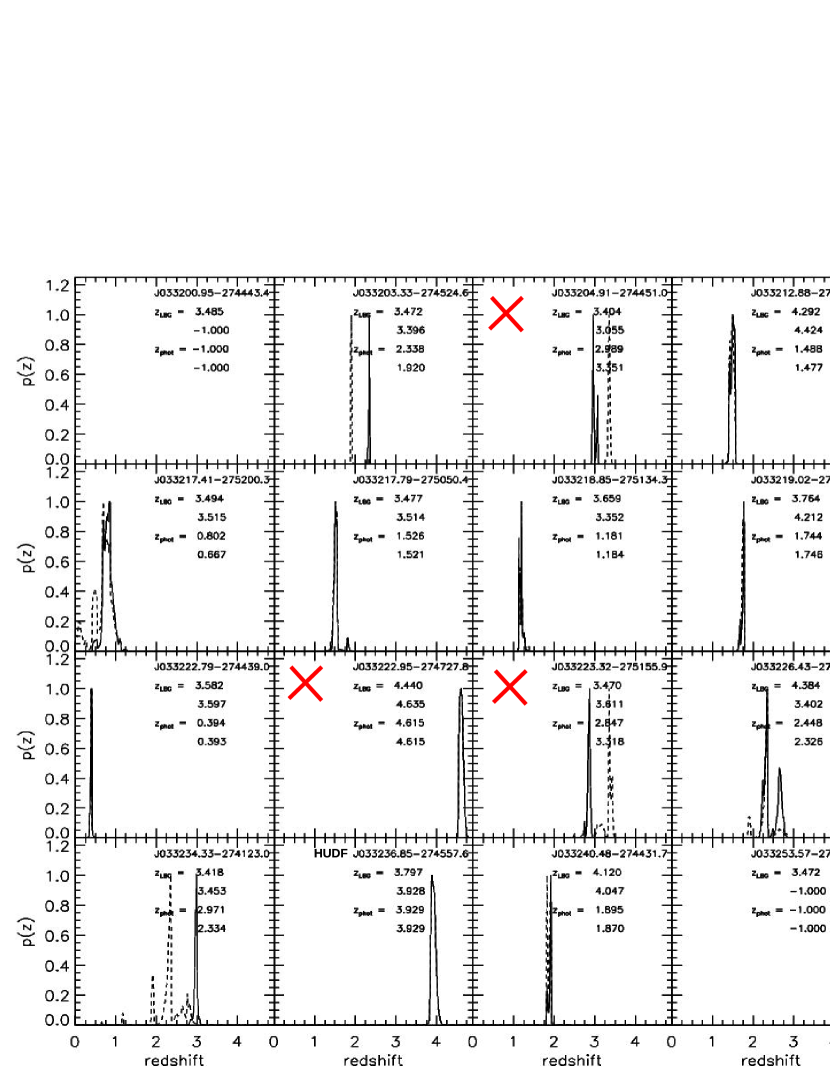
Since the potential emission in the LyC spectral range is not taken into account in the models, and thus flux in the U–band could skew the photometric redshift calculation towards lower values, for both photometric sets we have run the fit with and without the U–band photometry. Figure 5 shows the redshift probability function derived from the GOODS photometric set; Figure 6 the one from the CANDELS set. In all cases the solid curve refers to the calculation made using the U–band photometry, the dashed curve without it. In all cases the photometric redshifts are calculated as the weighted average of zPDF as:
| (5) |
A blank panel in Figure 6 means that the source is outside of the region covered by the CANDELS observations.
The general result from our analysis is that the photometric redshifts of the LyC emitter candidates are systematically much smaller than the spectroscopic redshifts of their host LBGs. Exceptions include the cases of the LyC candidates GDS J033204.91-274451.0, GDS J033220.95-275021.8, GDS J033222.95-274727.8, and GDS J033223.32-275155.9 (see Figures 5 and 6), where the GOODS photometric redshift is much lower than the spectroscopic redshift of the LBG, but the CANDELS photometric redshift is not. These are cases in which the separation between the LBG and the is 1′′ and are not individually detected in the CANDELS H-band based catalog (they are marked with red crosses in Figure 6).
In the first case, GDS J033204.91-274451.0, the LyC emitter candidate is resolved as a different source from the LBG in the ACS z–band image but not in the H–band one. The photometric redshift from the GOODS photometry yields a significantly lower redshift than the LBG’s spectroscopic one, with some dependence of the redshift probability function on the exclusion of the U–band from the fit, but the resulting photometric redshift is in any case much lower than the LBG’s. Since the LyC candidate and the LBG are not resolved in the H band, the CANDELS photometric redshift is essentially that of the LBG itself. If the U–band photometry is not included in the fit, the spectroscopic and photometric redshift are in very good agreement. Including, the U–band data, however, yields a photometric redshift somewhat lower than the spectroscopic one (,), which is not surprising, since this is the LBG with the lowest redshift in our sample and thus some flux detected in the bluest band might easily skew the fit toward lower redshift values.
The other three sources (GDS J033222.95-274727.8, GDS J033220.95-275021.8, GDS J033223.32-275155.9) are also cases in which the LyC candidate and the LBG are classified as individual sources in the z–band but not in the H band. In both cases, the GOODS photometric redshift is much lower than the LBG’s spectroscopic one. In the former, since the LBG redshift is at the high end of our sample (), adding or not the U–band data to the derivation of the photometric redshift makes no difference. In the other two, neglecting the U–band data results in very good agreement between the spectroscopic and photometric data, while including it lowers the photometric redshift solution.
The LyC emitter candidate with coordinates RA=03:32:36.85, DEC=-27:45:57.6, associated with galaxy HUDF-J033236.83-274558.0 is discussed in detail in the Appendix. It is the fainter among the cases discussed in this work with an U mag of 28.6. A new observed feature in the J-band (at 10 significance) is consistent with relatively strong line emission of a low redshift galaxy, lower than its companion LBG.
A general characteristic of the fits is that including or not the U–band photometry in the derivation of the photometric redshift of the LyC emitter candidates makes no substantial difference in the results and that there is very good quantitative agreement between the GOODS and CANDELS photometric redshift, pointing to the robustness of our analysis.
Finally, a further check has been performed by calculating the photometric redshifts without the inclusion of the U and bands, that makes the test independent from the single color analysis described in Sect. 4.2. Even though the efficiency of the photometric redshift prediction is slightly reduced, the resulting best-fit values still favor low redshift solutions for all sources, except for GDS J033223.32-275155.9 that increases from to . In this case, however, the color, the relative escape fraction and the measurements are in contrast with this high redshift solution.
4.4. Conclusion From , UV Colors and Photometric Redshift Analysis
In summary, the combination of photometric redshift, relative UV colors (that trace the IGM decrement) and the relative escape fraction estimated for the LyC candidates all argue against them being ionizing radiation escaping form the nearby LBG. Rather, they are most likely low–redshift interlopers (as we had originally argued in V10b). The more extreme case among the sources here analyzed (HUDF J033236.83-274558.0) is discussed in detail in the Appendix, in which we report new observational evidence supporting a possible contamination from a superimposed object.
Finally, we conclude by noting that deep UV imaging with HST/WFC3 will be able to clarify the nature of the U–band offset LyC candidates, since the probability that LyC radiation at Å escapes the host galaxy and eludes the IGM is extremely low (for an estimate of this probability at Å see Inoue & Iwata 2008; Meiksin 2006).
5. A Critical Analysis Of The Current Measurements
In this section we review all known (to us) galaxies at high redshift (3) for which emission of LyC ionizing radiation has been reported or suspected.
Direct detection of LyC ionizing radiation has been reported by Shapley et al. (2006, S06) in deep spectra of two LBGs at (U–band dropouts) in the SSA22 field, dubbed D3 and C49 in their nomenclature, out of a total of 14 sources observed with comparable sensitivity. It is worth noting that I09 and N11 found a highly significant null detection for the object SSA22a-D3, which is the brighter of the two objects for which S06 claimed an ionizing flux detection.
Iwata et al. (2009) used deep narrow–band (NB) imaging to image the rest–frame SED blueward of the 912Å Lyman limit of members of a well–known overdensity of galaxies at , also in the SSA22 field (Steidel et al. 1998). They reported 17 detections, 7 from galaxies selected as LBGs and 10 as LAEs.
Nestor et al. (2011) used the same technique to observe galaxies in the same SSA22 field, but extended the sensitivity of previous observations by mag. They reported 34 detections, out of 156 sources, which include 6 LBGs and 28 LAEs.
In the paper V10b, we used a technique similar, but not identical, to the one by I09 and N11. Instead of using a narrow–band, we carried out ultra–deep U–band imaging to search for candidate LyC emitters among galaxies at , namely such that the redshifted Å ionization edge of the targeted sources is to the red and completely outside of the filter’s bandpass. We found 1 candidate out of 102 LBGs (described in Sect. 6).
For most of the NB–selected candidates and LBGs the region where the LyC ionization radiation originates is found to be spatially offset from that of the non-ionizing far–UV light, namely the main body of the galaxy. The displacement is generally less than one arcsec, but in some cases values as high as 2′′ have been reported. We performed a visual inspection of the images of the galaxies by I09 and N11, and consulted Table 4 and 5 of N11, and found that % of the presently identified LyC emitter candidates exhibit a spatial offset between the LyC emission and the “non-ionizing” far–UV image of the galaxies. Since an offset emission is also consistent with a lower redshift interloper, a key step is to measure the statistical occurrence of these cases (as we did in V10a). In particular with availability of large–area HST UV and near–IR surveys with WFC3, such as CANDELS, the prospect for substantial progress in this regard is good. The other important point is that if the offset LyC emission is real, then care must be exercised when calculating the fraction of escaping ionizing radiation in each case, i.e., whether it is from the galaxy as a whole or only from a close companion, to avoid bias in the derivation of average properties. For example it is worth mentioning that the offset possible LyC detection in S06, SSA22-C49, has a reported observed ratio of (N11), in which the flux used in the calculation is that of the main galaxy. Presumably, a calculation restricted to the local region where the putative Lyman continuum emission is seen would produces a much smaller value, i.e., a much higher .
Finally, it must be kept in mind that part of the candidates LyC emitters reported above may have the contribution to from an AGN component that is difficult to identify without multi-wavelength and spectroscopic surveys.
Therefore the amount of LyC emission from high-z star-forming galaxies is still uncertain. Very few sources have spectroscopic redshift confirmation: (A) those (five) reported by Inoue et al. (2011) that need extreme stellar populations to justify the flux ratios observed, (B) the LBG reported in S06 (SSA22-C49) that shows an offset (0.5′′) U-band emission whose redshift is not conclusively known, and finally (C) the one we present in the next section and discovered in the GOODS-S field (Ion1).
6. A LyC Emitter Found in the GOODS sample: Ion1
The direct detection of LyC emitters at high redshift (as high as possible), allow us to characterize their properties at Å and try to identify similar sources and/or look if they are more common during the re–ionization epoch. For this reason it is important to identify secure LyC emissions. We recall one of the most promising stellar ionizers at redshift 3.795 we have identified in the GOODS-S field and currently the highest redshift known so far (GDS J033216.64-274253.3, Ion1) and is useful to revisit it in the context of this work by comparing its appearance with the offset sources discussed above.
6.1. Observed Photometric and Spectroscopic Properties of Ion1
This source was initially reported in V10b, and here we briefly summarize and report on new observational constraints, and compare it with the offset sources discussed above.
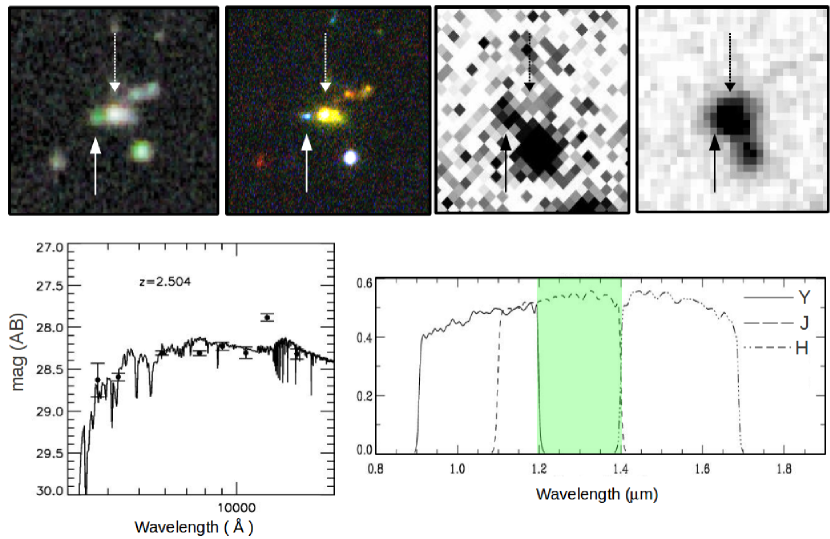
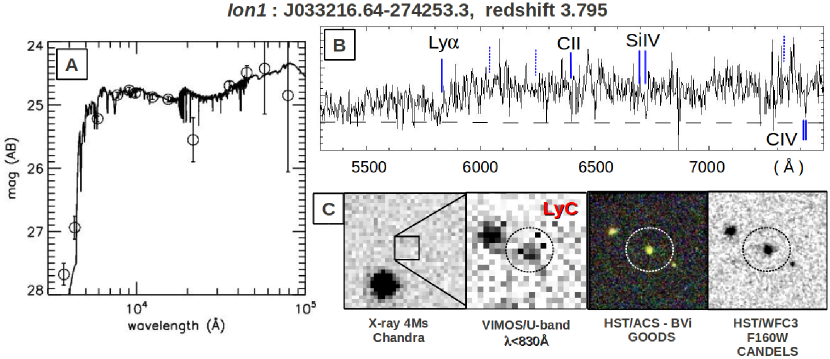
SED: The source has not been detected in the F225W, F275W and F336W channels of HST/WFC3 observations in the GOODS-S (down to 26.3, 26.4, 26.1 at 5 for point-like objects, Windhorst et al. (2011)). It lies in the B-band dropout selection scheme, with (B-V)=1.70 and (V-z)=0.40 (V09), and has a blue UV spectral slope, having an , and a derived from Castellano et al. (2011). It is worth noting that this source has the bluest color among the available 17 LBGs with and comparable UV slope. This is consistent with the fact that the –band is probing the rest-frame interval Å, in which the LyC is contributing to the observed flux (a S/N of 10 is measured in this band) and reduces the color. The probability that is 100%. It has not been detected in the new 4 Ms Chandra X-ray observations, for which we set a 1 upper limit of , nor in the 24m SPITZER/MIPS observations (Santini et al. 2009). The SED is fully comparable to that of a star-forming galaxy, in particular from the SED fitting we obtain : , stellar mass of , (see Figure 7).
Optical spectrum: Optical spectra from Keck/DEIMOS and VLT/VIMOS have been obtained, although the latter is too shallow and the S/N prevent us to add information. From the Keck spectrum it is clear that the Ly line is not in emission, the continuum–break is evident together with the [Si iv]1393.8–1402.8 and [C iv]1548.2–1550.8 absorption lines, at redshift 3.795. Also [C ii]1335.1 in absorption seems to be present. The other UV absorption lines like [O i]1302.2, [Si ii]1260.4 and [Si ii]1526.7 are not detected (see Figure 7).
UV and B-band rest-frame morphology: At 1700Å/1900Å and B–band rest-frame wavelengths the galaxy shows a resolved and compact shape, with an half-light radius of 0.9 kpc (physical size) in both the and bands (the latter from CANDELS), respectively (see Figure 7).
The hypothesis that it is a faint AGN () is still open. However, the spectral features in the optical spectrum and the shape of the SED from the U–band to the far infrared (Spitzer/MIPS 24) are fully compatible with a star-forming and relatively low mass galaxy. In the following we assume that it is a star-forming galaxy.
The LyC and the nLyC emissions (namely U and –bands) are spatially aligned within the errors, ′′, and the LyC detection at Å implies a relatively transparent line of sight free from LLSs. From Eq. 2 we derive a minimum assuming and a IGM transmission of 0.575 (maximum value for our U-band filter of the 10000 realizations at z=3.8). Given its and adopting the Calzetti extinction law we have (Calzetti et al. 2000). Assuming a intrinsic value for the escape fractions are and .
6.2. How Does Ion1 Compare With the Rest of the LBG Population ?
It has been firmly established that as the Ly equivalent width increases from absorption to emission, the UV spectral slope becomes bluer and the strength of the UV absorption lines (stellar and interstellar) drastically decreases (see, e.g., Shapley et al. 2003; Kornei et al. 2010; Balestra et al. 2010; Vanzella et al. 2009). Moreover, on average, high Ly equivalent widths tend to be associated to UV compact morphologies; conversely sources with Ly in absorption appears less compact (see Law et al. 2007; V09; Pentericci et al. 2010). The Ion1 galaxy shows :
-
1.
a blue UV spectral slope , from the photometric fitting of Castellano et al. (2011).
-
2.
relatively weak UV absorption lines, from the Keck/DEIMOS spectrum (see Figure 7).
-
3.
a compact morphology, 0.9 kpc physical half light radius in the 1600Å and 3300Å rest-frame wavelengths (from HST/ACS and WFC3).
These are all features that positively correlate with the equivalent width of the Ly in emission, nonetheless the Ly is absent. In this respect it deviates from the average LBG population, particularly if we consider its LyC emission. The fact that the Ly line is not in emission suggests that it can be absorbed and/or it is intrinsically weak because the ionizing radiation is escaping the galaxy. The detection of LyC emission would suggest low gas attenuation along the line of sight and the blue UV slope low dust absorption. In the extreme case in which all the ionizing radiation is escaping ( is 100%, or is close to), nebular emission lines like Ly , Oxygen or the Balmer transitions are no longer pumped, and therefore drop to intrinsecally small equivalent widths (Schaerer 2003). We can image a geometrical configuration in which there is a high fraction of escaping ionizing radiation and at the same time a high Ly equivalent width in emission; it can be realized with a sort of “unipolar” outflow behind the source that backscatters the Ly photons to the observer (as is usually seen), while along the line of sight (the front of the galaxy), the ISM and CGM are free from dust or gas attenuation and the LyC radiation can escapes. However, situations like this have never been clearly observed until now and the interplay between the escape fraction of ionizing and Ly photons is still not known.
It is worth noting that the absence of Ly emission from an object with high , like Ion1, makes extremely difficult the spectroscopic confirmation of similar sources at , i.e. during the reionization epoch. Indeed, if place at it would be one magnitude fainter, , and the continuum break hard to measure spectroscopically (Vanzella et al. 2011; Fontana et al. 2010; Pentericci et al. 2011).
7. Conclusions
The observation of the LyC in distant galaxies is a difficult task because several attenuations occur: in the galaxy itself and circumgalactic medium (by dust and nutral hydrogen gas) and along the intergalactic travel (Lyman alpha forest, LLSs and DLAs). A further complication is related to the possible presence of foreground (lower-z) superimposed sources that can mimic the LyC emission of the background galaxy. It is therefore crucial to establish whether they are genuinely associated with the redshift of the main LBG.
In this work we have discussed three diagnostics that can be used to constrain the redshift of these offset and faint sources. To this end, the deep and high angular resolution multi-wavelength images available from the GOODS and CANDELS surveys have been exploited. In particular, starting from the sample of U-band emitters identified in V10b, we (1) calculated accurate photometric redshifts, (2) considered the IGM radial and transverse absorption (simulating UV colors and comparing those of LBGs and their U-band emitters) and (3) provided new constraints on their nature by calculating the quantity under conservative assumption. These three analysis suggest that none of offset U-band sources are actual sources of LyC emission from the LBGs at , but are instead foreground interlopers. This strengthens the results of V10b, i.e., the median quantity is very small for galaxies, or assuming a bimodal distribution for the , the higher values are rare.
At present, the offset candidates reported in literature by S06, I09 and N11 need spectroscopic redshift confirmation and are difficult to access if deep multi-wavelength high angular resolution imaging is not available.
Moreover, we note that in order to avoid biased measures, the calculation of the quantity in the case of spatially offset emission must be performed carefully considering quantities arising from the same physical region. We argue that the measurements reported by S06, I09 and N11 are affected by this problem and need futher investigations.
The current situation is far from clear. The number of bona fide LyC detections at is very small and not statistically significant.
We have discovered one good candidate (named Ion1) that is currently the highest redshift galaxy known with direct LyC detection. Its LyC emission at Å (probed by the U-band) is aligned with the source detected in the UV nLyC, i.e., no offset is observed with this resolution. Apart from the three cases reported by Inoue et al. (2011) with aligned LyC emission that need Population-III stars to explain their observed flux ratios (even smaller than one), the Ion1 emission is easily explainable with standard stellar population and an . If the AGN component is negligible, as seems to be the case from the X-ray and spectroscopic data, it would be the most promising stellar ionizer that may resemble those responsible for HI reionization.
It is worth noting that a high value of the escape fraction would correspond to faint nebular emission (e.g., Robertson et al. 2010). In this case the Ly line is not in emission, despite the fact that the source shows a blue UV spectral slope (), relatively weak interstellar absorption lines and compact morphology, all characteristics that positively correlate with the strength of the Ly emission line (e.g., Shapley et al. 2003; V09; Pentericci et al. 2010; Balestra et al. 2010). It is not clear if the absence of Ly is connected to the high value of the or due to other effects like the dust attenuation, that however, would be small, giving the blue UV slope.
Its relatively low stellar mass () may also be a signature that feedback processes were more efficient to clean the line of sight in this type of galaxy, favoring the escape of ionizing radiation. Precisely in this regard a measure of the wind velocity is important (Heckman et al. 2011; Overzier et al. 2010). We note that Ion1 is not a LAE, therefore it is important to complement the LAE surveys with sources like this. Clearly sources like Ion1 placed at z7 would be extremely difficult to detect spectroscopically with present facilities. However, since at the direct measure of LyC is not feasible, sources like Ion1 are the only viable ways we have to investigate the mechanism that allow the ionization ratiation to escape, i.e., to address the interplay between the quantity and the non-ionizing UV features like the strength of the nubular emission lines (e.g., Oxigen, Balmer and Lyman lines), UV slopes, nature of the stellar populations, geometry, winds, etc.
References
- Balestra et al. (2010) Balestra, I., Mainieri, V., Popesso, P., Dickinson, M., et al., 2010, A&A, 512, 12
- Beckwith et al. (2006) Beckwith, S. V. W., et al. 2006, AJ, 132, 1729
- Boutsia et al. (2011) Boutsia, K., Grazian, A., Giallongo, E., Fontana, A., Pentericci, L., Castellano, M., Zamorani, G., Mignoli, M., Vanzella, E., Fiore, F., Lilly, S. J., Gallozzi, S., Testa, V., Paris, D., Santini, P., 2011, ApJ, 736, 41
- Calzetti et al. (2000) Calzetti, Daniela, Armus, Lee, Bohlin, Ralph C., Kinney, Anne L., Koornneef, Jan, Storchi-Bergmann, Thaisa, 2000, ApJ, 533, 682
- Cappetta et al. (2010) Cappetta, M., D’Odorico, V., Cristiani, S., Saitta, F., Viel, M., 2010, MNRAS, 407, 1290
- Castellano et al. (2011) Castellano, M., Fontana, A., Grazian, A., Pentericci, L., Santini, P., Koekemoer, A., Cristiani, S., Galametz, A., Gallerani, S., Vanzella, E., Boutsia, K., Gallozzi, S., Maiolino, R., Menci, N., Paris, D., 2011, arXiv/1109.1757
- D’Odorico et al. (1998) D’Odorico, V., Cristiani, S., D’Odorico, S., Fontana, A., Giallongo, E., Shaver, P., 1998, A&A, 339, 678
- Fanidakis et al. (2011) Fanidakis, N., Baugh, C. M., Benson, A. J., Bower, R. G., Cole, S., Done, C., Frenk, C. S., Hickox, R. C., Lacey, C., Del P. Lagos, C., MNRAS, tmp.2006
- Fang et al. (1996) Fang, Yihu, Duncan, Robert C., Crotts, Arlin P. S., Bechtold, Jill, 1996, ApJ, 462, 77
- Faucher-Giguère et al. (2009) Faucher-Giguère, Claude-André, Lidz, Adam, Zaldarriaga, Matias, Hernquist, Lars, 2009, ApJ, 703, 1416
- Fiore et al. (2011) Fiore, F., Puccetti, S., Grazian, A., Menci, N., Shankar, F., Santini, P., Piconcelli, E., Koekemoer, A. M., Fontana, A., Boutsia, K., Castellano, M., Lamastra, A., Malacaria, C., Feruglio, C., Mathur, S., Miller, N., Pannella, M., 2011, arXiv/1109.2888
- Fontana et al. (2010) Fontana, A., Vanzella, E., Pentericci, L., Castellano, M., Giavalisco, M., Grazian, A., Boutsia, K., Cristiani, S., Dickinson, M., Giallongo, E., Maiolino, R., Moorwood, A., Santini, P., ApJ, 725, 205
- Giallongo et al. (2002) Giallongo E., Cristiani S., D’Odorico S., et al., 2002,ApJ, 568, 9
- Giavalisco et al. (2004) Giavalisco, M., Ferguson, H. C., Koekemoer, A. M., Dickinson, M., Alexander, D. M., Bauer, F. E., Bergeron, J., et al. 2004, ApJ, 600, L93
- Grogin et al. (2011) Grogin, N. A. et al. 2011, ApJS, 197, 35
- Haardt & Madau (2011) Francesco Haardt, Piero Madau, 2011, ApJ, submitted,(arxiv/1105.2039)
- Heckman et al. (2011) Heckman, Timothy M., Borthakur, Sanchayeeta, Overzier, Roderik, Kauffmann, Guinevere, Basu-Zych, Antara, Leitherer, Claus, Sembach, Ken, Martin, D. Chris, Rich, R. Michael, Schiminovich, David, Seibert, Mark, 2011, ApJ, 730, 5
- Hu et al. (2009) Hu, Esther M., Cowie, Lennox L., Kakazu, Yuko, Barger, Amy J., 2009, ApJ, 698, 2014
- Inoue et al. (2005) Inoue, A. K., Iwata, I., Deharveng, J.-M., Buat, V., Burgarella, D., 2005, A&A, 435, 471
- Inoue & Iwata (2008) Inoue, Akio K., Iwata, Ikuru, 2008, MNRAS, 387, 1681
- Inoue et al. (2011) Inoue, A. K., Kousai, K., Iwata, I., Matsuda, Y., Nakamura, E., Horie, M., Hayashino, T., Tapken, C., Akiyama, M., Noll, S., Yamada, T., Burgarella, D., Nakamura, Y., 2011, MNRAS, 411, 2336
- Inoue (2011) Inoue, A. K., 2011, MNRAS, 415, 2920
- Iwata et al. (2009) Iwata, I., Inoue, A. K., Matsuda, Y., et al., 2009, ApJ, 692, 1287
- Izotov et al. (2011) Izotov, Yuri I., Guseva, Natalia G., Thuan, Trinh X., 2009, ApJ, 728, 161
- Laidler et al. (2007) Laidler, Victoria G., Papovich, Casey, Grogin, Norman A., Idzi, Rafal, Dickinson, Mark, Ferguson, Henry C., Hilbert, Bryan, Clubb, Kelsey, Ravindranath, Swara, 2007, PASP, 119, 1325
- Law et al. (2007) Law, David R., Steidel, Charles C., Erb, Dawn K., Pettini, Max, Reddy, Naveen A., Shapley, Alice E., Adelberger, Kurt L., Simenc, David J., 2007, ApJ, 656, 1
- Madau (1995) Madau, P., 1995, ApJ, 441, 18
- Meiksin (2006) Meiksin, Avery, 2006, MNRAS, 365, 807
- Oke (1974) Oke, J.B., 1974, ApJS, 27, 21
- Kakazu et al. (2007) Kakazu, Yuko, Cowie, Lennox L., Hu, Esther M., 2007, ApJ, 668, 853
- Koekemoer et al. (2011) Koekemoer, A. M. et al. 2011, ApJS, 197, 36
- Kornei et al. (2010) Kornei, Katherine A., Shapley, Alice E., Erb, Dawn K., Steidel, Charles C., Reddy, Naveen A., Pettini, Max, Bogosavljević, Milan, ApJ, 711, 693
- Nestor et al. (2011) Nestor, D. B., Shapley, A. E., Steidel, C. C., Siana, B., ApJ, in press, (arXiv/1102.0286), N11
- Nonino et al. (2009) Nonino, M., Dickinson, M., Rosati, P., et al., 2009, ApJ, 183, 244
- Overzier et al. (2009) Overzier, Roderik A., Heckman, Timothy M., Tremonti, Christy, Armus, Lee, Basu-Zych, Antara, Gonçalves, Thiago, Rich, R. Michael, Martin, D. Christopher, Ptak, Andy, 2009. ApJ,706, 203
- Pentericci et al. (2010) Pentericci, L., Grazian, A., Scarlata, C., Fontana, A., Castellano, M., Giallongo, E., Vanzella, E., 2010, A&A, 514, 64
- Pentericci et al. (2011) Pentericci, L., Fontana, A., Vanzella, E., Castellano, M., Grazian, A., Dijkstra, M., Boutsia, K., Cristiani, S., Dickinson, M., Giallongo, E., Giavalisco, M., Maiolino, R., Moorwood, A., Paris, D., Santini, P., 2011, ApJ, 743, 132
- Popesso et al. (2008) Popesso, P., Dickinson, M., Nonino, M., Vanzella, E., Daddi, E., et al., 2009, A&A, 494, 443P
- Prochaska et al. (2010) Prochaska, J. Xavier, O’Meara, John M., Worseck, Gabor, ApJ, 2010, 718, 392
- Rauch et al. (2005) Rauch, Michael, Becker, George D., Viel, Matteo, Sargent, Wallace L. W., Smette, Alain, Simcoe, Robert A., Barlow, Thomas A., Haehnelt, Martin G., ApJ, 632, 58
- Retzlaff et al. (2010) Retzlaff, J., Rosati, P., Dickinson, M., Vandame, B., Rité, C., Nonino, M., Cesarsky, C., GOODS Team, 2010, A&A, 511, 50
- Robertson et al. (2010) Robertson, Brant E., Ellis, Richard S., Dunlop, James S., McLure, Ross J., Stark, Daniel P., 2010, Nature, 468, 49
- Santini et al. (2009) Santini, P., Fontana, A., Grazian, A., Salimbeni, S., Fiore, F., Fontanot, F., et al., 2009, A&A, 504, 751
- Schaerer (2003) Schaerer, D., 2003, A&A, 397,527
- Shapley et al. (2003) Shapley, A.E., Steidel, C.C., Pettini, M., Adelberger, K.L., 2003, ApJ, 588, 65
- Shapley et al. (2006) Shapley, A. E., Steidel, C. C., Pettini, M., Adelberger, K. L., & Erb, D. K. 2006, ApJ, 651, 688
- Siana et al. (2007) Siana, B., Teplitz, H. I., Colbert, J., et al., 2007, ApJ, 668, 62S
- Siana et al. (2008) Siana, Brian, Polletta, Maria del Carmen, Smith, Harding E., Lonsdale, Carol J., et al., 2008, ApJ, 675, 49
- Songaila & Cowie (2010) Songaila, Antoinette, Cowie, Lennox L., 2010, ApJ, 721 1448
- Steidel et al. (1998) Steidel, Charles C., Adelberger, Kurt L., Dickinson, Mark, Giavalisco, Mauro, Pettini, Max, Kellogg, Melinda, 1998, ApJ, 492, 428
- Steidel et al. (2001) Steidel, C. C., Pettini, M., & Adelberger, K. L. 2001, ApJ, 546, 665
- Vanzella et al. (2008) Vanzella, E., Cristiani, S., Dickinson, M., Giavalisco, M., et al., 2008, A&A, 478, 83
- Vanzella et al. (2009) Vanzella, E., Giavalisco, M., Dickinson, M., et al., 2009, ApJ, 695, 1163
- Vanzella et al. (2010a) Vanzella, E., Siana, B., Cristiani, S., Nonino, M., 2010a, MNRAS, 404, 1672
- Vanzella et al. (2010b) Vanzella, E., Giavalisco, M., Inoue, A. K., Nonino, M., Fontanot, F., Cristiani, S., Grazian, A., Dickinson, M., Stern, D., Tozzi, P., Giallongo, E., Ferguson, H., Spinrad, H., Boutsia, K., Fontana, A., Rosati, P., Pentericci, L., 2010b, ApJ, 725, 1011
- Vanzella et al. (2011) Vanzella, E., Pentericci, L., Fontana, A., Grazian, A., Castellano, M., Boutsia, K., Cristiani, S., Dickinson, M., Gallozzi, S., Giallongo, E., Giavalisco, M., Maiolino, R., Moorwood, A., Paris, D., Santini, P., 2011, ApJ, 730, 35
- Windhorst et al. (2011) Windhorst, Rogier A., Cohen, Seth H., Hathi, Nimish P., McCarthy, Patrick J., Ryan, Russell E., Jr., Yan, Haojing, Baldry, Ivan K., Driver, Simon P., Frogel, Jay A., Hill, David T., Kelvin, Lee S., Koekemoer, Anton M.,Mechtley, Matt, et al., ApJ, 193, 27
- Xue et al. (2011) Xue, Y. Q., Luo, B., Brandt, W. N., Bauer, F. E., Lehmer, B. D., Broos, P. S., Schneider, D. P., Alexander, D. M., Brusa, M., Comastri, A., Fabian, A. C., Gilli, R., Hasinger, G., Hornschemeier, A. E., Koekemoer, A., Liu, T., Mainieri, V., Paolillo, M., Rafferty, D. A., Rosati, P., Shemmer, O., Silverman, J. D., Smail, I., Tozzi, P., Vignali, C., 2011, ApJ, 195, 10


| GOODS-ID | () | |||||||
|---|---|---|---|---|---|---|---|---|
| () | (arcsec) | LBG | GOODS,CANDELS | () | (LBG-) | (LBG-) | (%) | |
| J033200.95-274443.4 | 1.45 | 3.485 | 1.10(0.06),-1.00 | 23,27 | 1.06 | – | 1.80 | 251 |
| J033203.33-274524.6 | 1.90 | 3.472 | 2.34(0.15),1.92(0.08) | 97,26 | 1.13 | – | 1.20 | 376 |
| J033204.91-274451.0⋆ | 0.70 | 3.404 | 1.98(0.23),-1.00 | 19,16 | 1.71 | – | 0.66 | 792 |
| J033212.88-274833.1 | 1.50 | 4.292 | 1.44(0.09),1.48(0.05) | 30,1 | – | 1.15 | 1.01 | 724 |
| J033217.47-274141.6 | 1.20 | 3.780 | 0.52(0.04),0.51(0.03) | 20,4 | 1.00 | – | 6.85 | 76 |
| J033217.41-275200.3 | 1.40 | 3.494 | 0.93(0.18),0.67(0.24) | 10,15 | 1.07 | – | 2.29 | 197 |
| J033217.79-275050.4 | 1.60 | 3.477 | 1.55(0.03),1.52(0.08) | 8,13 | 1.58 | – | 1.77 | 255 |
| J033218.85-275134.3 | 1.30 | 3.659 | 1.46(0.06),1.18(0.05) | 35,4 | 2.17 | – | 1.31 | 373 |
| J033219.02-274148.6 | 1.10 | 3.764 | 1.90(0.14),1.75(0.03) | 20,1 | 2.82 | – | 1.54 | 339 |
| J033220.95-275021.8⋆ | 0.60 | 3.478 | 2.66(0.07),-1.00 | 14,6 | 1.22 | – | 3.08 | 146 |
| J033222.79-274439.0 | 1.30 | 3.582 | 0.58(0.75),0.39(0.02) | 28,11 | 0.85 | – | 2.27 | 210 |
| J033222.95-274727.8⋆ | 0.80 | 4.440 | 0.46(0.46),-1.00 | 4,1 | – | 1.05 | 2.31 | 325 |
| J033223.32-275155.9 | 1.10 | 3.470 | 0.07(0.07),-1.00 | 19,12 | 1.36 | – | 4.45 | 102 |
| J033226.43-274124.5⋆ | 0.70 | 4.384 | 2.31(0.16),2.32(0.20) | 19,4 | – | 0.56 | 2.68 | 280 |
| J033228.95-274232.9 | 1.40 | 3.585 | 2.72(0.18),2.77(0.17) | 12,11 | 1.05 | – | 2.42 | 197 |
| J033234.33-274123.0 | 1.60 | 3.418 | 2.30(0.25),2.33(0.31) | 17,11 | 1.31 | – | 2.86 | 148 |
| J033236.85-274557.6b | 0.40 | 3.797 | -1.00,-1.00 | 5,6 | 1.80 | – | 1.36 | 387 |
| J033240.48-274431.7 | 1.40 | 4.120 | 2.39(0.07),1.87(0.04) | 36,2 | – | 0.54 | 1.24 | 505 |
| J033253.57-275300.1 | 1.10 | 3.472 | 2.17(0.25),-1.00 | 9,16 | 1.06 | – | 1.66 | 272 |
| (Ion1) | 0.1′′ | 3.795 | 3.64(0.04),3.68(0.09) | 10.3 | – | – | 15.00 | 35 |
Appendix A The Case Of The LBG HUDF J033236.83-274558.0
Figure 8 shows the HST/ACS images of the offset U–band LyC emitter candidate that we have identified at ′′ from LBG HUDF J033236.83-274558.0 at (its celestial coordinates are RA=03:32:36.85, DEC=-27:45:57.6). This pair has already been discussed by V10a, who argued that the LyC candidate is most likely a low redshift interloper. Here we add another piece of evidence in support of this interpretation. We have complemented the ACS optical photometry, which takes advantage of the HUDF images (Beckwith et al. 2006), with the new WFC3/IR data obtained as part of the CANDELS project (Koekemoer et al. 2011; Grogin et al. 2011) in the Y (F105W), J (F125W) and H (F160W) bands. The SED of the from 0.5 to 1.6 is blue, essentially consistent with a flat spectrum, i.e., , except in the band where the source is 0.43 mags brighter (at 10-sigma), namely =28.630.2, =28.590.05, =28.310.03, =28.310.03, =28.230.05, =28.310.07, =27.880.04 and =28.320.06. Using the HST photometry alone, with or without the U band, the photometric redshift remains unchanged, i.e., .
At the redshift of the LBG, , the band probes the rest–frame spectral range Å where there are no strong emission lines, except for the possible [Mg ii] 2797,2803 P–Cygni feature, which, however, has not been observed to yield any net emission in star–forming galaxies at redshift up to (e.g., Weiner et al. 2009; Rubin et al. 2010; Giavalisco et al. 2011). The simplest and, in our view, most convincing interpretation is that the U–band source is at lower redshift and the J band flux is boosted by an emission line (or more than one), most likely [O ii] or H and [O iii].
All photometric redshift solutions lie at . The required rest–frame equivalent width of a single line to boost the –band flux of 0.4 magnitude is 670Å if H at (), or 383Å if [O ii]3727 at ().
Also the complex of the three lines H, [O iii] 4959 and [O iii] 5007 can fall in the suitable wavelength interval. In the case of H we would detect [O ii]3727, H, and [O iii] 4959 – 5007 in the spectrum of the LBG, that is not the case. Similarly, in the case of H and [O iii] complex, the [O ii]3727 line would be present in the spectrum of the LBG at 9700Å. However in this latter case it may be too faint to be detected. Therefore we exclude the H possibility only, and keep the other two configurations.
Given the response curve of the WFC3/Y/J/H filters, in order to have the above complex of three lines or the single [O ii]3727 line in the filter only (green shaded region of Figure 8), the redshift of the source would be or , respectively.
As mentioned above, the required rest-frame equivalent widths are high (larger than 300Å), however we note that ultra-strong emission line (compact) galaxies with these features have been recently detected (Kakazu et al. 2007; Hu et al. 2009; Izotov et al. 2011 and more recently van der Wel et al. 2011). Our source would extend their findings to a more extreme limit of luminosity, i.e., a rest-frame absolute –band magnitude of -16.86. Going a bit more into the details, we note that the SED shows a significant decrease of flux in the and bands (see Figure 8), that would be consistent with the redshift , which corresponds to Å. Conversely, in the case of [O ii]3727 at , these bands are affected by the IGM and the Lyman limit attenuation. Indeed the best photometric redshift solution is . Therefore we argue that the compact source describe here is at and a probable strong Oxygen emitter (similar to those recently identify in the CANDELS survey by van der Wel et al. 2011), that mimic a LyC emission of the background LBG.