Very fast photometric and X-ray observations of the intermediate polar
V2069 Cygni (RX J2123.7+4217)
Abstract
We present fast timing photometric observations of the intermediate polar V2069 Cygni (RX J2123.7+4217) using the Optical Timing Analyzer (OPTIMA) at the 1.3 m telescope of Skinakas Observatory. The optical (450-950 nm) light curve of V2069 Cygni was measured with sub-second resolution for the first time during July 2009 and revealed a double-peaked pulsation with a period of . A similar double-peaked modulation was found in the simultaneous Swift satellite observations. We suggest that this period represents the spin of the white dwarf accretor. Moreover, we present the results from a detailed analysis of the XMM–Newton observation that also shows a double-peaked modulation, however shifted in phase, with s period. The X-ray spectra obtained from the XMM–Newton EPIC (European Photon Imaging Camera) instruments were modelled by a plasma emission and a soft black body component with a partial covering photo-electric absorption model with covering fraction of 0.65. An additional Gaussian emission line at 6.385 keV with an equivalent width of 243 eV is required to account for fluorescent emission from neutral iron. The iron fluorescence (6.4 keV) and FeXXVI lines (6.95 keV) are clearly resolved in the EPIC spectra. In the Porb–Pspin diagram of IPs, V2069 Cyg shows a low spin to orbit ratio of 0.0276 in comparison with 0.1 for other intermediate polars.
keywords:
stars:binaries - stars:novae, cataclysmic variables - X-rays: binaries - stars:magnetic field - stars:individual: V2069 Cyg (RX J2123.7+4217)1 Introduction
Magnetic cataclysmic variables (CVs) are interacting close binary systems in which material transferred from a Roche-lobe filling low mass companion is accreted by a magnetic white dwarf (WD). Magnetic CVs are subdivided in two groups: polars (or AM Her type) and intermediate polars (IPs; or DQ Herculis type). In polars, the WD has a sufficiently strong magnetic field (B G) which locks the system into synchronous rotation (Pspin = Porb) and prevents the accretion disk to form around the WD. In IPs, the field of the WD is one order of magnitude weaker (B G), and therefore insufficient to force the WD to spin with the same period as the binary system orbits (Pspin Porb). The accretion in IPs happens through a disk with a disrupted inner region (Cropper, 1990; Patterson, 1994; Warner, 1995; Hellier, 2001).
V2069 Cyg (RX J2123.7+4217) was discovered as a hard X-ray source by Motch et al. (1996) and identified as a CV. Thorstensen & Taylor (2001) reported a most probable orbital period of 0.311683 days (7.48 h) from their spectroscopic observations. de Martino et al. (2009) performed a preliminary analysis of XMM–Newton observations that showed a strong peak at the fundamental frequency of 116.3 cycles d-1 and harmonics up to the third in the power spectrum. Additionally, the sinusoidal fit to the profile from both EPIC-pn and EPIC-MOS data revealed a fundamental period of s and 55 per cent pulsed fraction. They also reported a spectral fit consisting of a 56 eV black body (bbody) component plus 16 keV thermal plasma emission and a Gaussian at 6.4 keV emission line with an equivalent width (EW) of 159 eV, being absorbed by a partial (69 per cent) covering model with and a total absorber with . Their spectral analysis confirmed that V2069 Cyg is a hard X-ray emitting IP with a soft X-ray component. Butters et al. (2011) carried out an analysis of RXTE data in the energy range and found the spin period of the V2069 Cyg WD to be with a double-peak modulation. They also reported the spectral results with a 6.4 keV iron line which is typical of IPs.
2 Observations
2.1 High time resolved photometric observations
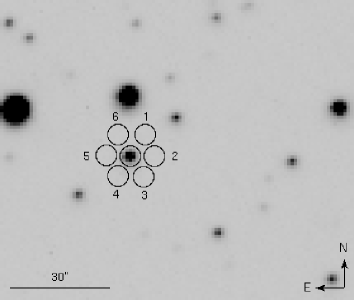
We performed photometric observations of V2069 Cyg with the Optical Timing Analyzer (OPTIMA) instrument at the 1.3 m telescope at Skinakas Observatory, Crete, Greece. The high-speed photometer OPTIMA is a sensitive, portable detector to observe extremely faint optical pulsars and other highly variable astrophysical sources. The detector contains eight fibre-fed single photon counters-avalanche photo-diodes (APDs), and a GPS (Global Positioning System) for the time control. Single photons are recorded in all channels with absolute time tagging accuracy of . The quantum efficiency of the APDs reaches a maximum of 60 at 750 nm and lies above 20 in the range 450–950 nm (Kanbach et al., 2003). To observe V2069 Cyg OPTIMA was pointed at RA(J2000) = , Dec(J2000) = , corresponding to the central aperture of a hexagonal bundle of fibres (Fig. 1). A separate fibre is located at a distance of as a night sky background monitor. The log of the observations is given in Tab. 1.
2.2 Swift/XRT observations
The simultaneous soft X-ray observations of V2069 Cyg were performed with the Swift’s X-ray telescope (XRT; Burrows etal. 2005) in the energy range of 0.310 keV. The CCD of the Swift/XRT was operated in the Photon-Counting mode which retains full imaging and spectroscopic resolution with a time resolution of 2.54 s. The Swift source position is: RA(J2000) = Dec.(J2000) = with an error radius of . For the XRT data we applied the following types of filters: grade 0–4, and a circular region filter centred at the position of the source with 10-pixels radius (corresponding to ).
2.3 XMM–Newton observations
The XMM–Newton observation of V2069 Cyg was performed on 2009 April 30 (Observation ID: 0601270101). The EPIC instruments were operated in full-frame imaging mode with thin and medium optical blocking filters for EPIC-pn (Strüder etal., 2001) and EPIC-MOS (Turner et al., 2001), respectively. The exposure times were 26433 s for EPIC-pn, 28023 s for EPIC-MOS1, 28029 s for EPIC-MOS2. We used the XMM–Newton Science Analysis Software (SAS) v.10.0.0 to process the event files. The source coordinates derived from a standard source detection analysis of the combined EPIC images are RA(J2000) = , Dec(J2000) = . We identified the circular photon extraction regions (with radius of , and for EPIC-pn, EPIC-MOS1 and EPIC-MOS2 respectively) around the source by optimising the signal to noise ratio. A circular region was used for the background extraction from a nearby source-free area (with radius of ) on the same CCD as the source. To create spectra we selected single-pixel events (PATTERN=0) from EPIC-pn data and single- to quadruple-pixel events (PATTERN 0–12) from EPIC-MOS data. For the timing analysis we used single- and double-pixel events from the EPIC-pn data (PATTERN 0–4), and single- to quadruple-pixel events from EPIC-MOS data. We sorted out bad CCD pixels and columns (FLAG=0). After the standard pipeline processing of the EPIC photon event files, we rejected some part of the data which was affected by very high soft proton background. We created good time intervals (GTIs) from background light curves ( band) using count rates below 15 cts ks-1 arcmin-2 for EPIC-pn data and 2.5 cts ks-1 arcmin-2 for MOS data. The spectra of EPIC-pn, EPIC-MOS1 and EPIC-MOS2 contain 10576, 5908, and 6000 background subtracted counts, respectively.
| No. | Date | Detector | ObsBeg | Expo. |
|---|---|---|---|---|
| 2009 | (MJD) | (h) | ||
| 1 | Jul 02 | OPTIMA | 55014.922 | 2.5 |
| 2 | Jul 18 | OPTIMA | 55030.951 | 1.2 |
| 3 | Jul 19 | OPTIMA | 55031.845 | 2.1 |
| 4 | Jul 21 | OPTIMA | 55033.820 | 4.1 |
| 5 | Jul 22 | OPTIMA | 55034.871 | 3.0 |
| 6 | Jul 24 | OPTIMA | 55036.804 | 1.2 |
| 7 | Jul 26 | OPTIMA | 55038.040 | 1.4 |
| 8 | Jul 26 | OPTIMA | 55038.827 | 1.7 |
| 9 | Jul 28 | OPTIMA | 55040.897 | 1.5 |
| A | Jul 21 | Swift | 55033.786 | 0.8 |
| B | Jul 22 | Swift | 55034.048 | 0.9 |
| C | Apr 30 | XMM–Newton | 54951.463 | 7.8 |
3 Data Analysis
3.1 Timing analysis of the OPTIMA and Swift/XRT data
We analysed the data using the HEASOFT analysis package v.6.9. The X-ray and optical photon arrival times were converted to the solar system barycentre. OPTIMA count rates of the source were obtained from the central fibre (see Fig. 1). Raw data were binned with 1 s and, after ’flat-fielding’ all fibre channels on a source free region of sky background, the corresponding calibrated background counts were subtracted. We chose the fibre number 5 as the best representative of the background, because its APD response was closest to the APD response of channel 0 (Fig. 2).
The resulting photometric light curve shows a prominent periodic variability (Fig. 3). The power spectrum was computed with the Fast Fourier Transform (FFT) algorithm and normalised such that the white noise level expected from the data uncertainties corresponds to a power of 2 (Fig. 4). The power spectrum shows peaks at the fundamental spin frequency (first harmonic) 0.00134277 Hz and its second harmonic 0.00268555 Hz (periods 744.73 s and 372.35 s, respectively), as well as a known systematic frequency of 0.03718 Hz (26.9 s). A folding analysis which folds the data over a range of periods reveals the best spin period of the WD as , Fig. 5.


The optical light curve folded with the 743.38 s spin period shows a double-peaked profile (see Fig. 6) with very high duty cycle ( per cent), that is the percentage of the rotation phase where there is a pulsed emission. Since the power spectrum of the optical data is dominated by the second harmonic of the spin frequency it is clearly seen that these two peaks are similar and separated by about half of the cycle in phase. Norton et al. (1999) reported the same result in the X-ray data of IP YY Dra, where the power spectrum is dominated by the second harmonic (i.e. ). On the other hand, due to low statistics, we could not determine the spin period from the Swift-XRT data, therefore the XRT data were folded according to the optical period. The Swift/XRT also shows a double-peak modulation at the WD spin period of 743.38 s (see Fig. 7). However, the weaker peak is only marginally visible and is separated by less than half the pulse cycle.


3.2 Timing analysis of the XMM–Newton data
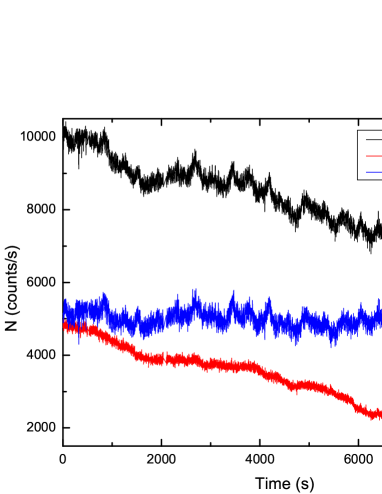
For the timing analysis of the XMM–Newton data we corrected the event arrival times to the solar system barycentre. The background subtracted X-ray light curves in the 0.210.0 keV energy band obtained from EPIC-pn and combined MOS data with a time binning of 55 s are shown in Fig. 8. The periodic variations around 745 s can be seen clearly in the X-ray light curves. To improve the statistics for timing analysis a combined EPIC-pn, EPIC-MOS1 and EPIC-MOS2 event list from the source extraction region was created. The FFT timing analysis of the combined X-ray data revealed the presence of four harmonic frequencies with a strong peak at the fundamental frequency of 0.00134277 Hz that corresponds to a period of 744.73 s, as shown in Fig. 9. We found that the fundamental frequency is much stronger than the second harmonic at energies above 0.5 keV, while the second harmonic (with very weak power) is stronger than the fundamental frequency at energies below 0.5 keV. A similar behaviour was also reported by Evans & Hellier (2004) for V405 Aur. To determine the pulse period and its error we applied the Bayesian formalism as described in Gregory & Loredo (1996). Using the combined and merged EPIC data in the 0.210 keV energy band reveals the spin period of the WD as , 1 uncertainty. We obtained the optical spin period a bit longer than the X-ray spin period, however both periods are compatible within their errors.


We folded the light curve to obtain the pulse profiles from the EPIC data (Fig. 10) with the spin period in the different energy bands of 0.21.0 keV, 1.02.0 keV, 2.04.5 keV and 4.510.0 keV and calculated hardness ratios (Fig. 11) as a function of pulse phase. The hardness ratios were derived from the pulse profiles in two neighbouring standard energy bands [HRi=(RRi)/(Ri+1+Ri), where Ri denotes the background subtracted count rate in the energy band , with from 1 to 4]. The XMM–Newton data also show a double-peaked modulation with 742.35 s period consistent with the values obtained from OPTIMA, Swift/XRT and RXTE data. The double-peaked pulse profile is more prominent at lower energies (0.20.7 keV), while the second peak is weaker at the higher energies (0.710.0 keV; see Fig. 12). Here the second peak is separated by less than half of the pulse cycle, and the power spectrum of the X-ray data is dominated by the fundamental spin frequency (i.e. 1/Pspin). A similar behaviour was observed in the X-ray data of IP V709 Cas by Norton et al. (1999), where the power spectrum is dominated by the fundamental harmonic. The pulse profiles have highly asymmetrical rise and decay flanks. A dip feature is significant before the primary pulse maximum in the 0.21.0 keV band and centred on the primary maximum in the 1.02.0 keV band, while the primary maximum is more symmetric at higher energies (Fig. 10). A similar feature was also observed in V709 Cas (de Martino et al., 2001), in NY Lup (Haberl et al., 2002) and in UU Col (de Martino et al., 2006b). The evolution of the pulse profiles with double-peaked structure from lower energies to higher, is causing the variations in the hardness ratios. In Fig. 11, the hardness ratios show a hardening (increase) at spin minimum and a softening (decrease) at spin maximum which is more prominent in HR3. This typical behaviour is often observed from IPs and is generally produced by the larger photoelectric absorption when viewing along the accretion curtain (de Martino et al., 2001; Haberl et al., 2002). In HR2, the ratio shows two asymmetric maxima, separated by a dip centred on the primary spin maximum seen in the 1.02.0 keV band and a second one appearing with a toothed-shape produced by the secondary spin maximum (see Fig. 10). In HR1, an antiphase behaviour is observed with respect to HR2.


3.3 Orbital phase resolved timing analysis
We investigated if the pulse shape of the rotating WD is changing with orbital phase of the binary system. The orbital phase was determined with the following ephemeris: phase (BJD)= , where, T is the observation time (Thorstensen & Taylor, 2001). For this purpose we obtained the WD pulse profiles in four orbital phase ranges: 0.00.25, 0.250.5, 0.50.75 and 0.751.0. Results are shown in the Fig. 13 and Fig. 14 for OPTIMA and EPIC data, respectively. There is some indication of a profile change, especially in the orbital phase range 0.50.75, for both optical and X-ray light curves.


3.4 Spectral analysis of the XMM–Newton data
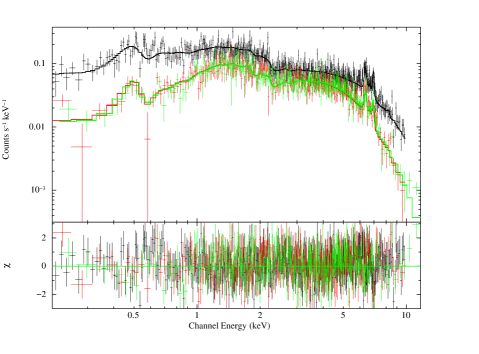
In order to estimate the basic parameters of the emitting region, a spectral analysis of the X-ray data was performed with XSPEC v.12.5.0x (Arnaud, 1996). The three EPIC spectra were fitted simultaneously with a model consisting of thermal plasma emission (MEKAL; Mewe et al. 1985 ) and a soft bbody component (as suggested by de Martino et al., 2009), absorbed by a simple photoelectric absorber (phabs) and a partially-covering photoelectric absorber (pcfabs). An additional Gaussian line is required which represents iron K fluorescent emission at 6.4 keV as is often seen from classical IPs. To account for cross-calibration uncertainties a constant factor was introduced. The absorbers phabs and pcfabs describe the absorptions of the interstellar (along the line of sight) and circumstellar (inside the system by the accretion curtain/stream), respectively (Staude et al., 2008). The MEKAL model produces an emission spectrum from hot diffuse gas above the WD’s surface and includes line emissions from various elements. In a first fit to the spectra, the plasma temperature for the MEKAL component could not be constrained. Therefore, we fixed the plasma temperature at 20 keV, a value typical for IPs (Staude et al., 2008). We obtained a best fit with reduced of 1.002 ( of 1014.69 with 1013 degrees of freedom). The spectral parameters for the fit are summarised in Tab. 2 and the spectra including the best fit model is shown in Fig. 15.
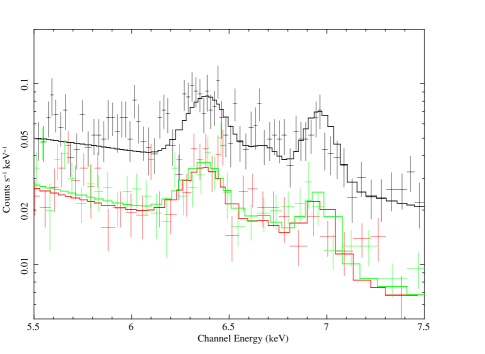
We determined the hydrogen column density as . This is higher than the total Galactic hydrogen column density (, an interpolated value from Dickey & Lockman (1990) that was calculated using the HEASARC web interface111http://heasarc.nasa.gov/cgi-bin/Tools/w3nh/w3nh.pl) in the direction of the source. Our result is comparable to the value () obtained by de Martino et al. (2009). For the partial absorber we find, with a covering fraction of 0.65. Similar values of partial absorber were derived for V2069 Cyg (de Martino et al., 2009) and the other soft IPs observed with XMM–Newton (see Tab. 3). The absorbed flux of V2069 Cyg in the 0.210.0 keV energy band (derived for EPIC-pn) is which corresponds to a source intrinsic flux (with absorption set to 0) of (EPIC-MOS values are 2 per cent higher corresponding to the constant factors derived from the fit). The spectra around the Fe-K emission line complex are shown enlarged in Fig. 16. The iron fluorescence and FeXXVI lines are clearly resolved in the EPIC spectra. The FeXXVI line energy identified from the XSPEC possible lines list is 6.95 keV and the fluorescence line energy derived from the fit is 6.385 0.017 keV. The EW of the fluorescent line is 243 eV.
| Model | Parameter | Unit | Value | error |
|---|---|---|---|---|
| phabs | NH | 1021 cm -2 | 3.84 | (-0.04, +0.05) |
| pcfabs | NH | 1022 cm -2 | 8.29 | (-1, +1.2) |
| CvrFract | 0.65 | 0.02 | ||
| mekal | kT | keV | 20.0 | frozen |
| nH | cm-3 | 1.0 | frozen | |
| Abundance | 1.0 | frozen | ||
| norm | 6.2910-3 | (-2.4, +2.6)10-4 | ||
| bbody | kT | keV | 7.6810-2 | (-4.3, +4.2)10-3 |
| norm | 2.1810-4 | (-0.75, +1.2)10-4 | ||
| gaussian | LineE | keV | 6.385 | 0.017 |
| Sigma | eV | 51 | (-32, +27) | |
| norm | 2.610-5 | (-5.4, +3.9) 10-6 | ||
| constant factor | pn | 1.0 | frozen | |
| MOS1 | 1.026 | 0.018 | ||
| MOS2 | 1.028 | 0.018 |
| Source | CvrFract | Reference222References: (1) de Martino et al. (2009); (2) Staude et al. (2008); (3) Evans et al. (2006); (4) de Martino et al. (2006b); (5) Evans & Hellier (2004); (6) Haberl et al. (2002); | |
|---|---|---|---|
| V2069 Cyg | 1 | ||
| MU Cam | 2 | ||
| PQ Gem | 3 | ||
| UU Col | 4 | ||
| V405 Aur | 5 | ||
| NY Lup | 6 |
4 Discussion
We have presented the optical (OPTIMA) and X-ray (Swift-XRT and XMM–Newton EPIC) observations of the IP V2069 Cyg. The timing analysis of the optical and X-ray data reveals pulsations at periods of and respectively, representing the spin period of the WD. We have found that the second harmonic is much stronger than the fundamental in the power spectrum obtained from the optical data. Furthermore, the fundamental frequency from XMM data is weak or even absent at energies 0.5 keV, while it is stronger at 0.5 keV, compared to the second harmonic. IP V405 Aur has shown very similar behaviour in the XMM–Newton data (Evans & Hellier, 2004). The double-peaked pulsations at the spin period are clearly observed in the optical and X-ray data (0.210 keV). The folded light curves show a more prominent double-peaked pulse profile when the power spectrum is dominated by the second harmonic. When the second harmonic is weak the curve possesses a similar profile but with a weaker second peak. Therefore, the power spectrum of the optical data is dominated by the second harmonic, while the X-ray data is the fundamental. The peak separation is around 0.5 for the optical data, and less than 0.5 for the X-ray data.
IP systems (assuming equilibrium rotation) with a short spin period will have relatively small magnetospheres, corresponding to the shorter Keplerian periods in the inner accretion disk. In such short period systems the WD is therefore expected to have a weak magnetic field. The magnetic forces of the WD pick up the material from the accretion disk approximately at the co-rotation radius. The material attaches to the field lines and is channelled onto the WD magnetic poles, where it undergoes a strong shock. After that it is settling on the surface and cooling by the emissions of X-ray bremsstrahlung and optical/infrared cyclotron (Rosen et al., 1988; Norton et al., 2004a). As proposed by Evans & Hellier (2004) most likely the prominent double-peaked modulation in the soft X-ray emission is due to the changing viewing geometry onto the accreting polar caps. We view the heated surface of the WD most favourably when one of the poles points towards us. Nevertheless, due to the highly inclined dipole axis, the external regions of the accretion curtains will not quite cross the line of sight, therefore the hard X-ray emission exhibits a double-peaked pulse profiles with a weaker secondary peak. However, the intensity of the pulse profiles could be also affected by the opacity resulting in electron scattering and absorption in the highly ionized post-shock region, or an offset of the magnetic axis from the WD centre (Allan et al., 1996; Norton et al., 1999; Evans & Hellier, 2004).
The pulse profiles of the optical and X-ray data (each folded with both 742.35 s and 743.38 s spin period and with a same reference time) are out of phase. As an example we show these profiles folded with 743.38 s in Fig. 17. de Martino et al. (2009) also reported that the X-ray pulses (from EPIC-pn) are anti-phased with the optical pulses (in the B-band from optical monitor on the XMM-Newton). X-ray and optical/infrared photons in some IPs originate from two different regions. The optical/infrared photons are thought to originate in the X-ray heated magnetic polar caps, and possibly in the accretion stream (Eracleous et al., 1994; Israel et al., 2003; Revnivtsev et al., 2010). Norton et al. (2004b) suggested that one of the magnetic poles heated by the accretion flow will leave behind a heated trail on the WD surface which will emit optical/infrared photons. During the emission some part of the optical/infrared photons will be absorbed by the flow while the accretion flow is heating the second pole. At that time the rest of the optical/infrared modulations will be seen which is shifted with respect to the X-rays. The phase shift observed between the optical and X-ray pulse profiles in V2069 Cyg is most probably caused by this X-ray heated mechanism.

On the other hand, Norton et al. (1999) suggested that IPs which show a single-peaked pulse profile resulting from stream-fed (or disc-overflow) accretion are an indicator of a WD with a relatively strong magnetic field. These IPs with long WD spin periods (longer than 700 s) might show X-ray beat periods (1/Pbeat=1/Pspin–1/Porb) at some time in their lives (FO Aqr, TX Col, BG CMi, AO Psc, V1223 Sgr and RX J1712.6-2414). Conversely, IPs with short WD spin periods (shorter than 550 s) have shown double-peaked pulse profiles and must therefore have weak magnetic fields. These short period systems did not exhibit X-ray beat periods (AE Aqr, DQ Her, XY Ari, V709 Cas, GK Per, YY Dra and V405 Aur). In the power spectrum of V2069 Cyg we have not found any specific signal at the beat frequency. This absence indicates that in these short period IPs and V2069 Cyg accretion does not occur in a stream-fed or disc-overflow scenario (Norton et al., 1999).
The X-ray spectra of V2069 Cyg can be described by thermal plasma emission (kT of keV) plus a soft bbody component with complex absorption and an additional fluorescent iron-K emission line, which originates on the WD surface (at 6.4 keV, with an EW of 243 eV). V2069 Cyg and V405 Aur show similar bbody parameters with kT of 77 eV and 40 eV (Evans & Hellier, 2004), respectively. Moreover, the two IPs have quite similar spin-orbit period ratios of 0.0276 for V2069 Cyg (743.38 s/26928 s) and 0.036 for V405 Aur (545.5 s/14986 s).
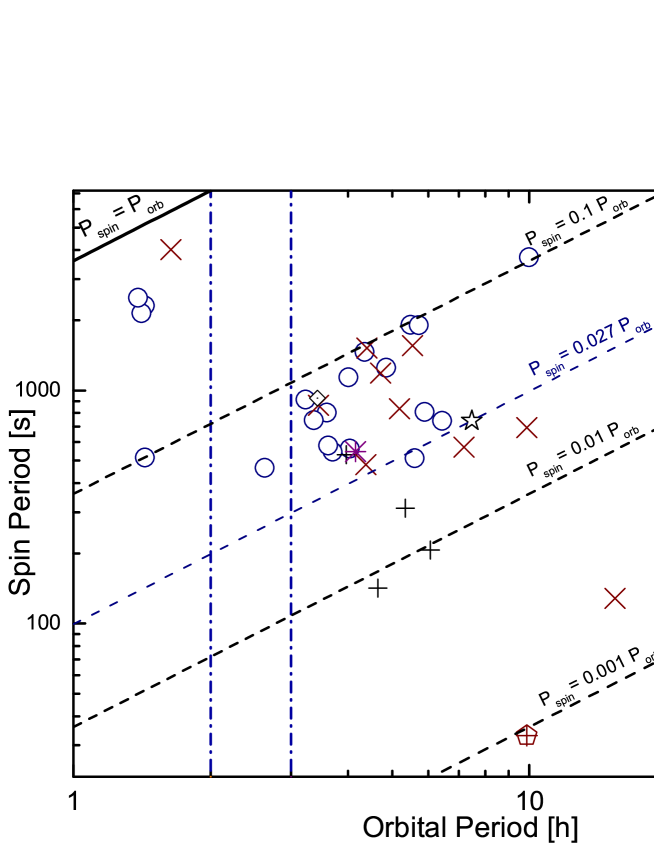
We adopted Mukai’s classification333http://asd.gsfc.nasa.gov/Koji.Mukai/iphome/iphome.html of IPs and updated his Pspin–Porb diagram to include V2069 Cyg (see Fig. 18 and Tab. 4). Several IPs are found close to P = 0.1. There are 28 systems in the range of 0.01 PPorb 0.1 and Porb 3 h, 5 systems with PPorb 0.1 and Porb 2 h, and only one system with PPorb 0.049 that lies in the ‘period gap’. Finally, there are 5 systems with Pspin/Porb 0.01. Those are defined as fast rotating WDs. Only one of them, AE Aqr, shows propeller behaviour. They also show the soft X-ray bbody component in their spectrum (Norton et al., 2004c; Parker et al., 2005; Evans & Hellier, 2007; Norton & Mukai, 2007; Anzolin et al., 2008).
| Name | Porb | Pspin | Pspin / Porb | Properties 444SXR: soft X-ray bbody components; DP: double-peaked pulse profiles. | Period References 555REFERENCES: (1) (Allan et al., 1998); (2) (Anzolin et al., 2008); (3) (Baskill et al., 2005); (4) (Kim et al., 2005); (5) (Butters et al., 2007); (6) (Bonnet-Bidaud et al., 2007); (7) (Bonnet-Bidaud et al., 2009); (8) (Buckley et al., 1995); (9) (Burwitz et al., 1996); (10) (Butters et al., 2008); (11) (Butters et al., 2009a); (12) (Butters et al., 2009b); (13) (Choi et al., 1999); (14) (Crampton et al., 1986); (15) (de Martino et al., 2008); (16) (de Martino et al., 1999); (17) (de Martino et al., 2006a);(18) (de Martino et al., 2009); (19) (Duck et al., 1994); (20) (Evans & Hellier, 2004); (21) (Evans & Hellier, 2007); (22) (Gänsicke et al., 2005); (23) (Harlaftis & Horne, 1999); (24) (Haswell et al., 1997); (25) (Hilton et al., 2009); (26) (Hellier, 2007); (27) (Hellier et al., 1994); (28) (Hellier et al., 1997); (29) (Hellier et al., 2002a); (30) (Hellier et al., 2002b); (31) (Kemp et al., 2002); (32) (Mauche, 2004); (33) (Norton et al., 1999); (34) (Norton et al., 2002); (35) (Patterson et al., 2004); (36) (Pretorius, 2009); (37) (Hellier, Beardmore, & Buckley, 1998); (38) (Staude et al., 2003); (39) (Schlegel, 2005); (40) (Scaringi et al., 2011); (41) (Scaringi et al., 2010); (42) (Thorstensen, Peters,& Skinner, 2010); (43) (de Martino et al., 2006b); (44) (Patterson et al., 2011); (45) (Zhang et al., 1995); |
|---|---|---|---|---|---|
| (h) | (s) | ||||
| 0.01 Pspin / Porb 0.1 | and Porb 3 h | ||||
| V709 Cas | 5.341 | 312.780 | 0.01627 | DP | 33,41 |
| NY Lup | 9.870 | 693.010 | 0.01950 | SXR | 2, 21, 17, 41 |
| RXS J213344.1+510725 | 7.193 | 570.800 | 0.02204 | SXR | 2, 11, 42 |
| Swift J0732.5-1331 | 5.604 | 512.420 | 0.02540 | - | 5, 41 |
| V2069 Cyg | 7.480 | 743.384 | 0.02756 | SXR, DP | 18, 41 |
| RXS J070407.9-262501 | 4.380 | 480.670 | 0.03205 | SXR | 2, 22,44 |
| El Uma | 6.430 | 741.660 | 0.03204 | - | 3 |
| V405 Aur | 4.160 | 545.456 | 0.03642 | SXR, DP | 2, 20, 23, 41 |
| YY Dra | 3.969 | 529.310 | 0.03705 | DP | 24, 33 |
| IGR J15094-6649 | 5.890 | 809.700 | 0.03819 | - | 12, 41 |
| IGR J00234+6141 | 4.033 | 563.500 | 0.03881 | - | 6 |
| RXS J165443.5-191620 | 3.700 | 546.000 | 0.04099 | - | 40 |
| IGR J16500-3307 | 3.617 | 579.920 | 0.04454 | - | 36, 41 |
| PQ Gem | 5.190 | 833.400 | 0.04461 | SXR | 2, 19, 21, 27, 41 |
| V1223 Sgr | 3.366 | 745.630 | 0.06153 | - | 11, 41 |
| AO Psc | 3.591 | 805.200 | 0.06229 | - | 11, 41 |
| UU Col | 3.450 | 863.500 | 0.06952 | SXR | 2, 9, 21, 43 |
| MU Cam | 4.719 | 1187.250 | 0.06989 | SXR | 2,38, 41 |
| FO Aqr | 4.850 | 1254.400 | 0.07184 | - | 11, 16, 41 |
| V2400 Oph | 3.430 | 927.660 | 0.07513 | SXR, Diskless | 2, 8, 21, 26 |
| WX Pyx | 5.540 | 1557.300 | 0.07808 | SXR | 2, 21,39 |
| BG Cmi | 3.230 | 913.000 | 0.07852 | - | 4, 41 |
| IGR J17195-4100 | 4.005 | 1139.500 | 0.07902 | - | 36, 41 |
| TX Col | 5.718 | 1910.000 | 0.09284 | - | 41 |
| V2306 Cyg | 4.350 | 1466.600 | 0.09365 | - | 11, 34 |
| RXS J180340.0-401214 | 4.402 | 1520.510 | 0.09595 | SXR | 2, 22 |
| TV Col | 5.486 | 1911.000 | 0.09676 | - | 41 |
| V1062 Tau | 9.982 | 3726.000 | 0.10368 | - | 30, 42 |
| Pspin / Porb 0.1 | and Porb 2 h | ||||
| HT Cam | 1.433 | 515.0592 | 0.09984 | - | 31 |
| V1025 Cen | 1.410 | 2147.000 | 0.42297 | - | 29, 37 |
| DW Cnc | 1.435 | 2314.660 | 0.44806 | - | 35 |
| SDSS J233325.92+152222.1 | 1.385 | 2500.000 | 0.50127 | - | 25 |
| EX Hya | 1.637 | 4021.000 | 0.68231 | SXR | 1,2 21, 41 |
| Period Gap | (2 h Porb 3 h) | ||||
| XSS J00564+4548 | 2.624 | 465.680 | 0.04929 | - | 7, 10 |
| Fast rotator | (Pspin / Porb 0.01) | ||||
| AE Aqr | 9.880 | 33.076 | 0.00093 | DP, Propeller | 11, 13, 26, 33, 41 |
| GK Per | 47.923 | 351.332 | 0.00204 | SXR, DP | 14, 21, 32, 33 |
| IGR J17303-0601 | 15.420 | 128.000 | 0.00231 | SXR | 2, 11 |
| DQ Her | 4.650 | 142.000 | 0.00848 | DP | 11, 33, 45 |
| XY Ari | 6.065 | 206.300 | 0.00945 | DP | 28, 33, 41 |
5 Conclusions
We conclude that V2069 Cyg is an example of an IP that shows double-peaked emission profiles at the WD spin period which are probably caused by a weak magnetic field, in a WD with short spin period. The X-ray spectrum shows a soft bbody component and thermal plasma emission and its X-ray and optical emission have a double-peaked modulation. We performed simultaneous optical/X-ray observations of V2069 Cyg to search for any delays between these two energy bands. However the low count rates in the Swift data did not allow to constrain these delays.
Acknowledgements
Ilham Nasiroglu acknowledges support from the EU FP6 Transfer of Knowledge Project ”Astrophysics of Neutron Stars” (MKTD-CT-2006-042722). Aga Słowikowska acknowledges support from the grant N203 387737 of the Polish Ministry of Science and Higher Education, as well as the grant FNP HOM/2009/11B and the EU grant PERG05-GA-2009-249168. Gottfried Kanbach acknowledges support from the EU FP6 Transfer of Knowledge Project ASTROCENTER (MTKD-CT-2006-039965) and the kind hospitality of the Skinakas team at UoC. We acknowledge the use of public data from the Swift data archive. We would like to thank Aysun Akyuz and Arne Rau for discussions on this paper, as well as Anna Zajczyk (CAMK) and Andrzej Szary (UZG) for their help with observations. We thank the Skinakas Observatory for their support and allocation of telescope time. Skinakas Observatory is a collaborative project of the University of Crete, the Foundation for Research and Technology - Hellas, and the Max-Planck-Institute for Extraterrestrial Physics.
References
- Allan et al. (1996) Allan A., Horne K., Hellier C., Mukai K., Barwig H., Bennie P. J., Hilditch R. W., 1996, MNRAS, 279, 1345
- Allan et al. (1998) Allan A., Hellier C., Beardmore A., 1998, MNRAS, 295, 167
- Anzolin et al. (2008) Anzolin G., de Martino D., Bonnet-Bidaud J.-M., et al., 2008, A&A, 489, 1243
- Arnaud (1996) Arnaud K. A. 1996, ASPC, 101, 17
- Baskill et al. (2005) Baskill D. S., Wheatley P. J., Osborne J. P., 2005, MNRAS, 357, 626
- Burrows et al. (2005) Burrows D. N., Hill J. E., Nousek J. A., et al. 2005a, Space Sci. Rev.,120, 165
- Bonnet-Bidaud et al. (2007) Bonnet-Bidaud J. M., de Martino D., Falanga M., Mouchet M., Masetti N., 2007, A&A, 473, 185
- Bonnet-Bidaud et al. (2009) Bonnet-Bidaud J. M., de Martino D., Mouchet M., 2009, ATel, 1895, 1
- Buckley et al. (1995) Buckley D. A. H., Sekiguchi K., Motch C., et al., 1995, MNRAS, 275, 1028
- Burwitz et al. (1996) Burwitz V., Reinsch K., Beuermann K., Thomas H.-C., 1996, A&A, 310, L25
- Butters et al. (2007) Butters O. W., Barlow E. J., Norton A. J., Mukai K., 2007, A&A, 475, L29
- Butters et al. (2008) Butters O. W., Norton A. J., Hakala P., Mukai K., Barlow E. J., 2008, A&A, 487, 271
- Butters et al. (2009a) Butters O. W., Katajainen S., Norton A. J., Lehto H. J., Piirola V., 2009a, A&A, 496, 891
- Butters et al. (2009b) Butters O. W., Norton A. J., Mukai K., Barlow E. J., 2009b, A&A, 498, L17
- Butters et al. (2011) Butters O. W., Norton A. J., Mukai K., Tomsick J. A., 2011, A&A, 526, A77
- Choi et al. (1999) Choi C.-S., Dotani T., Agrawal P. C., 1999, ApJ, 525, 399
- Crampton et al. (1986) Crampton D., Fisher W. A., Cowley A. P., 1986, ApJ, 300, 788
- Cropper (1990) Cropper M., 1990, SSRv, 54, 195
- de Martino et al. (1999) de Martino D., Silvotti R., Buckley D. A. H., Gänsicke B. T., Mouchet M., Mukai K., Rosen S. R., 1999, A&A, 350, 517
- de Martino et al. (2001) de Martino D., Matt G., Mukai K., et al. 2001, A&A, 377, 499
- de Martino et al. (2006a) de Martino D., Bonnet-Bidaud J.-M., Mouchet M., et al., 2006a, A&A, 449, 1151
- de Martino et al. (2006b) de Martino D., Matt G., Mukai K., et al., 2006a, A&A, 454, 287
- de Martino et al. (2008) de Martino D., Matt G., Mukai K., et al., 2008, A&A, 481, 149
- de Martino et al. (2009) de Martino D., Bonnet-Bidaud J. M., Falanga M., Mouchet M., Motch C., 2009, ATel, 2089, 1
- Duck et al. (1994) Duck S. R., Rosen S. R., Ponman T. J., Norton A. J., Watson M. G., Mason K. O., 1994, MNRAS, 271, 372
- Dickey & Lockman (1990) Dickey J. M., Lockman F. J., 1990, ARA&A, 28, 215
- Eracleous et al. (1994) Eracleous M., Horne K., Robinson E. L., Zhang E.-H., Marsh T. R., Wood J. H., 1994, ApJ, 433, 313
- Evans & Hellier (2004) Evans P. A., Hellier C., 2004, MNRAS, 353, 447
- Evans et al. (2006) Evans P. A., Hellier C., Ramsay G., 2006, MNRAS, 369, 1229
- Evans & Hellier (2007) Evans P. A., Hellier C., 2007, ApJ, 663, 1277
- Gänsicke et al. (2005) Gänsicke B. T., et al., 2005, MNRAS, 361, 141
- Gregory & Loredo (1996) Gregory P. C., Loredo T. J., 1996, ApJ, 473, 1059
- Haberl et al. (2002) Haberl F., Motch C., Zickgraf F.-J., 2002, A&A, 387, 201
- Harlaftis & Horne (1999) Harlaftis E. T., Horne K., 1999, MNRAS, 305, 437
- Haswell et al. (1997) Haswell C. A., Patterson J., Thorstensen J. R., Hellier C., Skillman D. R., 1997, ApJ, 476, 847
- Hellier et al. (1994) Hellier C., Ramseyer T. F., Jablonski F. J., 1994, MNRAS, 271, L25
- Hellier et al. (1997) Hellier C., Mukai K., Beardmore A. P., 1997, MNRAS, 292, 397
- Hellier, Beardmore, & Buckley (1998) Hellier C., Beardmore A. P., Buckley D. A. H., 1998, MNRAS, 299, 851
- Hellier (2001) Hellier C., 2001, Cataclysmic Variable Stars, Springer-Praxis, Chichester, UK
- Hellier (2007) Hellier C., 2007, IAU Symp. 243, Star–Disk Interaction in Young Stars, p. 325, Keele University, UK
- Hellier et al. (2002a) Hellier C., Wynn G. A., Buckley D. A. H., 2002a, MNRAS, 333, 84
- Hellier et al. (2002b) Hellier C., Beardmore A. P., Mukai K., 2002b, A&A, 389, 904
- Hilton et al. (2009) Hilton E. J., Szkody P., Mukadam A., Henden A., Dillon W., Schmidt G. D., 2009, AJ, 137, 3606
- Israel et al. (2003) Israel G. L., et al., 2003, ApJ, 598, 492
- Kanbach et al. (2003) Kanbach G., Kellner S., Schrey F. Z., Steinle H., Straubmeier C., Spruit H. C., 2003, SPIE, 4841, 82
- Kemp et al. (2002) Kemp J., Patterson J., Thorstensen J. R., Fried R. E., Skillman D. R., Billings G., 2002, PASP, 114, 623
- Kim et al. (2005) Kim Y. G., Andronov I. L., Park S. S., Jeon Y.-B., 2005, A&A, 441, 663
- Mauche (2004) Mauche C. W., 2004, in Vrielmann S., Cropper M., eds, ASP Conf. Ser. Vol. 315, Magnetic Cataclysmic Variables. Astron. Soc. Pac., San Francisco, p. 120
- (49) Mewe R., Gronenschild E. H. B. M., van den Oord G. H. J., 1985, A&AS, 62, 197
- Motch et al. (1996) Motch C., Haberl F., Guillout P., Pakull M., Reinsch K., Krautter J., 1996, A&A, 307, 459
- Norton et al. (1999) Norton A. J., Beardmore A. P., Allan A., Hellier C., 1999, A&A, 347, 203
- Norton et al. (2002) Norton A. J., Quaintrell H., Katajainen S., Lehto H. J., Mukai K., Negueruela I., 2002, A&A, 384, 195
- Norton et al. (2004a) Norton A. J., Somerscales R. V., Parker T. L., Wynn G. A., West R. G., 2004a, RMxAC, 20, 138
- Norton et al. (2004b) Norton A. J., Haswell C. A., Wynn G. A., 2004b, A&A, 419, 1025
- Norton et al. (2004c) A. J., Somerscales R. V., Wynn G. A., 2004c, in Vrielmann S., Cropper M., eds, ASP Conf. Ser. Vol. 315, Magnetic Cataclysmic Variables. Astron. Soc. Pac., San Francisco, p. 216
- Norton & Mukai (2007) Norton A. J., Mukai K., 2007, A&A, 472, 225
- Parker et al. (2005) Parker T. L., Norton A. J., Mukai K., 2005, A&A, 439, 213
- Patterson (1994) Patterson J., 1994, PASP, 106, 209
- Patterson et al. (2004) Patterson J., et al., 2004, PASP, 116, 516
- Patterson et al. (2011) Patterson J., et al., 2011, PASP, 123, 130
- Pretorius (2009) Pretorius M. L., 2009, MNRAS, 395, 386
- Revnivtsev et al. (2010) Revnivtsev M., et al., 2010, A&A, 513, A63
- Rosen et al. (1988) Rosen S. R., Mason K. O., Cordova F. A., 1988, MNRAS, 231, 549
- Scaringi et al. (2010) Scaringi S., et al., 2010, MNRAS, 401, 2207
- Scaringi et al. (2011) Scaringi S., et al., 2011, A&A, 530, A6
- Schlegel (2005) Schlegel E. M., 2005, A&A, 433, 635
- Staude et al. (2003) Staude A., Schwope A. D., Krumpe M., Hambaryan V., Schwarz R., 2003, A&A, 406, 253
- Staude et al. (2008) Staude A., Schwope A. D., Schwarz R., Vogel J., Krumpe M., Nebot Gomez-Moran A., 2008, A&A, 486, 899
- Strüder etal. (2001) Strüder L., et al., 2001, A&A, 365, L18
- Thorstensen & Taylor (2001) Thorstensen J. R., Taylor C. J., 2001, MNRAS, 326, 1235
- Thorstensen, Peters,& Skinner (2010) Thorstensen J. R., Peters C. S., Skinner J. N., 2010, PASP, 122, 1285
- Turner et al. (2001) Turner M. J. L., et al., 2001, A&A, 365, L27
- Warner (1995) Warner B., 1995, Cataclysmic Variable Stars, Cambridge Univ. Press, Cambridge, UK
- Zhang et al. (1995) Zhang E., Robinson E. L., Stiening R. F., Horne K., 1995, ApJ, 454, 447