Catalytic Growth of N-doped MgO on Mo(001)
Abstract
A simple pathway to grow thin films of N-doped MgO (MgO:N), which has been found experimentally to be a ferromagnetic d0 insulator, is presented. It relies on the catalytic properties of a Mo(001) substrate using growth of Mg in a mixed atmosphere of O2 and N2. Scanning tunneling spectroscopy reveals that the films are insulating and exhibit an N-induced state slightly below the conduction band minimum.
Recently, it has been found that MgO:N-films grown by molecular beam epitaxy (MBE)
exhibit ferromagnetism after being
annealed at 1020 K.Yang The optimized N-concentration was 2.2 % exhibiting coercive fields as large as 60 mT at K and magnetic moments per N-atom
of 0.3 barely reducing up to room temperature. A Curie temperature
K has been extrapolated and indications that N is incorporated substitutionally on the O-site
have been deduced from core level spectroscopy. Moreover, independent studies of N implantation (80 keV) into MgO led to a hysteresis
with a coercive field of 30 mT at 300 K.Ming
This raises hope that reliable d0 ferromagnetism avoiding d-metals can be realized in MgO:N at K.
Such magnetism without d-orbitals has previously been found in thin films of undoped oxides HfO2 including MgO MgO or defective carbon systems Esqui , however, with limited control since relying on defects. ZnO with sp-type dopants as C, N, B, Li, Na, Mg, Al, and Ga shows ferromagnetic signals, too,Pan ; Yu but, likely, Zn or O vacancies and Zn d-orbitals are involved in the magnetic coupling Pan ; Li .
The d0 ferromagnetism
has first been proposed theoretically relying on the double exchange mechanism in narrow impurity bands.Kenmochi But the high proposed originally has been challenged by going beyond the mean-field approximation Mavropoulos
or by considering correlation effects,Droghetti ; Slipukhina ; Gu . Partly, even the absence of ferromagnetism was found.Droghetti This renders the high observed experimentally into obvious disagreement to current theory asking for more detailed studies .
MgO:N films, in addition, exhibit bipolar resistive switching behaviour Waser prior to annealing. Resistance contrasts as large as 4 orders of magnitude, switching currents as low as 100 nA and switching times into both states below 10 ns have been obtained.Yang This makes MgO:N also interesting for nonvolatile memories.
However, the incorporation of N into MgO is difficult due to the strongly endothermal incorporation of N atoms with respect to N2 (energy cost per N atom: 10 eV) Pesci . It requires, e.g., atomic beams of N and O produced by a high-frequency ion plasma
sourceYang or N+ implantation Ming . Here, we demonstrate a simplified pathway using the catalytic abilities of a Mo(001)
substrate. Thus, we establish a model system of MgO:N for surface science. Mo(001) is chosen since thin MgO films of high quality can be grown epitaxially due to the relatively small lattice mismatch of 6 %.Gallagher ; Benedetti ; Grob Moreover, catalytic properties of Mo with respect to N2 are known, as, e.g., for the nitrogenase within bacteria using molybdenum enzymes as catalyst.Chatt Catalytic N2
dissociation on surfaces has been induced successfully for the electronically similar W(001), where growth properties of MgO are, however, unknown.Alducin ; Clavenna ; Rettner
We have grown thin films of MgO:N on Mo(001) with thicknesses up to ten monolayer (ML) at optimal doping. Scanning tunneling spectroscopy (STS) revealed that the Fermi level is well within the band gap indicating insulating behaviour of the film. Moreover, an unoccupied state close to the conduction band is found, which is not present in pure MgO films.
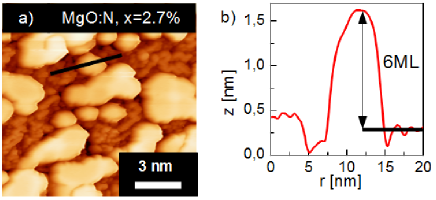
The experiments are performed in ultra-high vacuum at a base pressure of mbar. Firstly, the Mo(100) crystal was cleaned by cyclically annealing within O2 at initial pressure mbar and 1400 K, followed by flashing to 2300 K. Bode After every cycle, is slightly reduced. The MgO:N films are prepared by molecular beam epitaxy of magnesium at mbar and N2 pressure mbar. The deposition temperature is 300 K, if not given explicitly. The deposition rate of Mg controlled by a quartz micro-balance was ML/min. After MgO:N deposition, the samples are annealed at 1100 K for 10 min. Figure 1(a) shows a scanning tunneling microscopy (STM) image of 7 ML MgO0.973N0.027. It exhibits islands on top of an MgO:N wetting layer. From comparison of the coverage determined by the quartz balance and the volume of the MgO:N islands, we estimate the wetting layer thickness to 1-2 ML. We checked crystalline quality and chemical purity of Mo(100) and the MgO:N films by low energy electron diffraction (LEED) and Auger electron spectroscopy (AES). The nitrogen concentration within the MgO films was determined by AES at primary electron energy of 1 keV being sensitive to the upper 2 nm (9 to 10 ML) only Akkerman . The atomic concentration of element within homogeneous films is calculated from the AES peak height shown in Fig. 2(a) according to:Auger
| (1) |
where denotes the normalized sensitivity factor and sums over all relevant elements.
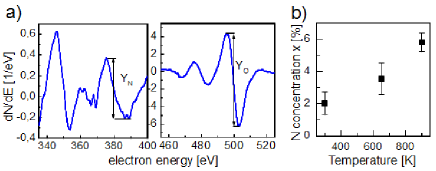
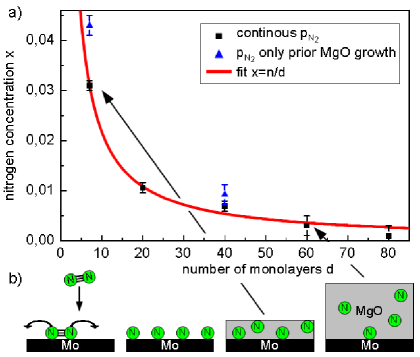
The N concentration depends on deposition temperature as shown in Fig.2(b) for a 7 ML MgO:N film. Up to % is achieved at K indicating a more effective dissociation of N2 at higher . Notice that % at 7 ML is still far below the amount of N expected from a full N coverage of Mo(001). Next, we prepared MgO:N films with a thickness of up to 100 ML at K. The nitrogen amount within the MgO:N decreased dramatically with film thickness as shown in Fig. 3. A 60 ML thick MgO:N film contained only 0.3 % nitrogen in comparison to 3.2 % at a thickness of 7 ML. Assuming homogeneous distribution of N, this implies that the amount of N in both films is roughly the same evidencing that N2 is dissociated on the Mo(100) surface only. We assume that during MgO growth or annealing, the atomic N from the surface is incorporated into the MgO film. To support this scenario, we fit the data assuming a constant areal concentration of of N atoms:
| (2) |
where denotes the number of MgO ML and represents the concentration of N atoms with respect to the sum of N and O atoms. If we assume that all N atoms are substitutionally incorporated into the first monolayer of MgO:N, the fit curve plotted in figure 3(a) shows excellent agreement with the measured data points using . Assuming interstitial impurities, i.e. dumbbells of NOPesci , equation (2) has to be slightly modified and results in .
Nearly the same can be achieved by another preparation method: Prior to the deposition of Mg in a pure O2 environment, we exposed the Mo crystal to N2 ( mbar) at 300 K for min. Afterwards, we grow MgO without N2 at K leading to very similar N concentrations as shown in Fig. 3(a). Thus, obviously, the dissociation of
N2 takes place at the Mo(001) only.
Finally, a third preparation has been performed: 10 ML of pristine MgO were grown first at mbar. Subsequently, 10 ML MgO:N are deposited at K and mbar. No nitrogen was found in the sample, i.e. %. Thus, if Mo is covered by MgO, the catalytic effect of the substrate is inhibited.
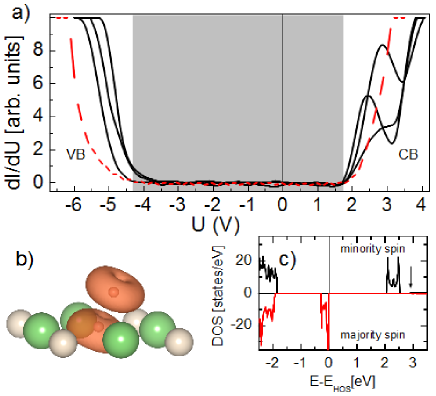
Figure 4 compares STS curves of 11 ML films of MgO0.96N0.04 and undoped MgO.Grob Doping by N leads to a shift of the Fermi level towards the valence band by about 1 eV and an additional peak with maximum at eV below the conduction band minimum (CBM). This is observed for three different N concentrations, i.e. MgO thicknesses, as probed by STS. The peak energy varies laterally by eV. Density functional (DFT) calculations of bulk MgO with substitutional N predict occupied p-levels close to the valence band maximum (VBM) and an unoccupied, spin polarized level within the middle of the band gap, if self interaction correction is included.Droghetti ; Slipukhina
This disagrees with our experiment.
Since surfaces are not included in these calculations, we performed first-principles DFT calculations including the surface
within the spin-polarized generalized gradient
approximation PBE1996 using projector
augmented-wave potentials as implemented in the Vienna Ab initio Simulation Package (VASP). Kresse
Correlation effects on
the p-shells of N dopants are accounted for by the DFT+U scheme
in Dudarev’s approach Dudarev with an on-site effective Coulomb parameter
Ueff=3.4 eV. A kinetic energy cutoff of 500 eV and a -centered -point mesh
was used. The supercell consists of 9 atomic layers MgO(001) using the experimental lattice parameter and a 16 Å thick layer
of vacuum. All atomic positions as well as the thickness of the MgO slab were fully relaxed.
Three different configurations with N atoms in the surface layer have been calculated: () one N-atom substituting an oxygen, () one N-atom at the interstitial site and () an N-N dimer with one N atom being substitutional and the other at the nearest interstitial site. In case (), the calculation was initiated with an N interstitial, but the system relaxed to a configuration where N and O exchanged their places, i.e. N ended up substitutionally and O interstitially.
However, the N derived p-states for case () and () are found within 2.2 eV above VBM very similar as for MgO bulk.Droghetti ; Slipukhina We conclude that a more complex N structure as, e.g., the N-N dimer at the surface shown in Fig. 4(b) and exhibiting unoccupied N-type p-states close to CBM (Fig. 4(c)), is responsible for the observed peak.
In conclusion, we prepared thin films of N-doped MgO with an N-concentration up to by using the catalytic effect of Mo(001) for N2 dissociation.
Compared with pristine MgO, an additional state close to the conduction band minimum has been observed by STS which could not be attributed to simple N impurity
configurations.
Helpful discussions with P. Mavropoulos and S. Parkin as well as financial support by SFB 917-A3 and HGF_YIG VH-NG-409 are gratefully acknowledged.
References
- (1) C. H. Yang, Ph. D. thesis, Stanford university, Stanford 2010.
- (2) L. Chun-Ming et al., Chin. Phys. B 20, 047505 (2011).
- (3) M. Ventakesan, C. B. Fitzgerald, and J. M. D. Coey, Nature 430, 630 (2004); J. M. D. Coey et al., Phys. Rev. B 72, 024450 (2005); M. Khalid et al., Phys. Rev. B 80, 035331 (2009); N. H. Hong et al., Phys. Rev. B 73, 132404 (2006), D. Gao et al., J. Phys. Chem C 114, 11703 (2010).
- (4) C. Moyses Araujo et al., Appl. Phys. Lett. 96, 232505 (2010); C. Martinez-Boubeta et al., Phys. Rev. B 82, 024405 (2010).
- (5) P. Esquinazi et al., Phys. Rev. Lett. 91, 227201 (2003); S. Talapatra et al., Phys. Rev. Lett. 95, 097201 (2005).
- (6) H. Pan et al., Phys. Rev. Lett. 99, 127201 (2007).
- (7) C. F. Yu et al., J. Phys. D: Appl. Phys 40, 6497 (2007); S. Chawla et al., Phys. Rev. B 79, 125204 (2009); J. Appl. Phys. 106, 113923 (2009) Y. Ma et al., IEEE Trans. Magn. 46, 1338 (2010).
- (8) X. L. Li et al., IEEE Trans. Magn. 46, 1382 (2010); X. G. Xu et al., Appl. Phys. Lett. 97, 232502 (2010); J. B. Yi et al., Phys. Rev. Lett. 104, 137201 (2010); D. Gao et al., J. Phys. Chem 14, 13477 (2010); V. Bhosle and J. Narayan, Appl. Phys. Lett. 93, 02192 (2008).
- (9) L.S. Efimov, S.Yunoki, and G. A. Sawatzky, Phys. Rev. Lett. 89, 216403 (2002); K. Kenmochi et al., Jpn. J. Appl. Phys 43, L 934 (2004); K. Kenmochi et al., J. Phys. Soc. Jp. 73, 2952 (2004); V. A. Dinh et al., J. Phys. Soc. Jpn. 75, 093705 (2006); I. S. Efimov et al., Phys. Rev. Lett. 98, 137202 (2007).
- (10) P. Mavropoulos, M. Ležaić, and S. Blügel, Phys. Rev. B 80, 184403 (2009).
- (11) A. Droghetti, C.D. Pemmaraju, and S. Sanvito, Phys. Rev. B 78, 140404 (2008); V. Pardo and W. E. Picket, Phys. Rev. Lett. 78, 134427 (2008); H. Wu, A. Stroppa, S. Sakong, S. Picozzi, M. Scheffler, P. Kratzer, Phys. Rev. Lett. 105, 267203 (2010).
- (12) I. Slipukhina et al., Phys. Rev. Lett. 107, 137203 (2011).
- (13) B. Gu et al., Phys. Rev. B 79, 024407 (2009).
- (14) R. Waser et al., Adv. Mat. 21, 2632 (2009).
- (15) M. Pesci et al., J. Phys. Chem. C 1141, 1350 (2010).
- (16) M.C. Gallagher et al., Thin Solid Films 445, 90 (2003).
- (17) S. Benedetti et al., Chem. Phys. Lett. 430, 330 (2006).
- (18) C. Pauly et al., Phys. Rev. B 81,125446 (2010).
- (19) J. Chatt et al., Nature 224, 1201 (1969).
- (20) M. Alducin et al., Phys. Rev. Lett. 97, 056102 (2006).
- (21) L.R. Clavenna and L.D. Schmidt, Surf. Sci. 22, 365 (1970).
- (22) C.T. Rettner, E.K. Schweizer, and H. Stein, J. Chem. Phys. 93, 1442 (1990).
- (23) M. Bode et al., Surf. Sci. 601, 3308 (2007).
- (24) A. Akkerman et al., phys. stat. sol. (b) 198, 769 (1996).
- (25) S. Mroczkowski and D. Lichtmann, J. Vac. Sci. Technol. A 3, 1860 (1985).
- (26) J. P. Perdew et al., Phys. Rev. Lett. 77, 3865 (1996).
- (27) G. Kresse et al., Phys. Rev. B 47, 558 (1993); 54, 11169 (1996); 59, 1758 (1999); P. E. Blöchel, Phys. Rev. B 50, 17953 (1994).
- (28) S. L. Dudarev et al., Phys. Rev. B 57, 1505 (1998).