Five New Millisecond Pulsars From a Radio Survey of 14 Unidentified Fermi-LAT Gamma-ray Sources
Abstract
We have discovered five millisecond pulsars (MSPs) in a survey of 14 unidentified Fermi-LAT sources in the southern sky using the Parkes radio telescope. PSRs J0101–6422, J1514–4946, and J1902–5105 reside in binaries, while PSRs J1658–5324 and J1747–4036 are isolated. Using an ephemeris derived from timing observations of PSR J0101–6422 (=2.57 ms, DM=12 pc cm-3), we have detected -ray pulsations and measured its proper motion. Its -ray spectrum (a power law of with a cutoff at 1.6 GeV) and efficiency are typical of other MSPs, but its radio and -ray light curves challenge simple geometric models of emission. The high success rate of this survey—enabled by selecting -ray sources based on their detailed spectral characteristics—and other similarly successful searches indicate that a substantial fraction of the local population of MSPs may soon be known.
Subject headings:
gamma rays: general — pulsars: individual (PSR J0101–6422)1. Introduction
The Large Area Telescope (LAT, Atwood et al., 2009) of the Fermi Gamma-ray Space Telescope is a pulsar detector par excellence. Supported by a radio campaign (Smith et al., 2008) providing ephemerides for coherent folding of LAT photons, the LAT has identified -ray pulsations from many normal (unrecycled) pulsars (e.g. Abdo et al., 2010c) and millisecond pulsars (MSPs, Abdo et al., 2009a). Additionally, tens of new pulsars have been discovered in “blind” searches for periodicity in the LAT data (e.g. Abdo et al., 2009b; Pletsch et al., 2012).
A third, indirect method of detection has been extremely successful in discovering new pulsars, especially MSPs111See https://confluence.slac.stanford.edu/display/GLAMCOG/Public+List+of+LAT-Detected+Gamma-Ray+Pulsars for an up-to-date list of LAT-detected pulsars. Gamma-ray pulsars—both young and recycled—are stable emitters and nearly all have a characteristic spectrum with and (Abdo et al., 2010c), making unidentified, nonvariable LAT sources with such spectra good pulsar candidates. The fine angular resolution and large effective area of the LAT allow a typical source localization of 10′, about the beam size of class radio telescopes. This happy coincidence enables deep pulsation searches with a single pointing. Discovery of a pulsar and a subsequent timing campaign can “close the loop” by providing an ephemeris with which to fold LAT photons and resolve -ray pulsations. Indeed, since most MSPs reside in binaries, initial detection and characterization of the orbit at longer wavelengths is the only way -ray pulsations can be detected from these pulsars.
Due to sensitivity limitations, LAT-guided surveys naturally target the nearly-isotropic population of nearby MSPs. The deep radio exposures afforded by the efficient target selection offer the tantalizing possibility of completely cataloguing the local field MSPs whose radio and -ray beams cross the Earth. This relatively complete sample will be valuable in constraining the emission mechanisms of MSPs and in characterizing the evolution of their binary progenitors.
Towards this end, we performed a small, targeted survey at the CSIRO Parkes telescope, complementary to a Parkes search described in Keith et al. (2011) that had different source selection criteria.
2. Target Selection
We began with the set of southern (Decl. ; northern sources are visible to the more sensitive Green Bank Telescope), nonvariable sources in a preliminary version of the 1FGL catalog of -ray sources (Abdo et al., 2010b). We further restricted consideration to sources whose LAT position estimates had a 95% confidence error radius 7′, the HWHM of the 1.4 GHz beam of the Parkes telescope, and which had no plausible blazar counterpart. We classified the remaining sources by visual inspection of the -ray spectrum. Sources with spectral shapes resembling known pulsars (see above) were selected for observation, while those sources best described by power laws or with significant spectral breaks but were deemed likely to be blazars and were not selected. Due to the difficulty of spectral modeling and localization of LAT sources in the Galactic plane, we discarded sources with . Our final list comprised 14 good candidates. The source positions (see Table 1) were computed from the same analysis used to estimate the spectral shape, but in all cases the difference in position with 1FGL is well within both the 1FGL 95% error contour and the Parkes beam.
3. Radio Searches
We observed the 14 selected sources (§2) at the Parkes 64-m radio telescope between 2009 November 25 and December 8. Each source was observed for between 1 and 2 hours (see Table 1) using the center beam of the multibeam receiver. We recorded 1-bit-digitized total-power samples every 125 s from each of 512 frequency channels spanning 256 MHz of band centered on 1390 MHz, writing the data to disk for off-line analysis (see Manchester et al. (2001) for more details on the receiver and data-acquisition system.)
The data were analyzed on the koala computer cluster at Columbia University using standard pulsar search techniques implemented in the PRESTO package (Ransom, 2001). We dedispersed each data set ideally up to a dispersion measure of pc cm-3, and when searching for periodic signals we allowed for accelerated signals caused by pulsar motion in a binary system. This was parameterized within PRESTO by the parameter , which is related to the maximum number of bins a signal can drift within the Fourier spectrum and still be properly detected by the search method. All of the data were analyzed in this manner within about a week of collection, and on 2009 December 4 we found our first MSP. Within a few more days we confirmed it and four other new MSPs. A 6th MSP was detected unbiasedly in our sample, but it had been previously discovered by Keith et al. (2011, see Table 1).
In a few cases, the pulsars were not confirmed on the first attempt and required subsequent observations, owing to their faintness and scintillation in the interstellar medium. We reanalyzed the data by increasing the acceleration search space to and by analyzing only the first 30 minutes of each data file. The latter approach improves our sensitivity to highly accelerated pulsars (e.g., for an MSP in a 1-day binary, a 2-hour observation cannot be corrected ideally under the assumption of a constant acceleration, no matter how large the zmax used), but no new pulsars were detected.
The nominal sensitivity of our searches, for a 2 hr observation and assuming a pulsar duty cycle of 20%, is 0.11 mJy for 2 ms and pc cm-3, degrading gradually for shorter periods and larger DMs. While in detail this depends on the sky background temperature, the contribution from the Galaxy at our observing frequency only differs by a maximum of 3 K for different locations, out of a total system equivalent temperature of nearly 30 K, so that we provide an average flux density limit. Two of the non-detections have limits of 0.12 mJy and 0.14 mJy owing to shorter integration times (see Table 1). Because of scintillation, a pulsar with a larger average flux than our nominal limits might not be detectable in a particular observation, and vice versa. In any case, the nominal flux density represents the most sensitive searches for MSPs done at Parkes, especially considering that these LAT-selected targets are largely expected to be relatively nearby.
Characterization of four of the MSPs requires a longer radio timing campaign and/or LAT dataset than available for this work. We defer discussion of these MSPs (and of scintillation effects on sensitivity, which likewise requires repeated observations) to Camilo et al. (in preparation). The remaining pulsar presents a peculiar light curve and we describe it further below.
| 1FGL Name | R.A.aaParkes telescope pointing position. | Decl.aaParkes telescope pointing position. | l | b | Obs. Time | Period | DM | DistancebbDistances computed from measured DM using the NE2001 model (Cordes & Lazio, 2002). | Binary | ||
|---|---|---|---|---|---|---|---|---|---|---|---|
| (J2000.0) | (J2000.0) | (deg) | (deg) | (GeV) | (hr) | (ms) | (pc cm-3) | (kpc) | |||
| J0101.0–6423 | 301.2 | –52.7 | 1.3 | 2.3 | 1.0 | 2.57 | 11.93 | 0.55 | yes | ||
| J0603.0–4012 | 246.8 | –25.9 | 1.9 | 6.5 | 2.0 | — | — | — | — | ||
| J0933.9–6228 | 282.2 | –7.8 | 0.1 | 1.2 | 2.0 | — | — | — | — | ||
| J1036.2–6719 | 290.4 | –7.8 | 1.5 | 2.2 | 2.0 | — | — | — | — | ||
| J1227.9–4852 | 298.9 | 13.8 | 1.8 | 1.6 | 2.0 | — | — | — | — | ||
| J1232.2–5118 | 299.8 | 11.4 | 1.8 | 2.3 | 2.0 | — | — | — | — | ||
| J1514.1–4945 | 325.2 | 6.8 | 1.7 | 5.9 | 2.0 | 3.59 | 31.5 | 0.9 | yes | ||
| J1624.0–4041 | 340.6 | 6.2 | 2.1 | 3.3 | 2.0 | — | — | — | — | ||
| J1658.8–5317 | 335.0 | –6.6 | 2.1 | 1.8 | 1.3 | 2.44 | 30.9 | 0.9 | no | ||
| J1743.8–7620 | 317.1 | –22.5 | 1.2 | 2.0 | 1.5 | — | — | — | — | ||
| J1747.4–4035 | 350.2 | -6.4 | 1.5 | 3.4 | 1.4 | 1.65 | 152.9 | 3.3 | no | ||
| J1902.0–5110 | 345.6 | –22.4 | 1.7 | 4.4 | 1.2 | 1.74 | 36.3 | 1.2 | yes | ||
| J2039.4–5621 | 341.2 | -37.1 | 1.6 | 2.7 | 1.2 | — | — | — | — | ||
| J2241.9–5236ccSee Keith et al. (2011). | 337.4 | -54.9 | 1.6 | 3.6 | 2.0 | 2.19 | 11 | 0.5 | yes |
4. PSR J0101–6422
4.1. Timing Solution
After the discovery observations on 2009 November 25 and confirmation on December 8, we began regular timing observations of PSR J0101–6422 at Parkes. We observed the pulsar on 35 days through 2011 November 9, detecting it on 28 occasions; on the remaining 7 days it was too faint to detect, due to interstellar scintillation (DM=12 pc cm-3.) Each observation was typically one hour, with the same receiver and data acquisition system used in the search observations. Using TEMPO2222http://www.atnf.csiro.au/research/pulsar/tempo2 with the 28 times-of-arrival, we obtained a phase-connected timing solution whose parameters are given in Table 2.
The Shklovskii effect (Shklovskii, 1970) increases the measured value of beyond that intrinsic to the pulsar by , with the source velocity transverse to the line-of-sight. For nearby objects, it may dominate the true spindown rate and lead to overestimates of the spindown luminosity (Camilo et al., 1994). The observed proper motion, at the 0.55 kpc DM distance (Cordes & Lazio, 2002), implies a true . At this distance, the indicated km s-1 is typical for an MSP (see Nice & Taylor, 1995).
4.2. Radio Profile and Polarimetry
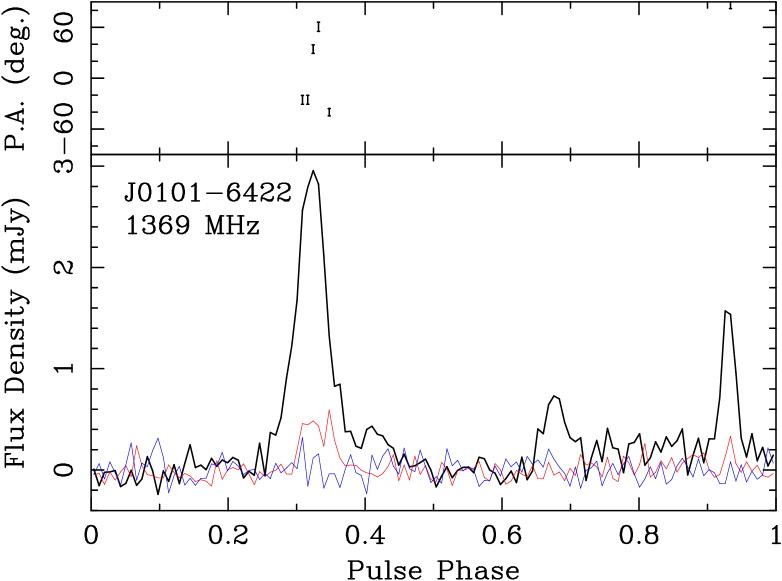
We made polarimetric and flux-calibrated observations of PSR J0101–6422, using the PDFB3 digital filterbank. The data were analyzed with PSRCHIVE (Hotan et al., 2004). The best full-Stokes profile that we obtained is shown in Figure 1 (the flux density of this profile is not necessarily representative of the average pulsar intensity, which varies greatly owing to interstellar scintillation). The main pulse is linearly polarized at the 15% level, but the low signal-to-noise ratio prevents a useful determination of rotation measure (the best-fit value is rad m-2, but within the uncertainties is consistent with zero). These data show that the subsidiary pulse component is composed of two outer peaks joined by a low bridge of radio emission.
4.3. Gamma-ray Profile
To characterize the -ray profile, we selected photons collected between 2008 Aug 4 and 2011 Aug 1 with reconstructed energies 0.3–3 GeV lying within 1.1° of the timing position. This selection balances completeness (including as many pulsed photons as possible) and pulsed signal-to-noise ratio as measured by the H-test (de Jager et al., 1989). We apply the same data processing as described in §4.4, omitting the horizon cut to increase the livetime by about 20%, at the expense of a slightly increased background.
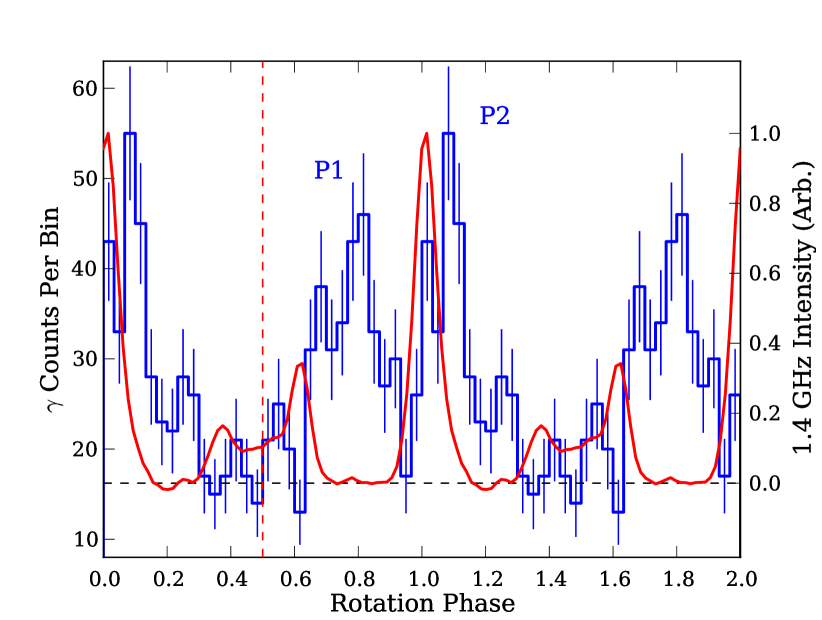
The light curve corresponding to this extraction appears in Figure 2. If rays are produced above the null charge surface (the locus of points where the magnetic field is orthogonal to the pulsar spin axis), they appear to an observer in the opposite hemisphere, whereas radio emission from low altitudes is beamed into the same hemisphere (see Romani & Yadigaroglu, 1995). In this scenario, the line-of-sight to PSR J0101–6422 would intercept a cone of radio emission in one hemisphere to produce the weaker radio peak at and a cone of radio and emission in the other to produce the two peaks and bright radio peak at . In keeping with this picture and the convention established in the literature, we identify the peak at as “P1” and that at as “P2”.
The relative phasing of the peaks is of interest (e.g. Watters et al., 2009). The radio-to- offset, , is measured from the center of the leading radio peak (taken as , see Figure 2). We estimated the phase of the -ray peaks using unbinned maximum likelihood with a two-sided Lorentzian model for the peaks. These estimates yield and a -ray peak-to-peak separation of . The DM-induced uncertainty in is . The systematic uncertainty for both and is estimated from the scatter obtained by fitting alternative functional forms for the peaks.
4.4. Gamma-ray Spectrum
To measure the spectrum of psr, we analyzed low background DIFFUSE class “Pass 6” (Atwood et al., 2009) LAT data collected between 2008 Aug 4 and 2011 Apr 17. We filtered periods where the observatory’s rocking angle exceeded or the Earth’s limb impinged upon the field of view (horizon cut, requires zenith angle °). We modelled the sensitivity to these events with the flight-corrected P6_V11_DIFFUSE instrument response function. To compute background contributions, we used a preliminary version of the 2FGL catalog and its accompanying diffuse emission models333http://fermi.gsfc.nasa.gov/ssc/data/access/lat/BackgroundModels.html. We selected events within and re-fit the spectra of point sources within and the normalizations of the diffuse models. Fits employed pointlike (Kerr, 2011), a binned maximum likelihood algorithm.
The phase-averaged spectrum of PSR J0101–6422 is well described by an exponentially cutoff power law, , whose parameters appear in Table 2. We also considered separately the spectra of the three major components, viz. P2 (), the off-pulse (), and P1 (). The parameter uncertainties are relatively large, and accordingly we found no significant difference in the spectral shapes of the two peaks. Further, we detected no significant emission in the off-pulse phase window and derived a confidence upper limit on the energy flux of a point source with a power law spectrum with , obtaining erg cm-2 s-1 ( MeV; scaled up by 3.3 to the full phase window.)
The observed flux is related to the -ray luminosity by , where is an unknown beaming factor (typically of order unity, e.g. Watters et al., 2009) implying a phase-averaged, isotropic () -ray luminosity erg s-1 at kpc. Best-fit values of from the TPC and OG models (§5.1) are 0.7 and 0.9. This -ray efficiency is in accord with other LAT-detected MSPs (Abdo et al., 2009a).
4.5. X-ray and Optical Observations
A 3.3 ks Swift observation with the X-ray Telescope in PC mode was obtained on 2009 Nov 21 to search for an X-ray counterpart to the then-unidentified 1FGL source. No significant counterpart is detected, with a 3 upper limit at the pulsar position of cts s-1 (0.5–8 keV). Assuming a power-law spectrum with photon index for a column with cm-2 (10 HI atoms per free electron along the line-of-sight) yields an unabsorbed flux limit of erg cm-2 s-1, or efficiency at 0.55 kpc. This limit is comparable to the detected X-ray flux from other MSPs (e.g. Marelli et al., 2011).
We searched four DSS plates and found no optical counterpart consistent with the pulsar’s position, suggesting .
| Parameter | Value |
|---|---|
| Right ascension, R.A. (J2000.0) | |
| Declination, decl. (J2000.0) | |
| Proper motion in R.A. decl. (mas yr-1) | 10(1) |
| Proper motion in decl. (mas yr-1) | –12(2) |
| Galactic longitude, (deg.) | 301.19 |
| Galactic latitude, (deg.) | –52.72 |
| Spin period, (ms) | 2.5731519721683(2) |
| Period derivative (apparent), | |
| Epoch of period (MJD) | 55520 |
| Orbital period, (days) | 1.787596706(2) |
| Epoch of periastron (MJD) | 55162.4011764(3) |
| Semi-major axis (lt s) | 1.701046(2) |
| Eccentricity | |
| Dispersion measure, DM (pc cm-3) | 11.926(1) |
| Spin-down luminosityaaCorrected for Shklovskii effect at 0.55 kpc; the percentage change from the nominal value is given., () | –16% |
| Characteristic ageaaCorrected for Shklovskii effect at 0.55 kpc; the percentage change from the nominal value is given., (yr) | +20% |
| Surface dipole magnetic field strength (Gauss)aaCorrected for Shklovskii effect at 0.55 kpc; the percentage change from the nominal value is given. | –9% |
| Mean flux densitybbAverage flux for 28 timing detections. at 1.4 GHz, (mJy) | |
| Radio–-ray profile offset, () | |
| -ray profile peak-to-peak separation, () | |
| -ray ( GeV) photon index, | |
| -ray cut-off energy, (GeV) | |
| Photon flux ( GeV) () | |
| Energy flux ( GeV), ( erg cm-2 s-1) |
Note. — Timing solution parameters given in TDB relative to the DE405 planetary ephemeris. Numbers in parentheses represent the measured TEMPO2 timing uncertainties on the last digits quoted. For -ray parameters, the first uncertainty is statistical and the second systematic.
5. Discussion
5.1. PSR J0101–6422
At first blush, PSR J0101–6422 is an unremarkable member of the growing population of -ray MSPs. The orbital characteristics suggest an epoch of Roche lobe overflow from an evolved 1–2 companion which later became the 0.2 He white dwarf currently inferred in the system (e.g. Tauris & Savonije, 1999). However, as we discuss below, PSR J0101–6422’s light curve is challenging to explain with simple geometric models that tie the radio and emission to particular regions of the magnetosphere.
Remarkably, a simple picture of -ray emission arising in the outer magnetosphere appears to describe the majority of both young (though see Romani et al., 2011) and recycled pulsars (e.g. Venter et al., 2009). On the other hand, while radio emission in young pulsars and some MSPs appears to come from lower altitudes, several MSPs have phase-aligned and radio peaks (e.g. Abdo et al., 2010a), implying a joint emission site at high altitude. These observations raise the prospect of MSPs whose radio emission combines “traditional” polar cap emission with a higher-altitude component.
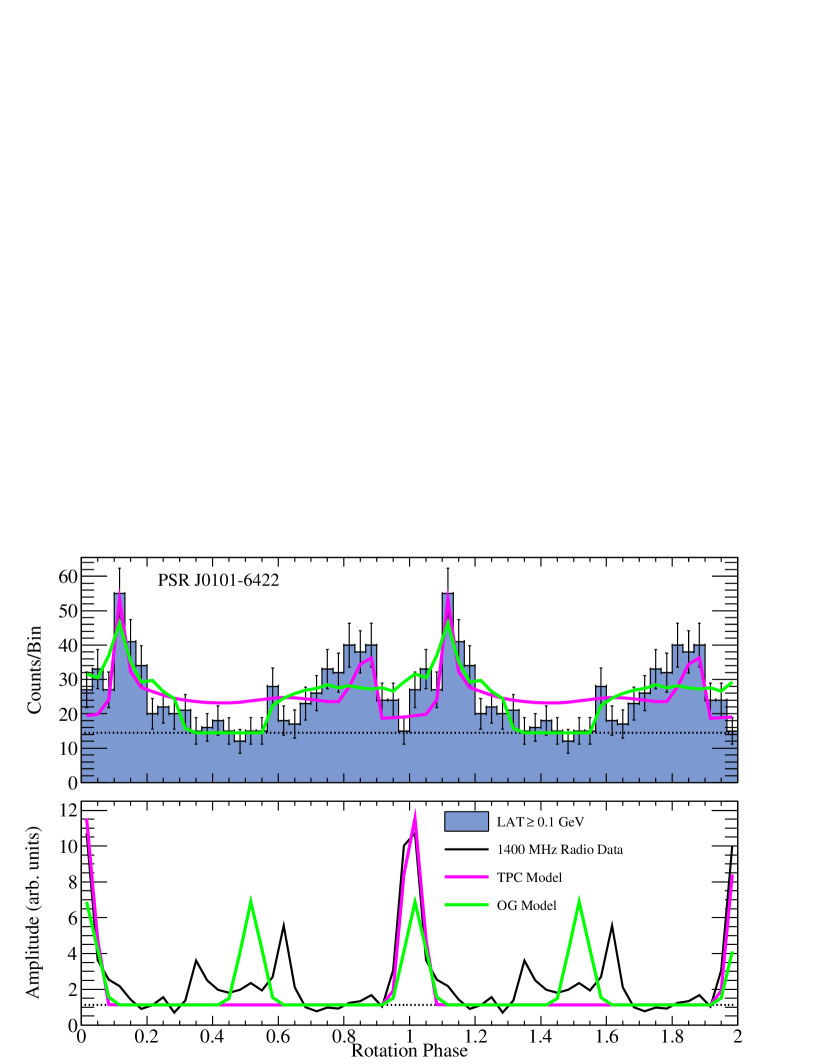
To determine which scenario best describes the emission pattern of PSR J0101–6422, we performed joint fits to the radio and -ray data following the method of Johnson (2011). We modelled the radio as a simple “cone” component (Story et al., 2007) and the rays using both the “two-pole caustic” (TPC) model of Dyks & Rudak (2003, N.B. we adopt a larger maximum cylindrical radius of 0.95 of the light cylinder) and the “outer gap” (OG) model (Cheng et al., 1986; Romani & Yadigaroglu, 1995). The angle between the pulsar spin axis and the line-of-sight, , is unknown a priori, but if the radio emission arises from low altitudes, then the presence of two peaks separated by roughly half of a rotation indicates the inclination of the magnetic axis from the spin axis () cannot be small. The best-fit light curves for the two -ray models appear in Figure 3. The low preferred for the TPC model cannot produce the radio interpulse and produces too much off-pulse -ray emission. The OG model, with a best fit at (orthogonal rotator), produces two radio peaks but fails to produce two clear peaks and the radio interpulse morphology.
Since neither model faithfully reproduces the observed light curves, we propose that one or both of the radio peaks may originate at higher altitude. Emission over a range of altitudes would also explain the low observed linear polarization of PSR J0101–6422 (e.g. Dyks et al., 2004) and admit smaller values. Alternatively, the failure of geometric models may indicate that the physical details of the MSP magnetosphere—e.g., currents, multipolar fields, and plasma loading of the field lines—and the radio and emission mechanisms play an important role.
5.2. Survey Implications
With 6/14 pointings resulting in unbiased MSP detections, this survey was fruitful, though this high efficiency may be luck. Indeed, in our timing campaign, we only detected PSR J0101–6422 on 28 of 35 attempts, and several observations required prior knowledge of the ephemeris for detection. Thus, because of scintillation, we estimate that PSR J0101–6422 is only detectable in 2/3 observations, depending somewhat on integration time. Many field MSPs are in eclipsing binaries, further diminishing the probability of detection in a single observation.
We believe the strongest factor in our search’s success was the source selection criteria. E.g., Ransom et al. (2011) selected nonvariable LAT sources (but including no spectral shape information) and found MSPs in 3/25 pointings. But when considering only targets with , their efficiency jumps to 3/8. Keith et al. (2011) employed some spectral information and detected MSPs unbiasedly in 1/11 pointings (1/4 for ). A short list of 7 spectrally-exceptional candidates drawn up for a Nançay radio telescope survey included 5 MSPs, three of which were discovered from Nançay observations (Cognard et al., 2011; Guillemot et al., 2011). And, Hessels et al. (2011) used nearly identical selection criteria as this work in a Green Bank Telescope survey at 350 MHz and found MSPs in 13/49 pointings, all but one at .the
Targeting pulsar-like sources is clearly efficient. However, new LAT sources will lie at the sensitivity threshold and the limited statistics will not admit classification of spectral shape and variability. Nonetheless, we argue that future radio searches should omit detailed ranking schemes and target any LAT source off the Galactic plane that has not been associated with a known blazar.
We believe this substantially increased target list (and telescope time) is justified. In the 2FGL source catalog (Abdo et al., 2011), there are 350 unassociated sources more than 5° off the Galactic plane. MSPs account for roughly 5% of associated LAT sources, so 15–20 MSPs may remain to be found in these unassociated 2FGL sources. With only 350 positions to monitor, multiple deep observations can ameliorate the confounding effects of scintillation and eclipses while requiring a fraction of the time of a comparably complete all-sky survey. By comparison, the otherwise prodigious Parkes multibeam survey found “only” 17 MSPs in over 40,000 pointings (e.g. Faulkner et al., 2004). In addition to the intrinsic interest in discovering new MSPs, by thoroughly searching all such LAT sources, we will gain confidence that the MSPs we have found can truly provide a volume-limited sample of the energetic, -loud MSPs, an invaluable step in the study of the MSP population of the Milky Way.
References
- Abdo et al. (2009a) Abdo, A. A., et al. 2009a, Science, 325, 848
- Abdo et al. (2009b) —. 2009b, Science, 325, 840
- Abdo et al. (2010a) —. 2010a, ApJ, 712, 957
- Abdo et al. (2010b) —. 2010b, ApJS, 188, 405
- Abdo et al. (2010c) —. 2010c, ApJS, 187, 460
- Abdo et al. (2011) —. 2011, arXiv:1108.1435
- Atwood et al. (2009) Atwood, W. B., et al. 2009, ApJ, 697, 1071
- Camilo et al. (1994) Camilo, F., Thorsett, S. E., & Kulkarni, S. R. 1994, ApJ, 421, L15
- Cheng et al. (1986) Cheng, K. S., Ho, C., & Ruderman, M. 1986, ApJ, 300, 500
- Cognard et al. (2011) Cognard, I., et al. 2011, ApJ, 732, 47
- Cordes & Lazio (2002) Cordes, J. M., & Lazio, T. J. W. 2002, ArXiv Astrophysics e-prints arXiv:astro-ph/0207156
- de Jager et al. (1989) de Jager, O. C., Raubenheimer, B. C., & Swanepoel, J. W. H. 1989, A&A, 221, 180
- Dyks et al. (2004) Dyks, J., Harding, A. K., & Rudak, B. 2004, ApJ, 606, 1125
- Dyks & Rudak (2003) Dyks, J., & Rudak, B. 2003, ApJ, 598, 1201
- Faulkner et al. (2004) Faulkner, A. J., et al. 2004, MNRAS, 355, 147
- Guillemot et al. (2011) Guillemot, L., et al. 2011, MNRAS, submitted
- Hessels et al. (2011) Hessels, J. W. T., et al. 2011, arXiv:1101.1742
- Hotan et al. (2004) Hotan, A. W., van Straten, W., & Manchester, R. N. 2004, Publications of the Astron. Soc. of Australia, 21, 302
- Johnson (2011) Johnson, T. 2011, PhD Thesis, University of Maryland, arXiv:TBD
- Keith et al. (2011) Keith, M. J., et al. 2011, MNRAS, 414, 1292
- Kerr (2011) Kerr, M. 2011, PhD Thesis, University of Washington, arXiv:1101.6072
- Manchester et al. (2001) Manchester, R. N., et al. 2001, MNRAS, 328, 17
- Marelli et al. (2011) Marelli, M., De Luca, A., & Caraveo, P. A. 2011, ApJ, 733, 82
- Nice & Taylor (1995) Nice, D. J., & Taylor, J. H. 1995, ApJ, 441, 429
- Pletsch et al. (2012) Pletsch, H. J., et al. 2012, ApJ, 744, 105
- Ransom (2001) Ransom, S. M. 2001, PhD thesis, Harvard University
- Ransom et al. (2011) Ransom, S. M., et al. 2011, ApJ, 727, L16
- Romani et al. (2011) Romani, R. W., Kerr, M., Craig, H. A., Johnston, S., Cognard, I., & Smith, D. A. 2011, ApJ, 738, 114
- Romani & Yadigaroglu (1995) Romani, R. W., & Yadigaroglu, I.-A. 1995, ApJ, 438, 314
- Shklovskii (1970) Shklovskii, I. S. 1970, Soviet Ast., 13, 562
- Smith et al. (2008) Smith, D. A., et al. 2008, A&A, 492, 923
- Story et al. (2007) Story, S. A., Gonthier, P. L., & Harding, A. K. 2007, ApJ, 671, 713
- Tauris & Savonije (1999) Tauris, T. M., & Savonije, G. J. 1999, A&A, 350, 928
- Venter et al. (2009) Venter, C., Harding, A. K., & Guillemot, L. 2009, ApJ, 707, 800
- Watters et al. (2009) Watters, K. P., Romani, R. W., Weltevrede, P., & Johnston, S. 2009, ApJ, 695, 1289