Spatio-temporal Fermionization of Strongly Interacting 1D Bosons
Abstract
Building on the recent experimental achievements obtained with scanning electron microscopy on ultracold atoms, we study one-dimensional Bose gases in the crossover between the weakly (quasi-condensate) and the strongly interacting (Tonks-Girardeau) regime. We measure the temporal two-particle correlation function and compare it with calculations performed using the Time Evolving Block Decimation algorithm. More pronounced antibunching is observed when entering the more strongly interacting regime. Even though this mimics the onset of a fermionic behavior, we highlight that the exact and simple duality between 1D bosons and fermions does not hold when such dynamical response is probed. The onset of fermionization is also reflected in the density distribution, which we measure in situ to extract the relevant parameters and to identify the different regimes. Our results show agreement between experiment and theory and give new insight into the dynamics of strongly correlated many-body systems.
pacs:
03.75.Hh, 03.75.Kk, 05.30.JpInteractions between particles are of particular importance in one-dimensional (1D) systems as they lead to strong quantum correlations. For ultracold bosonic atoms, reduced dimensionality and control of interactions can be achieved experimentally by quantum optics tools. This has lead to the observation of the strong-interaction regime of bosonic atoms weiss2004 ; bloch2004 . One-dimensional ultracold gases offer moreover a unique test bench for theory, as they are among the few many-body systems which can be described on the basis of integrable hamiltonians such as the Lieb-Liniger (LL) model liebliniger ; yangyang . While the integrability provides exact benchmarks for a comparison with experiments, important quantum characteristics such as higher-order correlation functions remain a challenge revmodphys ; kheruntsyan2008 . Their measurement would provide important information about the many-body system beyond that accessible from density profiles in coordinate or momentum space correlation . Only local second and third order correlation functions, and , have been experimentally investigated in 1D via indirect diagnostics weiss2005 ; haller2011 ; bouchoule2011 . Of even larger interest are temporal correlations as they probe the nature of excitations, which goes beyond the characterization of quantum properties of the ground or thermal state of the system. In order to directly access correlation functions in situ, spatially resolved single atom sensitive detection methods are well suited guarrera ; kuhr2011 . In this work, we use scanning electron microscopy to study one-dimensional tubes of ultracold bosonic atoms in the crossover between the weakly and the strongly interacting regime. We characterize the 1D systems by performing in situ measurements of the spatial density distribution, which allows for the determination of the relevant parameters and the identification of the different interaction regimes. The complete temporal two-particle correlation function
| (1) |
is then measured for . Here are the bosonic field operators and indicates the quantum mechanical average. The results are finally analysed on the basis of the LL model, solved by numerical methods.
The usual classification of the 1D regimes for trapped Bose gases, under conditions that justify the local density approximation (LDA), is based on the dimensionless interaction parameter at the trap center and on the temperature olshanii2001 ; kheruntsyan2005 . The space dependent LL parameter is defined as , with the mass of the particle, the density and the 1D coupling constant for , where is the three-dimensional -wave scattering length, the frequency of the radial harmonic confinement and . For and below the degeneracy temperature kheruntsyan2005 , with the Boltzmann constant, a weakly interacting quasi-condensate phase is predicted. The spatial density profile in a harmonic trap is expected to be well described by a Thomas-Fermi (TF) parabola olshanii2001 and kheruntsyan2005 . In the opposite limit, , the 1D gas is strongly interacting and approximates a Tonks-Girardeau (TG) gas. The density profile is a square root of a parabola and , which indicates an effective reduction in the overlap of the particle wavefunctions, resembling the fermionic exclusion principle.
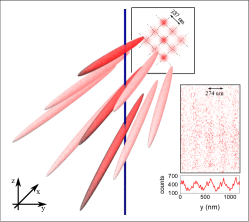
In our experiment, a Bose-Einstein condensate (BEC) of about 87Rb atoms is created in the optical dipole trap realized by a focused CO2 laser beam. Once the BEC is produced, its final atom number is accurately adjusted by scanning the electron beam on the outer part of the cloud. In this way we control the atom number and we selectively discard the warmer particles, effectively reducing the temperature of the sample (to less than nK). For the experiments reported here, we prepared two different sets of BEC samples with (10k) and (60k) atoms respectively. In order to create the 1D atomic tubes, we adiabatically superimposed to the CO2 dipole trap a two-dimensional (2D) blue-detuned optical lattice, realized by a pair of retroreflected laser beams with wavelength nm and waist m (see Fig. 1). The final frequencies in the tubes for the two sets of measurements are Hz, kHz (10k atoms) and Hz, kHz (60k atoms), where is due to the axial confinement of the dipole trap. The number of tubes created varies from to , with a maximum occupation number in the centre of about and atoms respectively. Changing the density of the initial three-dimensional system and the radial confinement , we are thus able to experimentally access two different 1D regimes in the crossover between the strongly and the weakly interacting limit: in the central tube for the set with 10k atoms and for the set with 60k atoms.
In order to characterize in detail our experimental 1D systems, we image the entire cloud by scanning it with an electron beam of keV energy, nA current and nm FWHM Gericke2008 . At the end of the scan the number of atoms remaining in the trap is probed by time-of-flight absorption imaging and the BEC is checked to be pure. For each set of measurements images of the cloud are summed. Each scanning line of the image along the -direction corresponds to the sum of the density profiles of the 1D tubes displaced in a vertical row along the direction of the electron beam, see Fig. 1.
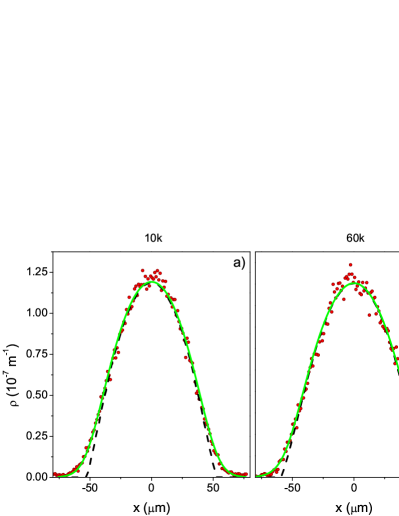
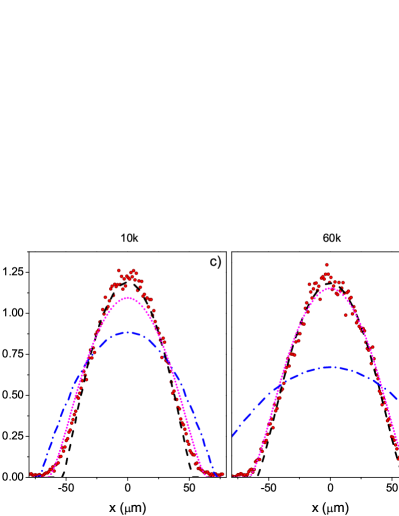
For the two sets of measurements, the density profiles of the central row of the images, corresponding to the sum of respectively and tubes along the -direction, are shown in Fig. 2. The results are first compared with the exact Yang-Yang (YY) solution, where the only free parameters are the total atom number and the temperature. We numerically solve the YY equations for a uniform 1D gas, for a given temperature, and we then apply the LDA to account for the axial confinement kheruntsyan2005 . The resulting density profile is then obtained as a sum over the different tubes, where the number of tubes and atoms per tube are determined on the basis of the TF distribution of the initial BEC. The final curves show excellent agreement with the experimental data. Notably this allows for an accurate determination of for the different tubes and of the temperature of the system. For the first set of measurements (10k atoms) we find that ranges from to in the different tubes along the -direction, resulting in the weighted average . The fitting parameters are atoms and nK. For the second set (60k atoms): and with and nK. For further confirmation of the extracted temperatures, we additionally measure in two ways: with a gaussian fit of the density in the outermost tubes along the -direction and by calculating the average degeneracy temperature at which the density profile of the outer tubes starts to match with a normal distribution, when moving along the -axis. We find: nK and nK for 10k atoms, nK and nK for 60k atoms. In Fig. 2(a)-(b), we also show numerical solutions for the LL theory at with LDA, calculated for the same values extracted from the YY fit. The two models agree well, showing only a small discrepancy at the wings. This is due to the fact that the measured temperatures are below the weighted average of over the tubes, i.e. (10k atoms) and (60k atoms). To better clarify the regime of our measurements, in Fig. 2(c)-(d) we compare the profiles obtained with the LL model with those calculated by solving the Gross-Pitaevskii equation in the TF approximation and by solving the TG model, with the same atom number olshanii2001 . For the lower , Fig. 2(d), the actual density profile is very close to the TF, while the TG distribution is significantly distant: the system lies in the weakly interacting TF limit. Increasing above , Fig. 2(c), the experimental data and the exact 1D theory start to significantly deviate from the TF distribution. The TG profile, conversely, becomes closer: an intermediate regime towards the TG limit and the complete fermionization has been entered.
When we proceed to the measurement of , the differences between the two experimental situations outlined above become even more evident. The observation of interaction induced antibunching in the two-particle correlation function is the most direct indication of a fermionic behaviour emerging in an ensemble of bosonic particles. The experimental procedure is similar to the one described in our earlier work guarrera . Once the 1D systems are prepared, we investigate them by focussing the electron beam at the center of the cloud. What we measure is the average correlation function of two ionization events obtained by probing simultaneously or different tubes. For these measurements we set the electron beam current to nA and FWHM nm. The spatial resolution, set by the FWHM of the electron beam, is smaller than the minimum estimated spatial correlation length for the probed systems, i.e. nm (10k atoms) and nm (60k atoms). The is measured on the ion signal collected in ms. This is the longest holding time at which the system is still a pure BEC. We compute the correlation functions over about (10k atoms) and (60k atoms) repetitions of the experiment. In Fig. 3(b) we report the details of the measured for the set with 10k atoms, where antibunching is visible with an amplitude . For the shape of the signal suggests the existence of two timescales on which the correlations relax: a short one ( s) and a longer one ( s). We first discuss the longer timescale and, to this purpose, we show the data with 80 s bin time in Fig. 3(c)-(d). From these data, using an exponential fitting, we extract the correlation times s (10k) and s (60k), defined as the times corresponding to the reduction of .
The function in the ground state can be theoretically calculated for each single tube, by simulating the dynamics of the system using exact numerical methods. We note that the use of a theory is justified in this case since the majority of the investigated tubes are below tzero . In order to perform the simulations, we discretize the LL model Muth2010 . This lattice problem can then be treated using the Time Evolving Block Decimation (TEBD) algorithm Vidal2003 , which is one of the extensions of the Density Matrix Renormalization Group to time evolution Daley2004 and is based on a Matrix Product State (MPS) ansatz Schollwock2011 . We perform the calculation on a gas of particles confined in a harmonic potential. is evaluated in the center of the tube at , according to the experiment.
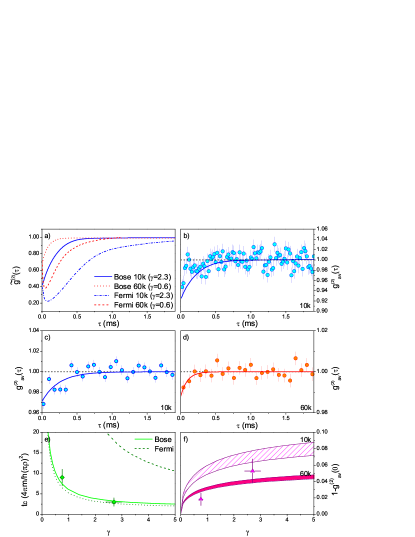
The numerical procedure consists of first calculating the interacting ground state at fixed particle number Muth2010 . We then apply the annihilator at , which is straightforward in the discretized MPS representation, resulting in a particle state . This state is finally propagated in time. The spatio-temporal correlation function is then the expectation value of the local density operator in the time-evolved state , where is the Hamiltonian of the system. The finite size of the system turns out to have no influence because all the excitations, travelling with the speed of sound, reach the edges of the cloud only at a time when the antibunching structure in has already decayed. In addition we take into account the finite width of the electron beam by averaging over its Gaussian profile : , see Fig. 3(a). As the experiment measures several independent tubes at the same time, we calculate by averaging over the corresponding to each tube average . The uncorrelated signal coming from different independent tubes is responsible for the reduction of the antibunching amplitude from the value of () for the single tube to the global calculated () in the systems with 10k (60k) atoms. Concerning the longer timescale, the agreement of the averaged theoretical curves with the experimental data in Fig. 3(b) is fairly good. For a quantitative comparison, we show in Fig. 3(e) and (f) the experimentally derived correlation times and amplitudes together with their theoretical counterparts. The correlation time rescaled by is independent on and is strongly depending on in the regime of our measurements: increasing the interactions above we observe a significant decrease of . This behaviour is in good agreement with our experimental findings. The interpretation of as a function of in the regime that we consider is mainly complicated by the average over a different number of tubes. This effect is indeed contributing to the increase of the amplitude for the higher value of . Anyway the comparison between the experimental and theoretical amplitudes is compatible within the error bars. We note that finite temperature effects cannot have a significant role in the reduction of the amplitude tzero .
It is well known girardeau ; gaudin ; cheon that 1D bosons can be mapped to interacting fermions for arbitrary interaction strengths. As a consequence the density distribution and density-density correlations of bosons are identical to that of the corresponding fermions. Conversely, this simple Bose-Fermi duality breaks down when the temporal pair correlation function is probed: the theoretical curves in Fig. 3(a) and (e) show indeed a notable difference between the fermionic and the bosonic case, which is confirmed by the experimental data. The observable measured and calculated in this work, i.e. , is fundamentally different from the dynamical density-density correlations previously derived in Ref. caux2006 because the bosonic field operators do not commute at different times. This is also the reason for Bose-Fermi duality to fail. We finally discuss the shorter timescale visible in Fig. 3(b), which corresponds to an additional modulation of the signal with frequency kHz. The energy scale introduced by the electron beam can be roughly estimated to be FWHM kHz, suggesting it to be the origin of such an oscillation. We note that a similar modulation is not visible, within the error bars, in the weakly interacting case and was never observed in a 3-dimensional degenerate sample guarrera . This suggests this behaviour could be associated to the presence of strong correlations between the particles when .
In summary, we have performed in situ high-resolution measurements of the density profiles of few 1D tubes in the crossover between the weakly () and the more strongly () interacting regimes. We find excellent agreement in the comparison with a model based on the YY solutions and LDA, allowing us to extract the values of the tubes, the global atom number and the temperature. Comparison with the LL, TF and TG models allows us to clearly define the regimes of the measurements and to circumscribe the role of temperature. We measured the temporal two-particle correlation function, observing genuine antibunching in correspondence to the entering of the more strongly interacting regime, characterized by evident fermionization of the bosonic particles already at intermediate values of . We have numerically calculated and we find fairly good agreement with the experimental data, showing the exact duality following the Bose-Fermi mapping does not hold for this observable. This work paves the way to the study of complex dynamics as those resulting from quenches bernier2011 and to the investigation of thermalization processes in 1D rigol2009 .
Acknowledgements.
We thank B. Schmidt for fruitful discussions and P. Würtz and F. Stubenrauch for technical support and experimental assistance. We acknowledge financial support by the DFG within the SFB/TRR 49 and GRK 792. V. G. and G. B. are supported by Marie Curie Intra-European Fellowships. D. M. and R. L. acknowledge support by the MAINZ graduate school.References
- (1) T. Kinoshita, T. Wenger and D. S. Weiss, Science 305, 1125 (2004).
- (2) B. Paredes et al., Nature 429, 277 (2004).
- (3) E.H. Lieb and W. Liniger, Phys. Rev. 130, 1605 (1963).
- (4) C.N. Yang and C.P. Yang, J. Math. Phys. 10, 1115 (1969).
- (5) M. A. Cazalilla et al., Rev. Mod. Phys. 83, 1405 (2011).
- (6) A. G. Sykes et al., Phys. Rev. Lett. 100, 160406 (2008).
- (7) T. Jeltes et al., Nature 445, 402 (2007); S. Fölling et al., Nature 434, 481 (2005); T. Rom et al., Nature 444, 733 (2006).
- (8) T. Kinoshita, T. Wenger and D. S. Weiss, Phys. Rev. Lett. 95, 190406 (2005).
- (9) E. Haller et al., Phys. Rev. Lett. 107, 230404 (2011).
- (10) T. Jacqmin et al., Phys. Rev. Lett. 106, 230405 (2011).
- (11) V. Guarrera et al., Phys. Rev. Lett. 107, 160403 (2011).
- (12) M. Endres et al., Science 334, 200 (2011).
- (13) V. Dunjko, V. Lorent and M. Olshanii, Phys. Rev. Lett. 86, 5413 (2001).
- (14) K. V. Kheruntsyan, D. M. Gangardt, P. D. Drummond and G. V. Shlyapnikov, Phys. Rev. A 71, 053615 (2005).
- (15) T. Gericke et al., Nature Physics 4, 949 (2008).
- (16) The calculated reductions of the amplitude due to the measured finite in our experiment are (10k) and (60k) kheruntsyan2005 .
- (17) D. Muth, M. Fleischhauer and B. Schmidt, Phys. Rev. A 82, 013602 (2010).
- (18) G. Vidal, Phys. Rev. Lett. 91, 147902 (2003); G. Vidal, Phys. Rev. Lett. 93, 040502 (2004).
- (19) A. J. Daley, C. Kollath, U. Schollwöck and G. Vidal, J. Stat. Mech.: Theor. Exp. (2004) P04005; S. R. White and A. E. Feiguin, Phys. Rev. Lett. 93, 076401 (2004).
- (20) U. Schollwöck, Ann. Phys. 326, 96 (2011).
- (21) The average is performed summing the signals, i.e. the ions, coming from the same tubes with the uncorrelated ones coming from the coupling of the different tubes: , where is the atom number in the -th tube, is the total number of atoms and is the calculate for the -th tube with the values derived from the analysis of the density profiles. The pointing instability of the electron beam is also taken into account.
- (22) M. Girardeau, J. Math. Phys. 1, 516 (1960).
- (23) M. Gaudin, La Fonction d’Onde de Bethe, Masson, Paris (1983).
- (24) T. Cheon and T. Shigehara, Phys. Rev. Lett. 82, 2536 (1999).
- (25) J. S. Caux, P. Calabrese, Phys. Rev. A 74, 031605 (2006).
- (26) J. S. Bernier, G. Roux and C. Kollath, Phys. Rev. Lett. 106, 200601 (2011); D. Muth, B. Schmidt and M. Fleischhauer, New J. Phys. 12, 083065 (2010).
- (27) M. Rigol, Phys. Rev. Lett. 103, 100403 (2009).