Phonon spectrum, thermodynamic properties, and pressure-temperature phase diagram of uranium dioxide
Abstract
We present a study of the structural phase transition and the mechanical and thermodynamic properties of UO2 by means of the local density approximation (LDA) approach. A phase transition pressure of 40 GPa is obtained from theory at 0 K, and agrees well with the experimental value of 42 GPa. The pressure-induced enhancements of elastic constants, elastic moduli, elastic wave velocities, and Debye temperature of the ground-state fluorite phase are predicted. The phonon spectra of both the ground state fluorite structure and high pressure cotunnite structure calculated by the supercell approach show that the cotunnite structure is dynamically unstable under ambient pressure. Based on the imaginary mode along the direction and soft phonon mode along the direction, a transition path from cotunnite to fluorite has been identified. We calculate the lattice vibrational energy in the quasiharmonic approximation using both first-principles phonon density of state and the Debye model. The calculated temperature dependence of lattice parameter, entropy, and specific heat agrees well with experimental observations in the low temperature domain. The difference of the Gibbs free energy between the two phases of UO2 has predicted a boundary in the pressure-temperature phase diagram. The solid-liquid boundary is approximated by an empirical equation using our calculated elastic constants.
pacs:
71.27.+a, 61.50.Ks, 62.20.-x, 63.20.dkI INTRODUCTION
Due to its critical importance in the nuclear fuel cycle and to the complex electronic structure arising from a partially occupied 5f orbital, uranium dioxide (UO2) has been studied extensively in experiments Schoenes ; Baer ; Idiri ; YuTobin ; Tobin ; An and computational simulations Brooks ; Dudarev3 ; Boettger2 ; Kudin ; Prodan2 ; Yin ; Petit ; Zhang2010 ; Geng2011 . The 5f electrons in UO2 play a pivotal role in understanding its electronic, thermodynamic, and magnetic properties Santini . Using density functional theory (DFT) with a conventional exchange-correlation potential, e.g., the local density approximation (LDA) or generalized gradient approximation (GGA), an incorrect ferromagnetic (FM) conducting ground state of UO2 was observed Boettger2 due to an error produced by underestimating the strong on-site Coulomb repulsion of the 5f electrons. Similar problems have been confirmed in previous investigations of NpO2 WangNpO2 and PuO2 Zhang2010 within the pure LDA/GGA schemes. Fortunately, for PuO2 a theory based on completely localized 5f states reproduced well the crystal field splittings as well as the magnetic susceptibility Colarieti-Tosti . The antiferromagnetic (AFM) Mott-Hubbard insulator nature of UO2 has been well reproduced in LDA/GGA+U Dudarev3 , the hybrid density functional HSE (Heyd, Scuseria, and Enzerhof) Prodan2 , the self-interaction corrected local spin-density (SIC-LSD) approximation Petit , and LDA plus dynamical mean-field theory (DMFT) Yin2011 calculations, which properly describe the photoelectron spectroscopy experiments Schoenes ; Baer .
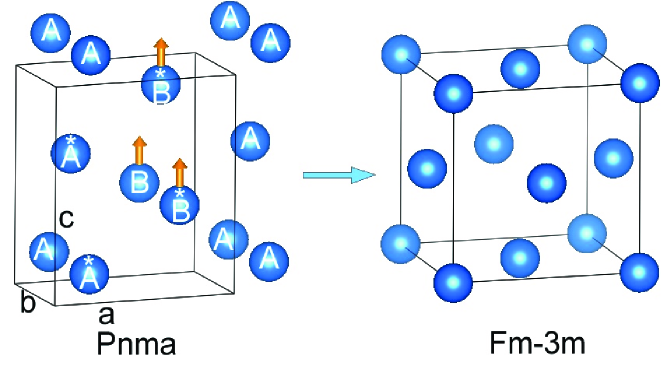
At ambient conditions, UO2 crystallizes in a cubic fluorite structure (Fmm, No. 225) with cations located in a face-centered cubic (fcc) structure and anions occupying tetrahedral sites. Similar to the high-pressure behavior of ThO2 and PuO2 Dancausse , a recent hydrostatic compression experiment Idiri has shown that UO2 also transforms to the orthorhombic structure of cotunnite-type (Pnma, No. 62) at room temperature, beyond 42 GPa. This kind of pressure-induced phase transition (PT) for actinide dioxides is the same as for the alkaline earth fluorides Dorfman and has not been sufficiently studied, although experiments Dancausse ; Idiri and theoretical works Geng ; WangThO2 ; Zhang2010 have paid great attention to this issue. The data on the cotunnite phase are scarce in the literature, especially for its thermodynamic properties and vibrational characters. The temperature contributions to the PT have not been included in previous studies. On the other hand, the melting properties of UO2 also have not been well investigated. Only a few experiments have been conducted to describe the melting of UO2 near ambient pressure, because of the difficult experimental conditions required to control and monitor the PT Manara .
In a previous systematic work Zhang2010 , the structural, electronic, and mechanical properties of AFM UO2 in its ground-state fluorite phase were presented together with the high-pressure cotunnite phase at their corresponding equilibrium states, as given by LDA+U with U=4 eV. By means of the third-order Birch-Murnaghan equation of state (EOS) Birch fitting, the lattice parameter =5.449 Å and bulk modulus B=220.0 GPa were found for Fmm UO2. These values are in good agreement with results of recent LDA+U calculation Andersson (=5.448 Å and B=218 GPa), as well as experimental investigations Yamashita ; Idiri (=5.47 Å and B=207 GPa). In the present work, we perform an extended study of the structural, mechanical, and thermodynamic properties of UO2 in the pressure range from 0 to 250 GPa and in a temperature interval from 0 to 4000 K. To this aim, we employ the LDA+U and GGA+U schemes as implemented by Dudarev et al. Dudarev1 ; Dudarev2 ; Dudarev3 . The total energies of the nonmagnetic (NM), AFM, and FM phases of the fluorite structure have been calculated in a wide range of the effective Hubbard U parameter to check the validity of the ground-state calculations. At 0 K, a PT pressure of 40 GPa is predicted. In addition, we have calculated the elastic constants, elastic moduli, Poisson’s ratio, elastic wave velocities, and Debye temperature of AFM fluorite UO2 in the pressure range from 0 to 40 GPa. The structural transition path of the cotunnite phase to the fluorite phase as well as the melting behavior, have been studied based upon our calculated phonon dispersions, Gibbs free energy, and elastic constants. Thermodynamic properties including the Gibbs free energy, the temperature dependence of the lattice parameter and the bulk modulus, entropy, and specific heat have also been evaluated. The rest of this paper is arranged as follows. In Sec. II the computational methods are described. In Sec. III we present and discuss our results. In Sec. IV we summarize the conclusions of this work.
II computational methods
II.1 Computational details
First-principles DFT calculations are performed by means of the Vienna ab initio simulation package (VASP) Kresse3 , based on the frozen-core projected augmented wave (PAW) method of Blöchl PAW . The exchange and correlation effects are described with the LDA and GGA LDA ; GGA , and a cutoff energy of 500 eV is used for the set of plane waves. The k-point meshes in the full wedge of the Brillouin zone (BZ) are sampled by 999 and 9159 grids, respectively for fluorite and cotunnite UO2, according to the Monkhorst-Pack (MP) Monk scheme. All atoms are fully relaxed until the Hellmann-Feynman (HF) forces become less than 0.02 eV/Å. The U 6s27s26p66d25f2 and the O 2s22p4 orbitals are treated as valence electrons. Similar to our previous studies WangNpO2 ; Zhang2010 , the strong on-site Coulomb repulsion among the localized U 5f electrons is described by using the LDA/GGA+U formulated by Dudarev et al. Dudarev1 ; Dudarev2 ; Dudarev3 , where the double counting correction has already been included as in the fully localized limit (FLL) liechtenstein95 . In this paper, we study several values of the Hubbard parameter , while we keep the Hund’s exchange parameter fixed to =0.51 eV, following the results of Dudarev et al. Dudarev1 ; Dudarev2 ; Dudarev3 . One can notice that only the difference between and is significant in our method Dudarev2 , and we will henceforth refer to it as a single parameter, named for sake of simplicity.
We calculate the ground-state properties of both phases of UO2 by means of LDA/GGA+ with and without the inclusion of spin-orbit coupling (SOC). We find the AFM state to be lower in energy than the FM state, which is in agreement with experimental observations and with other calculations, as properly analyzed below. Then we calculate elastic constants, phonon spectra and thermodynamics properties at different pressures. These quantities are known to be well described without including SOC for both UO2 and PuO2 Boettger1 ; Boettger2 ; ProdanJCP ; Prodan1 ; Zhang2010 ; Sanati . The reason for this is that the 5f states are chemically inert in UO2, due to their high localization Brooks . The entire chemical binding is provided by the spd states of U and the sp states of O, and for these states SOC is less important. Therefore, in most of our work on UO2, the SOC is not included, but we make a proper comparison to verify this approximation.
Additionally, in order to check the validity of our results, we perform LDA+ calculations with Elk elk , a full-potential augmented plane wave (FLAPW) method code. Here SOC is included for magnetic calculations in a second-variational scheme, and the double counting is chosen in the FLL. The muffin-tin (MT) radii (RMT) of U and O are set to 1.2 and 0.9 Å, respectively. The parameter R, which determines the number of plane waves in the FLAPW method, is set to 9.5. A grid is used to sample the BZ.
The Elk results are consistent with VASP, and the AFM configuration is found to be the most energetically favorable state. In Elk, we also calculate the total energy of the 3 magnetic configuration, in which the star of the wave vector of the magnetic structure contains three members. The AFM configuration (1) with magnetic moments aligned along the axis (longitudinal) and within the plane (transversal) are collinear structures, whereas the 3 configurations (transversal and longitudinal) are non-collinear. We compare the total energies and find that the 1 configuration is the most stable one. The 3 longitudinal and transversal configurations are almost degenerate, differing by only a few meV/U atom.
II.2 Elastic properties, Debye temperature, and melting temperature
To avoid the Pulay stress problem, the geometry optimization at each volume is performed with VASP at fixed volume rather than constant pressure. Elastic constants for cubic symmetry (, , and ) and orthorhombic structure (, , , , , , , , and ) are calculated by applying stress tensors with various small strains onto the equilibrium structures. The strain amplitude is varied in steps of 0.006 from =0.036 to 0.036. A detailed description of the calculation scheme used here can be found in Ref. Zhang2010 . After having obtained the elastic constants, the polycrystalline bulk modulus B and shear modulus G are calculated from the Voigt-Reuss-Hill (VRH) approximations Hill . The Young’s modulus E and Poisson’s ratio are calculated through and . In the calculation of the Debye temperature (), we use the relation
| (1) |
where h and are Planck and Boltzmann constants, respectively, n is the number of atoms in the molecule, is molecular volume, and is the average sound wave velocity. The average wave velocity in the polycrystalline materials is approximately given by
| (2) |
where ( is the density) and are the transverse and longitudinal elastic wave velocity of the polycrystalline materials, respectively. The melting temperature () in units of K for cubic UO2 is deduced from the elastic constant () by an approximate empirical formula Fine :
| (3) |
where the is in units of GPa and the standard error is about 300 K.
II.3 Phonon and thermodynamic properties
We use the supercell approach Parlinski and the small displacement method as implemented in the FROPHO code fropho to calculate the phonon curves in the BZ and the corresponding phonon density of states (DOS) for both fluorite and cotunnite phases of UO2. In the interpolation of the force constants for calculating the phonon dispersion, we sample the BZ of the 222 and 222 supercells with respectively 333 and 353 k points. These meshes are set up by means of the MP scheme. The forces induced by small displacements are calculated within VASP.
Thermodynamic properties can be determined by phonon calculations using the quasiharmonic approximation (QHA) Siegel ; Zhang2010 or the quasiharmonic Debye model GIBBS . Within these two models, the Gibbs free energy is written as
| (4) |
Here, is the Helmholtz free energy at temperature T and volume V, and can be expressed as
| (5) |
where is the ground-state total energy, is the vibrational energy of the lattice ions and is the thermal electronic contribution. Since we are treating a wide gap insulator, we can avoid considering , as explained in similar works Zhang2010 .
Under QHA, can be calculated by
| (6) |
where represents the phonon frequencies and is the phonon DOS. This formula strictly requires that the phonon DOS is positive, and therefore it is not suitable for dynamically unstable phases. In this case, the vibration energy for phases where the phonon frequencies are imaginary can be estimated by the Debye model
| (7) |
where is the zero-point energy due to lattice ion vibration at 0 K and is the Debye integral written as . Note that here is not calculated by means of Eq. (1), but using a different prescription. For a more detailed overview of the computational details, we redirect the reader to Ref. GIBBS .
III results
III.1 Phase transition at 0 K
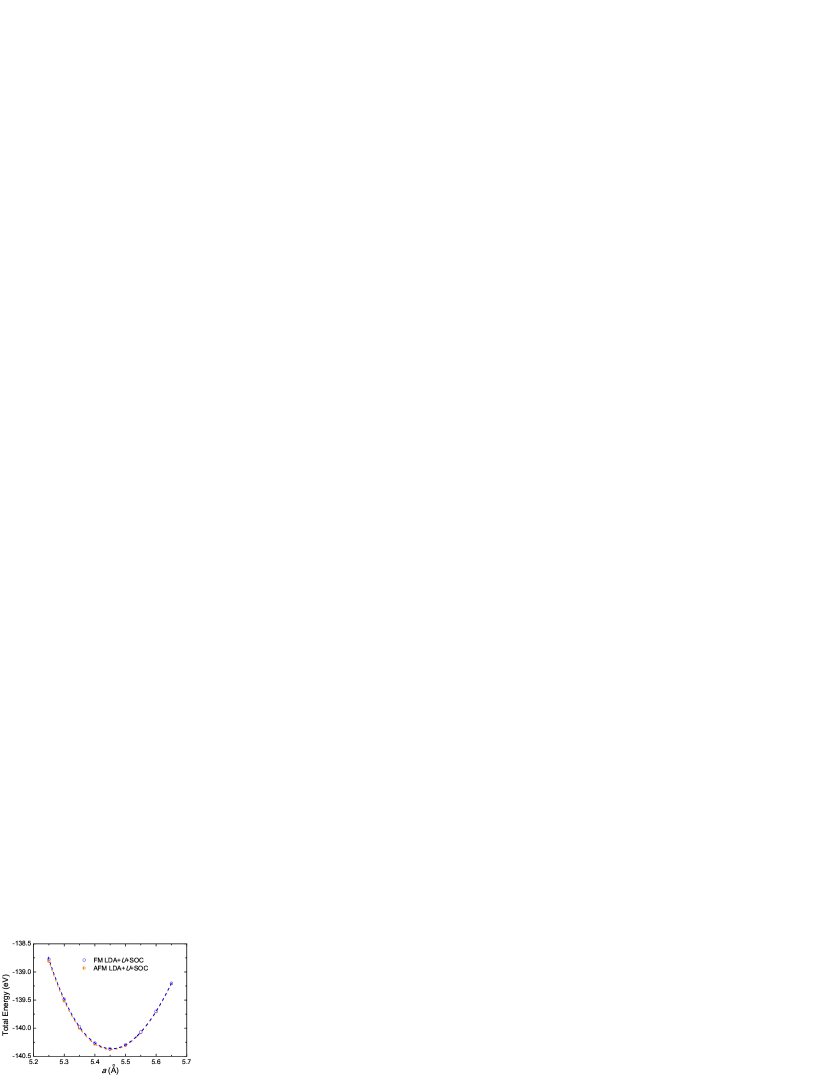
In Fig. 1 we report the energy versus lattice constant curves of the Fmm phase in the AFM and FM configurations, as obtained through VASP with LDA+U+SOC and U=4 eV. As one can clearly observe, the AFM arrangement has the lowest energy, and the energy difference with the FM arrangement is 3.7 meV, which becomes 1.5 meV if GGA+U+SOC is used. These values are very consistent with recent DFT+U+SOC results, where an energy difference of about 6 meV is predicted Zhou , with a slightly different . Our results are also consistent with the experimental Néel temperature of TN=30.8 K Frazer . By fitting our data for AFM configuration with the EOS, we obtain an equilibrium lattice constant and a bulk modulus of 5.453 Å and 221 GPa, respectively. Instead, using Elk with similar setup and =4 eV, the optimized equilibrium volume, lattice constant, and bulk modulus are 162.0 Å3, 5.440 Å, and 230 GPa, respectively. These values are in good agreement with our VASP calculations, and therefore support their reliability.
Furthermore, we can evaluate the spin and orbital contribution to the magnetic moment ( and ). Our LDA+U+SOC calculations with VASP give values of =1.30 and =-3.32 for the 1 k AFM structure. These are in reasonable agreement with previous DFT+U+SOC values of =1.75 and =-3.55 by the all electron code WIEN2K Laskowski and the experimental total magnetic moment () value of 1.74 FaberPRB .
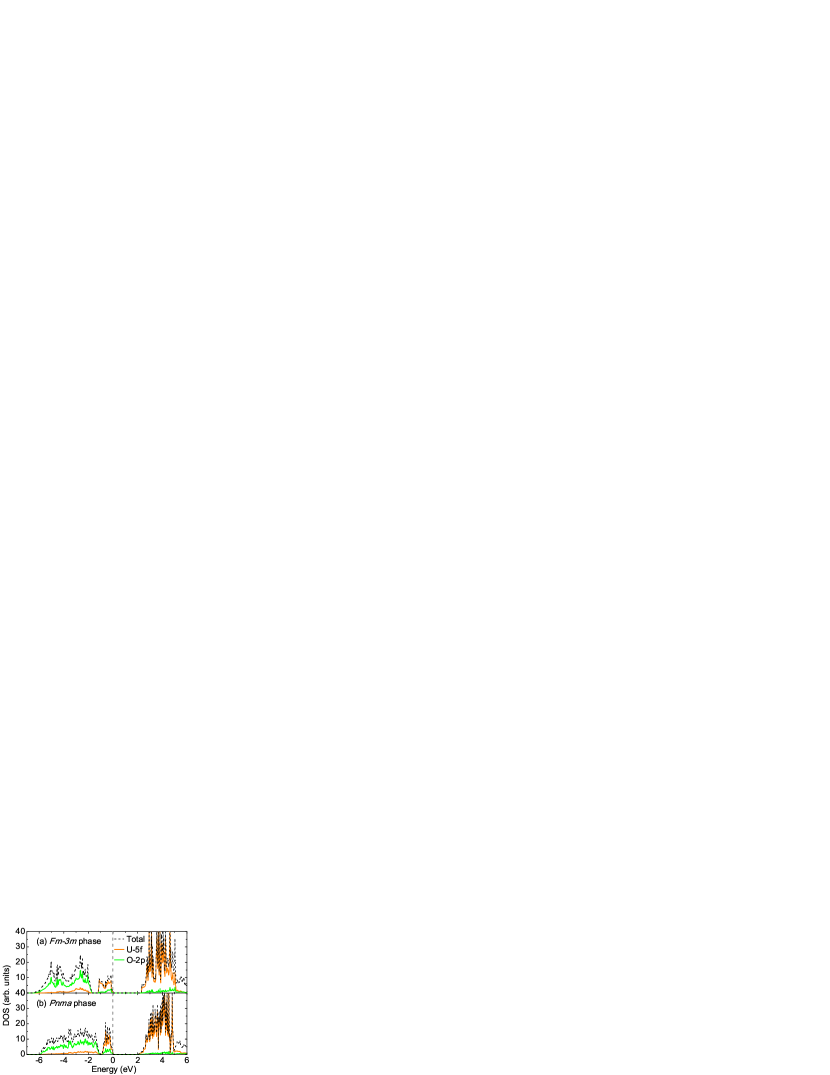
The total electronic DOS as well as the projected DOS for the U 5f and O 2p orbitals obtained by LDA+U+SOC for the Fmm and the phases are shown in Fig. 2. For the latter, the optimized structural lattice parameters a, b, and c are equal to 5.974, 3.605, and 6.965 Å respectively, in the AFM configuration. The energy band gaps () for the Fmm and phases are 2.3 and 2.0 eV, respectively. Our result for the ground-state fluorite phase is in good agreement with the value of =2.4 eV, obtained in recent calculations with HSE+SOC Wen . However these numbers are still larger than the experimental value of =2.0 eV that was measured above the Néel temperature Baer .
| Pressure | a | C11 | C12 | C44 | B | G | E | ||||||
|---|---|---|---|---|---|---|---|---|---|---|---|---|---|
| (GPa) | (Å) | (GPa) | (GPa) | (GPa) | (GPa) | (GPa) | (GPa) | (g/cm3) | (m/s) | (m/s) | (m/s) | (K) | |
| 0 | 5.449 | 389.3 | 138.9 | 71.3 | 222.4 | 89.5 | 236.8 | 0.323 | 11.084 | 2841.8 | 5552.7 | 3183.4 | 398.1 |
| 5 | 5.408 | 414.8 | 154.5 | 94.3 | 241.2 | 107.3 | 280.4 | 0.306 | 11.343 | 3076.1 | 5821.1 | 3438.7 | 433.3 |
| 10 | 5.373 | 438.2 | 166.7 | 106.7 | 257.2 | 117.5 | 305.9 | 0.302 | 11.565 | 3187.5 | 5982.3 | 3561.2 | 451.7 |
| 15 | 5.340 | 459.2 | 181.6 | 118.9 | 274.1 | 126.5 | 328.9 | 0.300 | 11.776 | 3277.7 | 6131.8 | 3661.1 | 467.2 |
| 20 | 5.310 | 479.8 | 195.6 | 131.3 | 290.4 | 135.5 | 351.8 | 0.298 | 11.979 | 3363.3 | 6270.7 | 3755.8 | 482.0 |
| 25 | 5.282 | 500.3 | 208.3 | 143.6 | 305.6 | 144.6 | 374.6 | 0.296 | 12.175 | 3445.7 | 6398.0 | 3846.7 | 496.3 |
| 30 | 5.254 | 520.8 | 221.6 | 156.0 | 321.3 | 153.4 | 397.0 | 0.294 | 12.364 | 3522.3 | 6521.7 | 3931.4 | 509.8 |
| 35 | 5.229 | 540.0 | 233.7 | 167.8 | 335.8 | 161.8 | 418.2 | 0.292 | 12.546 | 3591.1 | 6630.0 | 4007.3 | 522.2 |
| 40 | 5.204 | 558.0 | 246.7 | 180.9 | 350.4 | 170.3 | 439.8 | 0.291 | 12.722 | 3659.1 | 6737.7 | 4082.5 | 534.5 |
| Expt. | 5.473 | 389.3 | 118.7 | 59.7 | 209.0 | 83.0 | 221.0 | 0.324 | 385, 395 | ||||
| LDA+U | 5.448 | 380.9 | 140.4 | 63.2 | 220.6 | 82.0 | 218.9 | 0.335 | 399 |
Up to now, we have only presented results by DFT+U+SOC. However, our main focus in the present study is on the mechanical properties, phonon spectrum, and thermodynamic properties. The effect of the SOC on these quantities is rather small, as was pointed out in Ref. Sanati . Therefore, in the following, we will present results obtained without SOC, and we will discuss the associated errors, if relevant.
Using LDA+U with U=4 eV, we obtain =5.449 Å and =220 GPa for the Fmm phase in AFM configuration by EOS fitting. These values are identical to our previous results Zhang2010 , and in good agreement with the corresponding values by LDA+U+SOC. The energy band gap and the spin magnetic moment are calculated to be 1.9 eV and 1.98 , respectively. These values are in excellent agreement with both a previous LDA+U calculation Geng (Eg=1.45 eV and =1.93 ) and experiments (Eg=2.0 eV Baer ). Notice that here a comparing of the total magnetic moment with experiments is not suitable due to the lack of the relevant orbital contribution. For Pnma UO2 in AFM phase, we obtain the optimized structural lattice parameters a, b, and c to be 5.974, 3.604, and 6.967 Å, respectively. The band gap is calculated to be 1.6 eV. Thus, the band gap should not increase from the Fmm phase to the Pnma phase either by LDA+U+SOC or by LDA+U. This result is different from a previous LDA+U calculation Geng , where an increase of the band gap was found at a cell volume close to the transition pressure from 0.8 eV in the fluorite phase to 2.4 eV in the cotunnite phase, by using different values of Hubbard parameters.
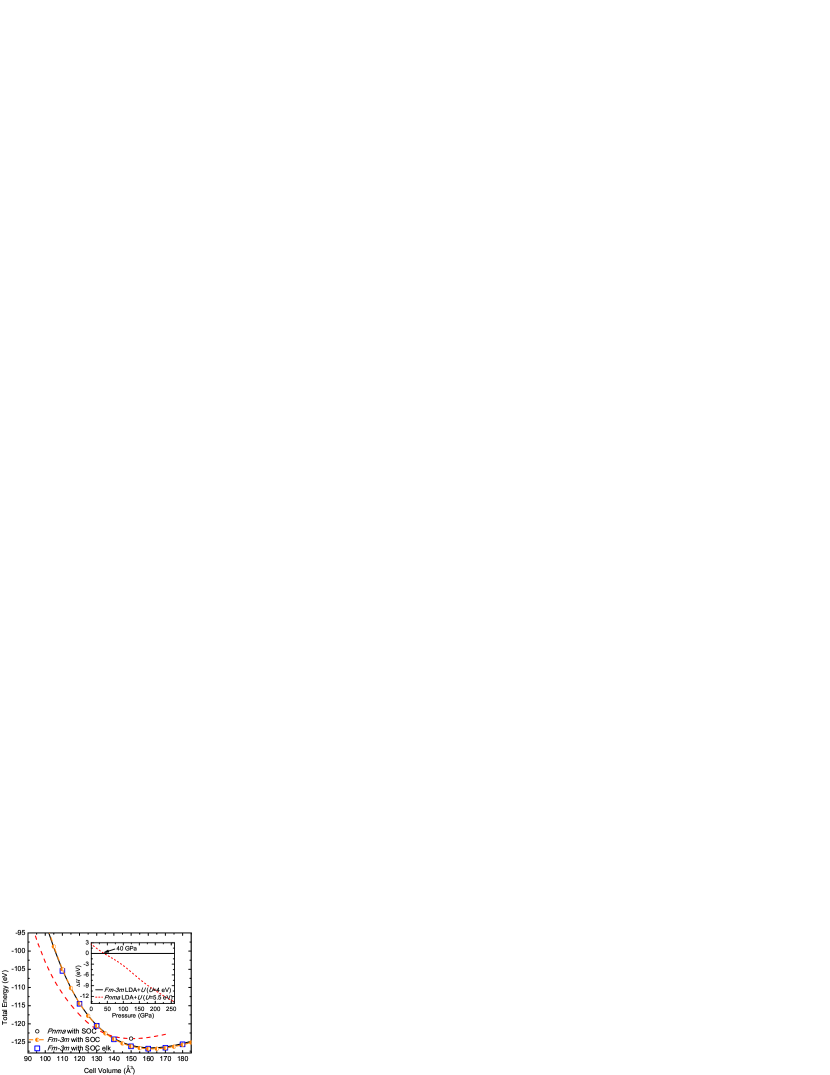
In Fig. 3, we show the total energy vs cell volume curves of the Fmm and Pnma phases. These curves are important for describing the PT under an externally applied pressure. If one uses the same Hubbard parameter for both phases, a PT is predicted at 7 GPa, which is not consistent with experimental data. It was previously argued Geng that a better description of the PT can be obtained by using = 5.5 eV, and in the present study we followed the suggested prescription. From Fig. 3 it is clear that the Fmm phase is stable at ambient conditions and that a transition to the Pnma phase is expected under compression. In the inset of Fig. 3 we show the relative enthalpies of the Pnma phase with respect to the Fmm phase as a function of the pressure. Considering that at 0 K the Gibbs free energy is equal to the enthalpy, we can then identify the PT pressure as 40 GPa, as indicated by the cross point. This is consistent with the previous LDA+ results of about 38 GPa Geng , and also with the experimentally observed value of 42 GPa Idiri . Finally in Fig. 3 we also show results obtained with LDA+U+SOC with VASP and with Elk. The good agreement that one can observe between the three sets of simulations indicates that the effects associated with the SOC can be neglected when calculating the elastic and structure properties of UO2.
III.2 Elasticity of fluorite UO2
The elastic constants can measure the resistance and mechanical properties of a crystal under external stress or pressure, thus describing the stability of crystals against elastic deformation. We present in Table I the lattice constant, elastic constants, bulk modulus, shear modulus, Young modulus, Poisson’s ratio, density, elastic wave velocities, and Debye temperature for Fmm AFM UO2 at different pressures. All these values are obtained through LDA+U VASP calculations with U=4 eV. We also calculate the elastic constants at 0 GPa by including SOC using VASP, obtaining =395.9 GPa, =134.0 GPa, and =89.5 GPa. These values are in close agreement with both our LDA+U results and experiments, as shown in Table I, and illustrate that the inclusion of SOC is not crucial for the elastic properties of UO2. Elastic constants at 0 GPa have been widely studied by experiments Fritz or through first-principles calculations Dudarev_elastic ; Devey ; Sanati . Our calculated results at zero pressure are consistent with these values, and in particular with the recent LDA+U work of Sanati et al. Sanati . There, the author also show that the SOC introduces only marginal changes in the elastic properties of UO2, thus supporting our chosen methodology for this study. In the entire pressure range considered in our study, is prominently larger than , indicating that the bonding strength along the [100]/[010]/[001] directions is clearly stronger than that of the bonding along the [011]/[101]/[110] directions. In fact, there are eight U-O covalent bonds per formula unit for fluorite UO2. The angle of all eight bonds with respect to the [100]/[010]/[001] directions is 45∘. However, only four bonds make an angle of 45∘ with the [011]/[101]/[110] directions. Four other bonds are vertical to the strain directions of [011]/[101]/[110], and they have no contributions to the elastic strength. Therefore, it is intuitive that for cubic UO2. This kind of analysis of the chemical bonding has been previously used to explain the different theoretical tensile strengths in the three typical crystalline orientations of PuO2 Zhang2010 . Finally, for the Debye temperature, our calculated result of 398.1 K is in excellent agreement with experimental data Fritz ; Dolling .
As indicated in Table I, pressure-induced enhancements of elastic constants, elastic moduli, elastic wave velocities, and Debye temperatures are evident with the exception of the Poisson’s ratio. These quantities all increase linearly with pressure. While and have the same increase rate of 2.7, has a larger one of 4.2. This can also be understood from the previous bonding analysis. The rates with which B, G, and E increase, are 3.2, 2.0, and 5.1, respectively. Considering that , , and for cubic symmetry, we can understand why the increase rate of G is only about 60% of the increase rate of B. For transverse () and longitudinal () sound velocities, increase rates of 20.4 and 29.6 m s-1GPa-1 are respectively obtained. The larger increase rate of the transverse sound velocity upon compression is due to the larger enhancement of the bulk modulus B with respect to the shear modulus G. The linear increase of the Debye temperature under pressure is also evident from this analysis, and can supply useful informations in practical applications and/or theoretical investigations of UO2.
III.3 Phonon dispersion
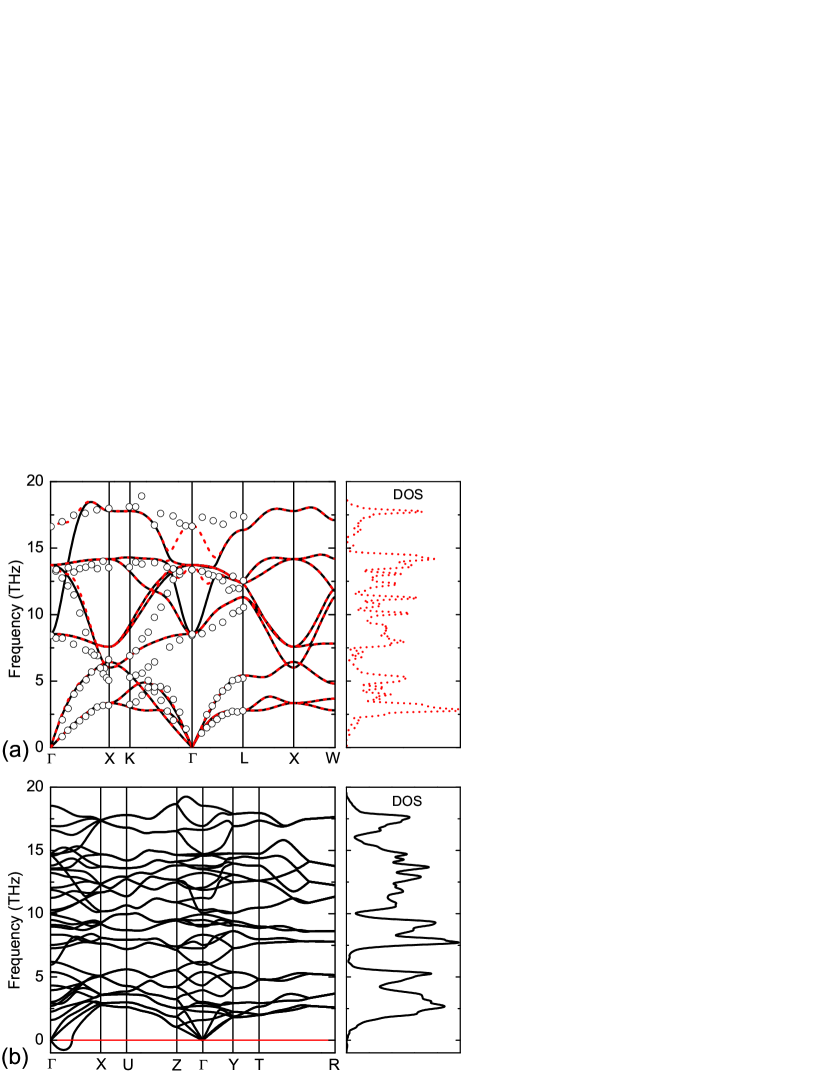
The calculated phonon dispersion curves as well as the corresponding phonon DOS are displayed in Fig. 4 for and UO2 in the AFM configuration. To our knowledge, no experimental or theoretical results on phonons have been published for the high-pressure phase of actinide dioxides. For UO2 in the phase, i.e., at ambient pressure, several experimental techniques have been used to evaluate its vibrational properties, namely inelastic neutron scattering Dolling ; Pang and infrared and Raman spectroscopy Schoenes ; LivnehPRB ; LivnehJPCM . Also, from the theoretical side, this system has been widely investigated, e.g., through LDA+DMFT Yin , MD Goel , GGA Yun , and LDA/GGA++SOC Sanati . In Fig. 4(a) we show the phonon dispersion of the phase along ------ directions. The segments -, -, and -, are respectively along the [001], [110], and [111] directions. Here we should note that neglecting the SOC in plain LDA or GGA leads to underestimating the optical modes, since the modes at high frequencies are shifted to lower frequencies. However, in LDA+ (for large enough ) this problem disappears, and it has been proved that SOC does not introduce any significant correction Sanati . From Fig. 4(a), one can find that including polarization effects is necessary to correctly account for the longitudinal optical (LO)-transverse optical (TO) splitting near the point in BZ. Here, the Born effective charges (=5.54 and =2.77) of U and O ions for AFM UO2 are also calculated. Our phonon dispersions are overall in good agreement with the inelastic neutron scattering experiment Dolling ; Pang and previous calculations Yin ; Goel ; Yun ; Sanati .
In Fig. 4(b) we show the phonon dispersion of the phase along ------- directions. The high-symmetry points here correspond to (0, 0, 0), (0, , 0), (0, , ), (0, 0, ), (-, 0, 0), (-, 0, ), and (-, , ). Although in our previous work on the elastic constants Zhang2010 we have predicted the phase of UO2 to be mechanically stable in its equilibrium state, Fig. 4(b) clearly shows that the transverse acoustic (TA) mode close to the point becomes imaginary along the - (i.e., the [010]) direction. This means that the high-pressure phase of UO2 is dynamically unstable at ambient pressure. In addition, we can find a clear soft phonon mode along the - (i.e., the [001]) direction. Thus, U atoms in the structure are easy to move along the [010] and [001] directions. Based on these observations, we show in Fig. 5 a suggested path for the transition. The phase can be viewed as an AB periodically layered structure along the [100] direction. During the transition, at the beginning the adjacent (100) planes slip relatively along the [001] direction to create a face-centered orthorhombic structure (as indicated by the arrows in Fig. 5). Then, the cell expands along the [010] direction and shrinks in the vertical directions to form the fcc fluorite structure.

III.4 Thermodynamic properties and phase diagram
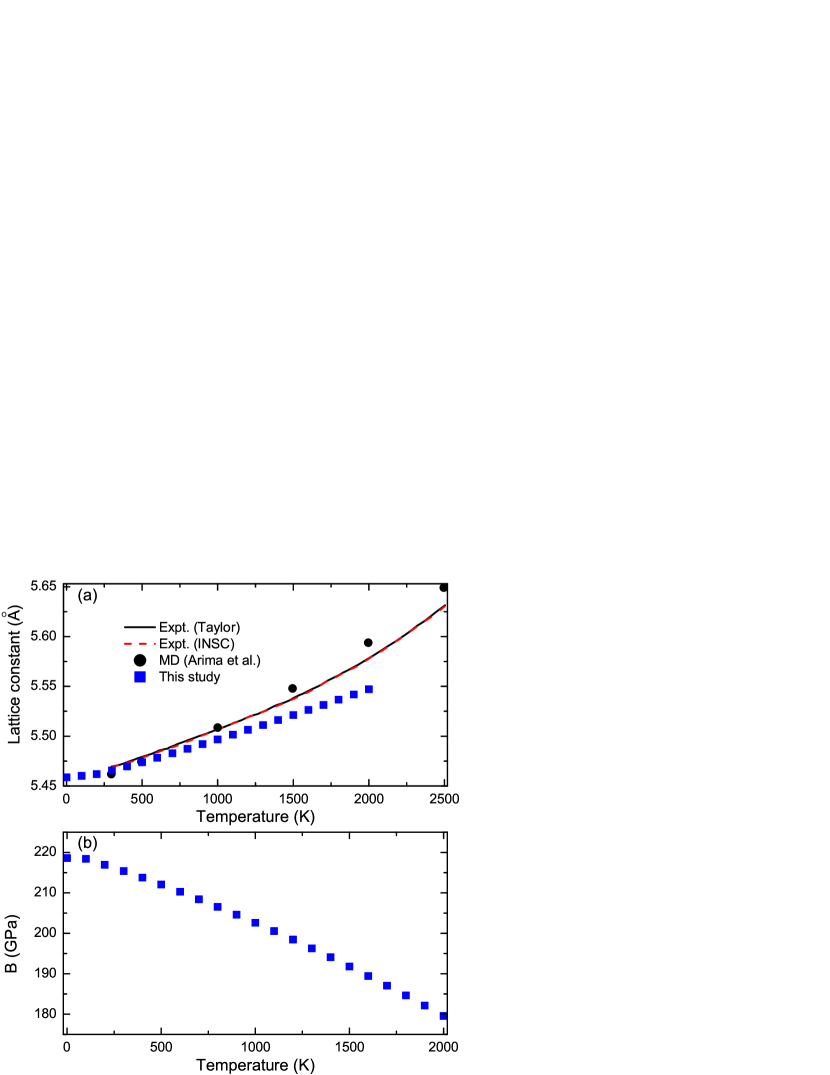
The calculated free energy curves of UO2 for temperatures ranging from 0 up to 2000 K are shown in Fig. 6. Note that in the calculation of , the ground-state total energy and phonon free energy should be evaluated by constructing several 222 fcc supercells. This procedure is computationally very expensive. In Fig. 6, the equilibrium lattice parameters at different temperature T are also presented. Figure 7 shows the temperature dependence of the lattice parameter and the bulk modulus. The equilibrium volume and the bulk modulus are obtained by EOS fitting. Experimental results from Refs. Taylor and INSC as well as the MD results from Arima are also plotted. We observe a good agreement of the calculated lattice parameters with respect to the experiments in the low-temperature domain. However, our values are somewhat lower than the experimental ones for temperatures higher than 800 K. The differences may come from the thermal electronic contribution and/or anharmonic effects. Similar to PuO2 Zhang2010 , the bulk modulus decreases when the temperature is increased. For UO2 the amplitude of such a change between 0 and 1500 K is 26.8 GPa, which is larger than that of PuO2 by about 6.2 GPa. This means that UO2 will be softened quicker upon increasing temperature in comparison with PuO2.
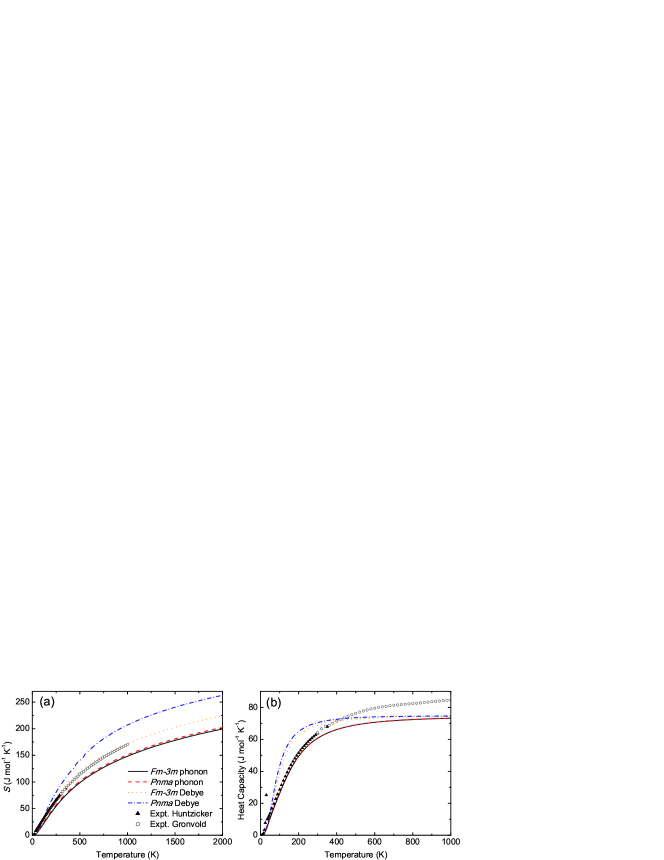
Using the QHA and the Debye model, we have calculated the Gibbs free energy (), entropy (), and specific heat at constant volume () for and phases of UO2. Notice that since the specific heat at constant pressure () has similar trends as Zhang2010 , in the present work will refer only to the latter. In Fig. 8 the dependence of the and on the temperature is showed, together with the experimental results from Refs. Gronvold and Huntzicker . Under the QHA, the curves of the entropy for the and phases are almost identical to each other. The of fluorite UO2 is underestimated in a wide range of temperatures with respect to the experiments, in agreement with recent calculations Sanati .
However, as clearly indicated in Fig. 8(a), the Debye model can give proper results for UO2. Using the Debye model, the curves for the and phases will separate when increasing temperature. The difference between the QHA and the Debye model is due to the fact that the Debye model includes some anharmonic contributions in the calculation of and , while the QHA does not. Although the Debye model is less accurate, it can supply a qualitative picture or even a quantitative description of the thermodynamic properties. As shown in Fig. 8(b), the of UO2 under the QHA agrees well with experiments up to room temperature and becomes close to a constant in the Dulong-Petit limit Kittel . Similar trends have been recently observed for the of the phase by Sanati et al. Sanati . Our results point to that the curves for the and phases are almost identical to each other. However, in the Debye model, a slower increase of the when increasing the temperature is observed for the phase with respect to the phase. The Debye model gives =390.6 and 352.8 K for the and phases respectively, and these values are in good agreement with the values of 398.1 and 343.7 K computed from the elastic constants Zhang2010 .
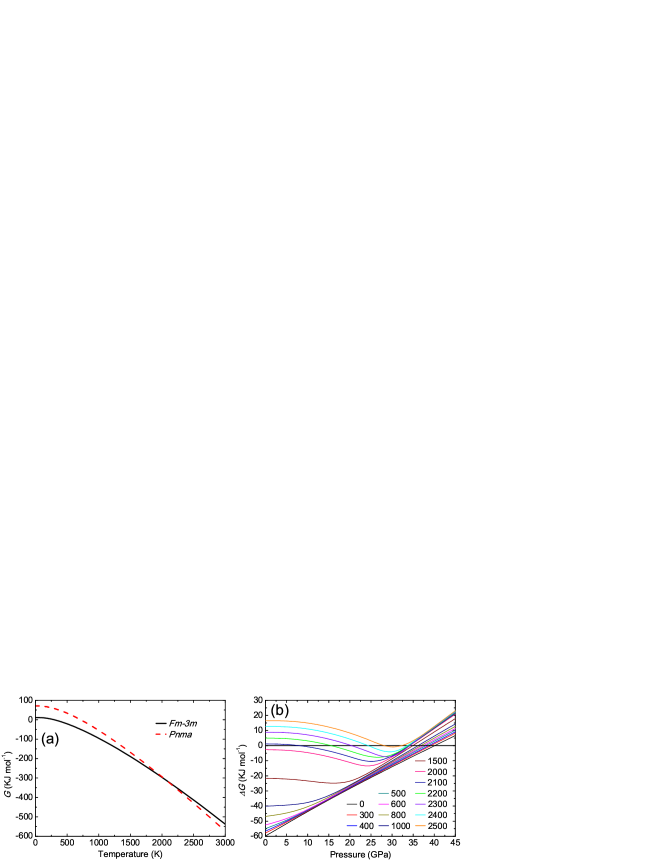
As shown in Fig. 9(a), the crossing between the Gibbs free energy of the and phases, as obtained through the Debye model, clearly gives a PT temperature of 2069 K. This implies a significant temperature contribution for the PT, which is hence not only pressure driven. To predict the phase boundary of this PT, we calculate the Gibbs free energy of the and crystal structures in a temperature range from 0 to 3000 K, and the effect of the pressure is studied in the range between 0 and 45 GPa. The difference of the Gibbs energy () between the fluorite and cotunnite structures of UO2 as a function of pressure for several temperatures is reported in Fig. 9(b). At 0 K, the PT pressure is predicted to be 40 GPa, corresponding to our aforementioned result. Along with increasing temperature in the range from 0 to 2069 K, the pressure of the transition decreases slightly. At higher temperatures, the phase is only stable in middle pressure range.
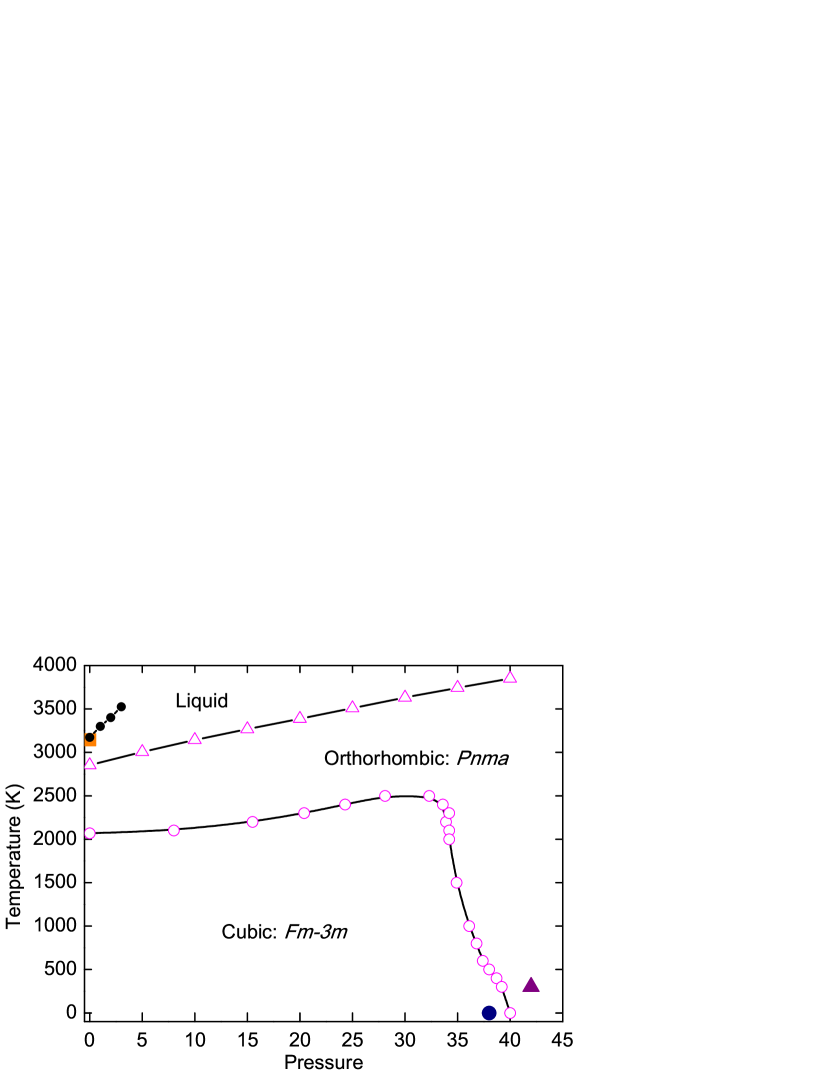
Once the free energies of the two experimentally observed structures are determined, the phase boundary can be obtained by equating the Gibbs free energies at a given pressure and temperature. Besides, the solid-liquid boundary can be featured by the melting temperature . Based on these results, we can plot in Fig. 10 the phase diagram of UO2. Other theoretical Arima ; Geng and experimental Manara ; Idiri values are also presented for comparison. For the phase boundary between and , only one point at ambient condition was reported in experiment. Our predicted results call for further experimental and theoretical works, to investigate the accuracy of the theory. For the solid-liquid boundary, the experimentally determined melting value at zero pressure is 3147 K Manara . We note that experiment and recent MD calculation have reported the relationship between melting point and pressure to be 3147 K and 3178 K, respectively, where is pressure in unit of GPa. Using our calculated data in Fig. 10, we obtain 2882 K. The melting point at zero pressure is underestimated by about 265 K, which is the same as previous LDA+ calculations Sanati . The increasing rate of is largely underestimated compared to experiment. Although we cannot claim that our calculations are more reliable than these experiments, we note that the latter were performed only in a narrow range of pressure, between 0.01 and 0.25 GPa.
IV CONCLUSION
In summary, we have carried out a first-principles DFT+U exploration of the ground-state properties as well as the high-temperature/pressure behavior of UO2 within VASP. For a few selected cases these calculations have been compared with LDA++SOC simulations within VASP and Elk. We find that all types of calculations resulted in equilibrium volumes and elastic constants which are in good agreement with each other. This shows that the inclusion of SOC does not significantly influence the structural properties of UO2. By choosing the Hubbard U parameter around 4 eV within the LDA+U approach, the equilibrium state features for both the ambient Fmm and the high-pressure Pnma phases of UO2 are shown to agree well with experiments. However, the FmmPnma transition is predicted to occur at only 7 GPa, and only by increasing to 5.5 eV for the phase can one find a value of 40 GPa, which is in good agreement with experiment. This finding is also in good agreement with a recent theoretical study Geng . At ambient pressure, a transition temperature of 2069 K between the two solid structures is firstly obtained by the Debye model. The mechanical properties and the Debye temperature of the fluorite phase have been observed to increase linearly with the pressure, by calculating the elastic constants. As a result, the melting temperature also increases linearly with the pressure. Phonon dispersion results of the Fmm phase are in good agreement with available experimental values. The LO-TO splitting at the point is successfully reproduced by including the polarization effects. For the cotunnite phase, the imaginary mode along the - direction and soft phonon mode along the - direction have been found at the equilibrium volume. The cotunnite to fluorite transition can be reached by firstly slipping the adjacent (100) planes relatively along the [001] direction to create a face-centered orthorhombic structure and secondly expanding the cell along the [010] direction and shrinking in the vertical directions to form the fcc fluorite structure. Using the QHA and the Debye model, we have calculated the Gibbs free energy, temperature dependences of lattice parameter and bulk modulus, entropy, specific heat, and phase diagram of UO2. Given the importance of this material as nuclear fuel we expect these results to be useful for further theoretical and experimental investigations.
Acknowledgements.
This work was supported by NSFC under Grant No. 11104170, No. 51071032, and No. 11074155, and by the Foundations for Development of Science and Technology of China Academy of Engineering Physics under Grant No. 2009B0301037. O.E. acknowledges support from the Swedish research council, the KAW foundation, ESSENCE, STANDUPP, and the ERC (Project No. 247062-ASD).References
- (1) J. Schoenes, Phys. Rep. 63, 301 (1980).
- (2) Y. Baer and J. Schoenes, Solid State Commun. 33, 885 (1980).
- (3) M. Idiri, T. Le Bihan, S. Heathman, and J. Rebizant, Phys. Rev. B 70, 014113 (2004).
- (4) S. W. Yu, J. G. Tobin, J. C. Crowhurst, S. Sharma, J. K. Dewhurst, P. Olalde Velasco, W. L. Yang, and W. J. Siekhaus, Phys. Rev. B 83, 165102 (2011).
- (5) J. G. Tobin and S. W. Yu, Phys. Rev. Lett. 107, 167406 (2011).
- (6) Y. Q. An, A. J. Taylor, S. D. Conradson, S. A. Trugman, T. Durakiewicz, and G. Rodriguez, Phys. Rev. Lett. 106, 207402 (2011).
- (7) M. S. S. Brooks and P. J. Kelly, Solid State Commun. 45, 689 (1983).
- (8) S. L. Dudarev, M. R. Castell, G. A. Botton, S. Y. Savrasov, C. Muggelberg, G. A. D. Briggs, A. P. Sutton, and D. T. Goddard, Micron 31, 363 (2000).
- (9) C. E. Boettger and A. K. Ray, Int. J. Quantum Chem. 90, 1470 (2002).
- (10) K. N. Kudin, G. E. Scuseria, and R. L. Martin, Phys. Rev. Lett. 89, 266402 (2002).
- (11) I. D. Prodan, G. E. Scuseria, and R. L. Martin, Phys. Rev. B 76, 033101 (2007).
- (12) Q. Yin and S. Y. Savrasov, Phys. Rev. Lett. 100, 225504 (2008).
- (13) L. Petit, A. Svane, Z. Szotek, W. M. Temmerman, and G. M. Stocks, Phys. Rev. B 81, 045108 (2010).
- (14) P. Zhang, B.-T. Wang, and X.-G. Zhao, Phys. Rev. B 82, 144110 (2010).
- (15) H. Y. Geng, H. X. Song, K. Jin, S. K. Xiang, and Q. Wu, Phys. Rev. B 84, 174115 (2011).
- (16) P. Santini, S. Carretta, G. Amoretti, R. Caciuffo, N. Magnani, and G. H. Lander, Rev. Mod. Phys. 81, 807 (2009).
- (17) B. T. Wang, H. Shi, W. D. Li, and P. Zhang, Phys. Rev. B 81, 045119 (2010).
- (18) M. Colarieti-Tosti, O. Eriksson, L. Nordstrom, J. M. Wills, and M. S. S. Brooks, Phys. Rev. B 65, 195102 (2002).
- (19) Q. Yin, A. Kutepov, K. Haule, G. Kotliar, S. Y. Savrasov, and W. E. Pickett, Phys. Rev. B 84, 195111 (2011).
- (20) J. P. Dancausse, E. Gering, S. Heathman, and U. Benedict, High Press. Res. 2, 381 (1990).
- (21) S. M. Dorfman, F. Jiang, Z. Mao, A. Kubo, Y. Meng, V. B. Prakapenka, and T. S. Duffy, Phys. Rev. B 81, 174121 (2010).
- (22) H. Y. Geng, Y. Chen, Y.Kaneta, and M. Kinoshita, Phys. Rev. B 75, 054111 (2007).
- (23) B. T. Wang, H, Shi, W. D. Li, and P. Zhang, J. Nucl. Mater. 399, 181 (2010).
- (24) D. Manara, C. Ronchi, M. Sheindlin, M. Lewis, and M. Brykin, J. Nucl. Mater. 342 148 (2005).
- (25) F. Birch, Phys. Rev. 71, 809 (1947).
- (26) D. A. Andersson, J. Lezama, B. P. Uberuaga, C. Deo, and S. D. Conradson, Phys. Rev. B 79, 024110 (2009).
- (27) T. Yamashita, N. Nitani, T. Tsuji, and H. Inagaki, J. Nucl. Mater. 247, 90 (1997).
- (28) S. L. Dudarev, D. N. Manh, and A. P. Sutton, Philos. Mag. B 75, 613 (1997).
- (29) S. L. Dudarev, G. A. Botton, S. Y. Savrasov, C. J. Humphreys, and A. P. Sutton, Phys. Rev. B 57, 1505 (1998).
- (30) G. Kresse and J. Furthmüller, Phys. Rev. B 54, 11169 (1996).
- (31) P. E. Blöchl, Phys. Rev. B 50, 17953 (1994).
- (32) W Kohn, L J Sham, Phys. Rev. 140 (1965) A1133.
- (33) J. P. Perdew, K. Burke, and Y. Wang, Phys. Rev. B 54, 16533 (1996).
- (34) H. J. Monkhorst and J. D. Pack, Phys. Rev. B 13, 5188 (1972).
- (35) A. I. Liechtenstein, V. I. Anisimov, and J. Zaanen, Phys. Rev. B 52, R5467 (1995).
- (36) I. D. Prodan, G. E. Scuseria, and R. L. Martin, Phys. Rev. B 73, 045104 (2006).
- (37) I. D. Prodan, G. E. Scuseria, J. A. Sordo, K. N. Kudin, and R. L. Martin, J. Chem. Phys. 123, 014703 (2005).
- (38) C. E. Boettger and A. K. Ray, Int. J. Quantum Chem. 80, 824 (2000).
- (39) M. Sanati, R. C. Albers, T. Lookman, A. Saxena, Phys. Rev. B 84, 014116 (2011).
- (40) Elk is an all-electron full-potential linearized augmented plane wave with local orbitals [FP-(L)APW+lo] code, avalailable free of charge at http://elk.sourceforge.net.
- (41) R. Hill, Phys. Phys. Soc. London 65, 349 (1952).
- (42) M. E. Fine, L. D. Brown, and H. L. Marcus, Scr. Metall. 18, 951 (1984).
- (43) K. Parlinski, Z-.Q. Li, and Y. Kawazoe, Phys. Rev. Lett. 78, 4063 (1997).
- (44) A. Togo, F. Oba, and I. Tanaka, Phys. Rev. B 78 (2008) 134106.
- (45) A. Siegel, K. Parlinski, and U. D. Wdowik, Phys. Rev. B 74, 104116 (2006).
- (46) A. A. Blanco, E. Francisco, and V. Luana, Comput. Phys. Commun. 158 (2004) 57.
- (47) F. Zhou and V. Ozolins, Phys. Rev. B 83, 085106 (2011).
- (48) B. C. Frazer, G. Shirane, D. E. Cox, and C. E. Olsen, Phys. Rev. 140, A1448 (1965).
- (49) R. Laskowski, G. K. H. Madsen, P. Blaha, and K. Schwarz, Phys. Rev. B 69, 140408(R) (2004).
- (50) J. Faber and G. H. Lander, Phys. Rev. B 14, 1151 (1976).
- (51) X. D. Wen, R. L. Martin, L. E. Roy, G. E. Scuseria, S. P. Rudin, E. R. Batista, T. M. McCleskey, B. L. Scott, E. Bauer, J. J. Joyce, and T. Durakiewicz, J. Chem. Phys. 137, 154707 (2012).
- (52) I. J. Fritz, J. Appl. Phys. 47, 4353 (1976).
- (53) S. L. Dudarev, G. A. Botton, S. Y. Savrasov, Z. Szotek, W. M. Temmerman, and A. P. Sutton. Phys Status Solidi, 166 429 (1998).
- (54) A. J. Devey, J. Nucl. Mater. 412, 301 (2011).
- (55) G. Dolling, R. A. Cowley, and A. D. B. Woods, Can. J. Phys. 43, 1397 (1965).
- (56) J. W. L. Pang, W. J. L. Buyers, A. Chernatynskiy, M. D. Lumsden, B. C. Larson, and S. R. Phillpot, Phys. Rev. Lett. 110, 157401 (2013).
- (57) T. Livneh and E. Sterer, Phys. Rev. B 73, 085118 (2006).
- (58) T. Livneh, J. Phys.: Condens. Matter 20, 085202 (2008).
- (59) P. Goel, N. Choudhury, and S. L. Chaplot, J. Nucl. Mater. 377, 438 (2008).
- (60) Y. Yun, D. Legut, P. M. Oppeneer, J. Nucl. Mater. 426, 109 (2012).
- (61) D. Taylor, Br. Ceram. Trans. J. 83, 32 (1984).
- (62) International Nuclear Safety Centre (INSC), Material Properties Database, Argonne National Laboratory, Illinois, USA, http://www.insc.anl.gov/matprop/.
- (63) T. Arima, K. Idemitsu, Y. Inagaki, Y. Tsujita, M. Kinoshita, and E. Yakub, J. Nucl. Mater. 389, 149 (2009).
- (64) F. Grønvold, N. J. Kveseth, A. Sveen, and J. Tichý, J. Chem. Thermodyn. 2, 665 (1970).
- (65) J. J. Huntzicker and E. F. Westrum, J. Chem. Thermodyn. 3, 61 (1971).
- (66) C. Kittel, Introduction to Solid State Physics, 7th ed. (Wiley, New York, 1996).