Revealing velocity dispersion as the best indicator of a galaxy’s color, compared to stellar mass, surface mass density or morphology
Abstract
Using data of nearby galaxies from the Sloan Digital Sky Survey we investigate whether stellar mass (Mstar), central velocity dispersion (), surface mass density (), or the Sersic parameter is best correlated with a galaxy’s rest-frame color. Specifically, we determine how the mean color of galaxies varies with one parameter when another is fixed. When Mstar is fixed we see that strong trends remain with all other parameters, whereas residual trends are weaker when , , or are fixed. Overall is the best indicator of a galaxy’s typical color, showing the largest residual color dependence when any of the other three parameters are fixed, and Mstar is the poorest. Other studies have indicated that both the halo and black hole properties are better correlated with than with Mstar, or . Therefore, our results are consistent with a picture where a galaxy’s star formation history and present star formation rate are determined to some significant degree by the current properties and assembly history of its dark matter halo and/or the feedback from its central super massive black hole.
Subject headings:
galaxies: fundamental parameters — galaxies: formation — galaxies: kinematics and dynamics — galaxies: statistics1. Introduction
It is well established that the stellar populations of galaxies in the nearby Universe correlate with their luminosities and masses, such that the stars in more massive galaxies are on average older and more metal-rich (e.g., Bower et al., 1992; Blanton et al., 2003a; Kauffmann et al., 2003). The old ages of the most luminous galaxies are somewhat puzzling, as it implies that there must be some mechanism responsible for shutting off their star formation (e.g., Kauffmann & Haehnelt, 2000; Croton et al., 2006; Naab et al., 2007; Kereš et al., 2005). Another puzzle is that the correlation between star formation history and mass is complex: low mass galaxies are typically younger and high mass galaxies are typically older, with a bimodal transition region at (Kauffmann et al., 2003). This bimodality and the associated transition mass scale have been the subject of intense debate in the past years (e.g., Bundy et al., 2006; Peng et al., 2010; Brammer et al., 2011).
An intriguing possibility is that luminosity and mass are not the “right” parameters to interpret galaxy evolution, and that there exist other parameters that show more straightforward correlations with stellar population parameters. As demonstrated by Kauffmann et al. (2003, 2006), the star formation histories of galaxies show less scatter when the structure of galaxies is taken into account. In particular, the ages and star formation rates of galaxies are better correlated with their surface densities (which is proportional to with the size of the galaxy) than with mass alone. Franx et al. (2008) find that the strong correlation between color and (and ) persists all the way to . Similar trends have been found for velocity dispersion and for the Sersic (1968) index (e.g., Blanton et al., 2003a; Bell, 2008; Wuyts et al., 2011; van Dokkum et al., 2011; Bell et al., 2011).
Although it seems clear that the correlation between color and mass is weaker than the correlations between color and , , or , it is not clear which of these parameters is the best predictor of a galaxy’s color. This is important to establish as it provides information on the physical processes that govern galaxy evolution. As an example, if best correlates with color (as suggested by Bell et al., 2011) it may imply that the merger history determines the star formation history, whereas if is the key parameter it would suggest that the star formation history is influenced (or even determined) by the dark matter halo or the central supermassive black hole.
In this Letter we investigate which of the four parameters Mstar, , , or is most closely correlated with the star formation history, as parameterized by the color. We determine this by fixing each parameter in turn and measuring to what extent the color depends on the other three parameters. The homogeneous, large datasets required for this study are now available from the 7th data release of the Sloan Digital Sky Survey (SDSS DR7; Abazajian et al., 2009).
2. Data
The galaxy data used in this analysis are gathered from the seventh data release of the SDSS (Abazajian et al., 2009). We begin with the Large Scale Structure samples of the DR7 NYU Value Added Galaxy catalogue (VAGC Blanton et al., 2005). The sample we use has an band magnitude range of . In addition the NYU VAGC gives k-corrected (to z=0.1) absolute magnitudes (Blanton et al., 2003a), velocity dispersion measurements from the Princeton Spectroscopic pipeline, and circularized sersic fits for each galaxy all of which we make use of in this analysis.
For estimates of the stellar mass we make use of the MPA/JHU DR7 value added catalog which provides stellar mass estimates based on stellar population fits to the SDSS photometry (Kauffmann et al., 2003; Salim et al., 2007). The overlap between the MPA/JHU and NYU VAGs is close to but to quite 100% and so we remove the regions where they do not match from the analysis. We also remove any region of the survey that has a spectroscopic completeness less than 70%. This leaves an area of 7640 deg2 and a total sample of 521,313 galaxies.
The SDSS velocity dispersions are measured within the 3” diameter SDSS fiber. We correct to a common aperture of one eighth of an effective radius (), the central velocity dispersion, using the relation where = 1.”5 (Cappellari et al., 2006). is taken from the best fitting circularized Sersic profile fit.
Throughout we use color from the -corrected NYU VAGC absolute magnitudes. As already stated these are corrected to ; although they are not quite at rest we will refer to them as colors. We also make use of the morphological classifications from Galaxy Zoo (Lintott et al., 2011) which provides multiple visual classifications for each galaxy in the SDSS spectroscopic sample. The parameter we use is the probability that a galaxy is an edge on disk () (see Lintott et al., 2011, for details).
3. Dependence of color on Mstar, , , and

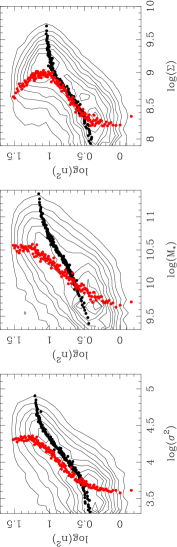
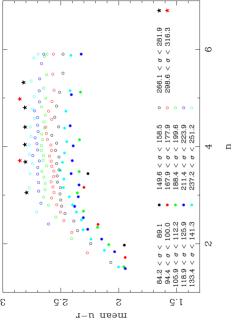
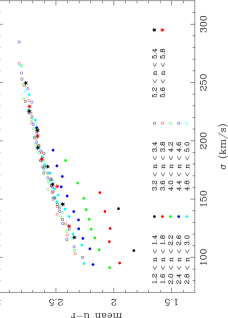
We wish to understand how the typical color of a galaxy depends on its stellar mass, central velocity dispersion, surface mass density, and Sersic profile. We begin in Figure 1 were we show the color distribution for all SDSS galaxies with 0.02 0.11 as a function of each parameter. We have applied to this figure (and all subsequent figures) a V/Vmax weight for each galaxy to correct for the varying stellar mass completeness limit with redshift. We plot the color distributions as a function of log(Mstar), log(), log(2) and log().
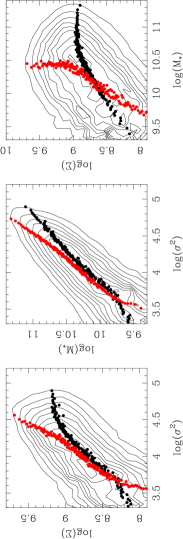
We have chosen these units as they are all approximately linearly proportional to one an other. This is illustrated in Figure 2 were we show the relationships between these four parameters. The contours show the full distributions and the points show the mean of in bins of (black) and in bins of (red). Whilst we may expect and 2 to be approximately linearly proportional to Mstar and each other, we find that shows the same trends over a broad range in those parameters. Therefore we can meaningfully compare the predictive power of to that of the other three parameters.
Figure 1 shows that there is a clear color dependence on each parameter but with significant scatter. It also illustrates, as has been previously found (e.g., Kauffmann et al. 2003), that Mstar is a relatively poor discriminator of a galaxy’s color, particularly around the “transition mass” of . It is important to note that distributions become noisy at both low Mstar and low . The number of galaxies becomes increasing small at low masses, due to the apparent magnitude limit of the SDSS, which also strongly affects the sample at low due to the tight correlation between the two parameters. measurements also become more uncertain below 65 km/s due to the resolution of the SDSS spectra. For these reasons we limit the remainder of the analysis to galaxies with Mstar and 65 km/s.
We also remove edge on disk galaxies from our sample to minimize the influence of dust on our measurements (e.g., Patel et al., 2011), although we expect the dust contribution to be low in the local universe. We make a cut using the Galaxy Zoo parameter limiting it to be 0.3. We note that this cut changes our results very little and has no effect on any of our conclusions.
4. Which parameter correlates best with color?
In order to determine which parameter shows the strongest correlation with color we determine whether there remains any color dependence on Mstar, , , and when each of these parameters are held fixed. We divide our parent sample ( 0.02 0.11, Mstar , 65 km/s, 0.3) into a series of samples selected to have narrow ranges in each parameter. We select bins of 0.05 in log(Mstar) and log(), 0.025 in log() and 0.2 in . We then calculate the mean color of galaxies in each of these narrow binned samples as of function of the other three parameters, where the mean is calculated in bins of 300 galaxies.
4.1. Residual Correlations
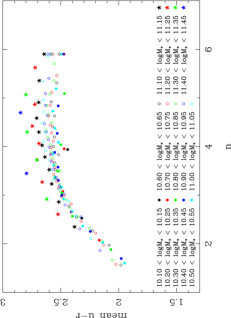
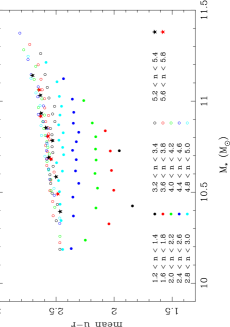
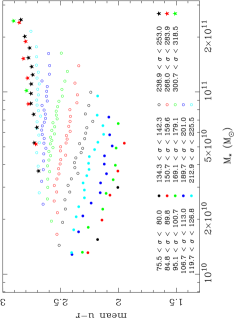
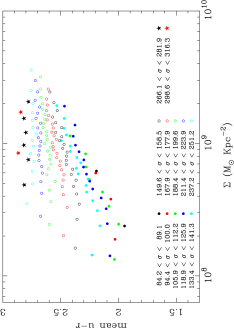
We show the resulting relationships between mean color and Mstar, , and in Figures 3 and 4. Each row shows a pair of parameters with the binning and abscissa parameter switched. That is, in each row the left panel shows the effect of varying parameter 1 at fixed parameter 2, and the right panel shows the effect of varying parameter 2 at fixed parameter 1. The left and right panel therefore essentially show the same information, but highly the trends in a complimentary way. If the trends of all of the binned samples lie on top of each other in any of the plots it would mean that the color would be independent of the parameter used for the binning. Similarly, if the abscissa parameter is unimportant each of the individual binned trends will be flat.
Turning to the first pair of parameters at the top of Figure 3, and Mstar, we can see something close to this extreme situation. When Mstar is held fixed (left panel) there remains a clear trend with , such that higher galaxies are redder. The trend is particularly strong at low Mstar and gradually decreases at the highest masses, resulting in some spread but a generally low dispersion between the Mstar bins. The same trend is visible when is held fixed; there is only a very weak dependence of mean color on Mstar with more massive galaxies being redder. The individual bins are well separated, showing the strong color dependence on , and are generally parallel. It appears that is a better indicator of a galaxy’s color than its stellar mass is.
We next consider Mstar and , shown in the middle panel of Figure 3. For low ( 2.5) there is a strong dependence of the color on at fixed Mstar, but for higher the trends with Mstar are all the same with no dependence. At all there is a trend for more massive galaxies to be redder on average, although this is very weak for galaxies with log(Mstar) 11. Again Mstar appears a poorer indicator of a galaxies color than , although this is less true at high or high Mstar.
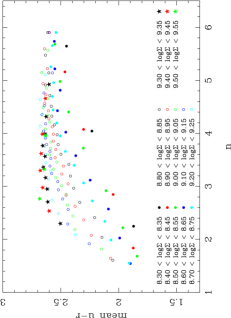
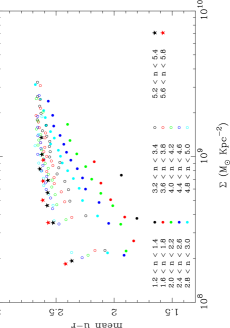
The bottom panels of Figure 3 concern and . At low there is a very strong relationship between color and with higher galaxies being redder. Whilst this trend remains for all the slope of this correlation reduces as increases. There is a similar dependence of color on at fixed , although the relation becomes very weak at the highest .
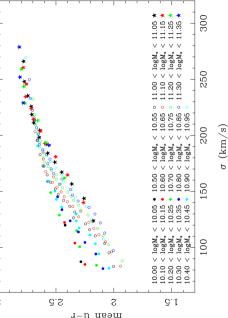
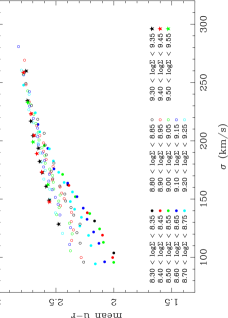
In Figure 4 we show how the color depends on at fixed Mstar, , and on the left and how color depends on Mstar, , and at fixed on the right. It is striking how tight all of the trends are in the left panels and how separated they are in the right panels. This indicates that the mean galaxy color is more strongly dependent on than Mstar, or . This is particularly true at ( 200 km/s) where all the trends lie almost completely on top of each other on the left and are very close to flat on the right. At lower interesting trends emerge; perhaps surprisingly the mean color becomes bluer as Mstar increases, with this trend increasing as decreases. This probably reflects an increasing disk component in more massive galaxies at fixed . At low (175 km/s) a trend emerges with such that galaxies with higher at fixed have redder colors, with the trend becoming more significant as decreases. There is also a trend with when 2.5 such that galaxies with higher are redder. There is no color dependence on at fixed for higher galaxies. Whilst some trends with Mstar, and emerge in some regions of the parameter space there is always a strong dependence of the mean color on over the full range of the other parameters.
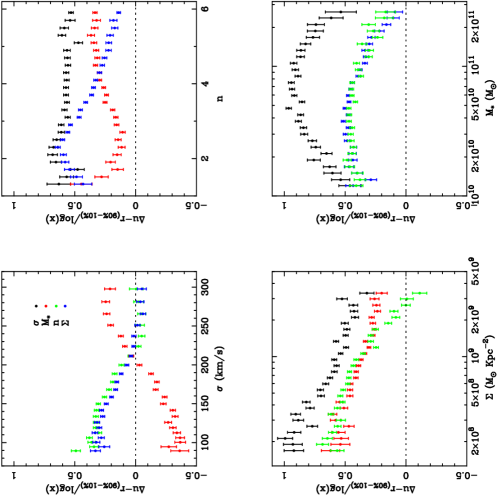
4.2. Quantifying the Residual Correlations
We show in Figure 5 an attempt to both simplify and quantify the trends that are displayed in Figures 3 and 4. In narrow bins of one parameter we calculate the difference in the mean color of the galaxies lying in the lowest and highest 10 percentiles of the other three parameters. Since the size of the range of the second parameter may vary with the first and between the different parameters we calculate this color difference per unit log(Mstar), log(), log(2) and log(). For example the blue points in the top left panel of 5 show the difference between the mean color of galaxies with the 10% highest and 10% lowest per unit log() in narrow bins of . This is essentially the vertical scatter in the center left panel of Figure 4 or the gradient of the individual trends in the center right panel.
The color gradients shown in Figure 5 reinforce the conclusions we have already drawn. When is fixed (top left panel) the magnitude of the color gradient is always less than 0.5, showing that there is only a weak dependence of color on Mstar, or at constant . This is particularly true at high ( 200 km/s) where the gradient is essentially zero for both and . When the other three parameters are held fixed the color gradient with is always the largest and is greater than 0.5 regardless of the values of the other parameters. Clearly there is a significantly larger dependence of the color of galaxies on than on Mstar, or .
Figure 5 again confirms the negative color gradients with Mstar at low (red points in top left panel), such that more massive galaxies are bluer when is fixed. We also see negative color gradients with for the highest galaxies. Otherwise it is always the case that galaxies with higher Mstar or are redder, and always the case that galaxies with higher or are redder when the other parameters are fixed.
5. Discussion
The central result of this paper is that the colors of galaxies depend more strongly on than on Mstar, , or . We have demonstrated this by examining, for each of these parameters, how strong residual correlations with the other three parameters are when the parameter under consideration is held fixed. At fixed residual trends with other parameters are weak, and when any of the other parameters is fixed there are strong residual trends with .
Recently Bell et al. (2011) studied how the fraction of passive (i.e., not star-forming) galaxies depends on a similar set of parameters and reached the conclusion that was the best indicator of the passive fraction. This seems to be at odds with our findings where shows the strongest color trends. The difference may stem from the fact that Bell et al. (2011) use Mstar/ to approximate velocity dispersion. Whilst there is a correlation between and Mstar/, which is improved if corrections based on are applied (Taylor et al., 2010), there is significant scatter (0.1 dex). This may be the cause of our differing conclusions and illustrate the importance of directly measured dynamical properties.
Our results, and those of others (e.g., Kauffmann et al., 2003; Franx et al., 2008; van Dokkum et al., 2011; Bell et al., 2011), call into question whether “mass quenching” (e.g., Peng et al., 2010) and other mass-driven effects are actually manifestations of underlying trends with velocity dispersion. The velocity dispersion may in turn reflect a yet more fundamental parameter. It is known to correlate well with central black hole mass (e.g., Ferrarese & Merritt, 2000; Gebhardt et al., 2000) and also with the properties of dark matter halos (Wake et al., 2012). Taken together, all these results suggest a simple scenario where the mass of the dark matter halo determines both the central black hole mass and the star formation history of galaxies.
This study can be extended and improved in many ways. The dispersions are currently corrected to a common aperture with reasonable assumptions, but it would be very useful to measure radial trends in dispersion in a systematic way. This is particularly relevant for low mass galaxies and star forming galaxies, as they have significant disks which presumably dominate at large radii. Blue disks may well be the cause of the peculiar fact that, at low , more massive galaxies are bluer at fixed dispersion (see Fig. 4). Modeling of the effects of various physical processes (such as merging) on the velocity dispersion may help us understand why velocity dispersion is so well correlated with many aspects of galaxies. One possibility is that may well be indicating both the halo mass (or other halo properties), in a similar or more precise manner than Mstar (Wake et al., 2012), and at the same time be an indicator of the relative bulge to disk components. So at fixed Mstar a higher galaxy has a larger bulge to disk ratio and so is redder, whereas at fixed a higher galaxy typically occupies a more massive dark matter halo and so is also redder. is then the best of the four parameters at encapsulating both color dependences (halo mass and bulge to disk ratio) as illustrated by the tightness of the - Mstar and - relations shown in Figure 2.
References
- Abazajian et al. (2009) Abazajian, K. N., et al. 2009, ApJS, 182, 543
- Blanton et al. (2003a) Blanton, M. R., et al. 2003, AJ, 125, 2348
- Blanton et al. (2003b) Blanton, M. R., Hogg, D. W., Bahcall, N. A., et al. 2003, ApJ, 594, 186
- Blanton et al. (2005) Blanton, M. R., et al. 2005, AJ, 129, 2562
- Blanton & Roweis (2007) Blanton, M. R., & Roweis, S. 2007, AJ, 133, 734
- Bell (2008) Bell, E. F. 2008, ApJ, 682, 355
- Bell et al. (2011) Bell, E. F., van der Wel, A., Papovich, C., et al. 2011, arXiv:1110.3786
- Bezanson et al. (2011) Bezanson, R., van Dokkum, P. G., Franx, M., et al. 2011, ApJ, 737, L31
- Bower et al. (1992) Bower, R. G., Lucey, J. R., & Ellis, R. S. 1992, MNRAS, 254, 601
- Brammer et al. (2011) Brammer, G. B., Whitaker, K. E., van Dokkum, P. G., et al. 2011, ApJ, 739, 24
- Bundy et al. (2006) Bundy, K., Ellis, R. S., Conselice, C. J., et al. 2006, ApJ, 651, 120
- Cappellari et al. (2006) Cappellari, M., et al. 2006, MNRAS, 366, 1126
- Croton et al. (2006) Croton, D. J., Springel, V., White, S. D. M., et al. 2006, MNRAS, 365, 11
- Ferrarese & Merritt (2000) Ferrarese, L., & Merritt, D. 2000, ApJ, 539, L9
- Franx et al. (2008) Franx, M., van Dokkum, P. G., Schreiber, N. M. F., et al. 2008, ApJ, 688, 770
- Gebhardt et al. (2000) Gebhardt, K., Bender, R., Bower, G., et al. 2000, ApJ, 539, L13
- Kauffmann & Haehnelt (2000) Kauffmann, G., & Haehnelt, M. 2000, MNRAS, 311, 576
- Kauffmann et al. (2003) Kauffmann, G., et al. 2003, MNRAS, 341, 33
- Kauffmann et al. (2006) Kauffmann, G., Heckman, T. M., De Lucia, G., et al. 2006, MNRAS, 367, 1394
- Kereš et al. (2005) Kereš, D., Katz, N., Weinberg, D. H., & Davé, R. 2005, MNRAS, 363, 2
- Lintott et al. (2011) Lintott, C., et al. 2011, MNRAS, 410, 166
- Naab et al. (2007) Naab, T., Johansson, P. H., Ostriker, J. P., & Efstathiou, G. 2007, ApJ, 658, 710
- Patel et al. (2011) Patel, S. G., Holden, B. P., Kelson, D. D., et al. 2011, arXiv:1107.3147
- Peng et al. (2010) Peng, Y.-j., Lilly, S. J., Kovač, K., et al. 2010, ApJ, 721, 193
- Salim et al. (2007) Salim, S., et al. 2007, ApJS, 173, 267
- Sersic (1968) Sersic, J. L. 1968, Atlas de galaxias australes, Cordoba, Argentina: Observatorio Astronomico
- Taylor et al. (2010) Taylor, E. N., Franx, M., Brinchmann, J., van der Wel, A., & van Dokkum, P. G. 2010, ApJ, 722, 1
- van Dokkum et al. (2011) van Dokkum, P. G., Brammer, G., Fumagalli, M., et al. 2011, ApJ, 743, L15
- Wake et al. (2012) Wake, D. A., Franx, M., & van Dokkum, P. G. 2012, arXiv:1201.1913
- Wuyts et al. (2011) Wuyts, S., Förster Schreiber, N. M., van der Wel, A., et al. 2011, ApJ, 742, 96