The surface detector array of the Telescope Array experiment
Abstract
The Telescope Array (TA) experiment, located in the western desert of Utah, USA, is designed for observation of extensive air showers from extremely high energy cosmic rays. The experiment has a surface detector array surrounded by three fluorescence detectors to enable simultaneous detection of shower particles at ground level and fluorescence photons along the shower track. The TA surface detectors and fluorescence detectors started full hybrid observation in March, 2008. In this article we describe the design and technical features of the TA surface detector.
keywords:
Ultra-high energy cosmic rays; Telescope Array experiment; Extensive air shower array1 Introduction
The main aim of the Telescope Array (TA) experiment [1] is to explore the origin of ultra high energy cosmic rays (UHECR) using their energy spectrum, composition and anisotropy. There are two major methods of observation for detecting cosmic rays in the energy region above 1017.5 eV. One method which was used at the High Resolution Fly’s Eye (HiRes) experiment is to detect air fluorescence light along air shower track using fluorescence detectors. The other method, adopted by the AGASA experiment, is to detect air shower particles at ground level using surface detectors deployed over a wide area (100 km2).
The AGASA experiment reported that there were 11 events above 1020 eV in the energy spectrum [2, 3]. However, the existence of the GZK cutoff [4, 5] was reported by the HiRes experiment [6]. The Pierre Auger experiment confirmed the suppression on the cosmic ray flux at energy above 41019 eV [7] using an energy scale obtained by fluorescence light telescopes (FD). The contradiction between results from fluorescence detectors and those from surface detector arrays (SD) remains to be investigated by having independent energy scales using both techniques. Hybrid observations with SD and FD enable us to compare both energy scales. Information about core location and impact timing from SD observation improves accuracy of reconstruction of FD observations. Observations with surface detectors have a nearly 100% duty cycle, which is an advantage especially for studies of anisotropy. Correlations between arrival directions of cosmic rays and astronomical objects in this energy region should give a key to exploring the origin of UHECR [8] and their propagation in the galactic magnetic field.
In this article we describe the design and technical features of the TA surface detector.
2 Telescope Array experiment
The TA site is located in the desert about 1400 m above sea level centered at N and W in Millard County, Utah, USA, about 200 km southwest of Salt Lake City. A control center to support construction and operation of the TA instruments is in the city of Delta located near the northeast side of the array. The experiment is aimed at observing cascade showers induced by cosmic rays above 1019 eV. The altitude of the experimental site is optimal for observing particle showers at nearly maximum development of the cascade. For hybrid observation the site also needed to be located in a semi-desert area with less light pollution from the town. The dry climate allows us to have a high duty cycle for FD-SD hybrid exposure; about 10% of real time.
Below we describe the major advantages of the TA experiment:
1) The TA experiment utilizes plastic scintillators similar to AGASA
experiment. For energies of about 1020 eV, more than 90%
of the primary energy is absorbed as the electromagnetic component (,
and ) in the air. Plastic scintillators are sensitive to all charged
particles, and the energy measurement is less affected by the difference of the details of
unknown hadron interactions and the primary composition.
2) The HiRes-I telescope system was partially moved to the Middle Drum
(MD) hill in TA site and installed as one of the three FD stations
after the HiRes experiment was shut down in 2006 [9].
Using an energy spectrum obtained with MD station data,
it is possible to cross-check the new TA FD data and analysis method.
The surface detector observes lateral distribution of the shower particle.
Energy deposition at a certain distance from shower core is used as an
estimator of the energy by comparing with air shower Monte Carlo
simulation. It is possible to compare the estimated energy with that
obtained from longitudinal shower development observed by FD data analysis.
3) In addition to the conventional calibration and monitor system, we
plan to perform absolute end-to-end calibration of a fluorescence telescope
by using pseudo air shower events that are induced by electron beams with
known total energy from a compact electron linear accelerator at the TA
site [10, 11].
As described above, the TA experiment is well-balanced to
determine the energy of air shower events.
4) The anisotropy of arrival directions of ultra-high energy cosmic
rays is being studied in the northern hemisphere where the effect of
the galactic magnetic field is smaller than that in the southern
hemisphere. A typical angular resolution of TA SD array is
better than 1.5∘ for the shower above 10 EeV [12].
3 Surface detector array
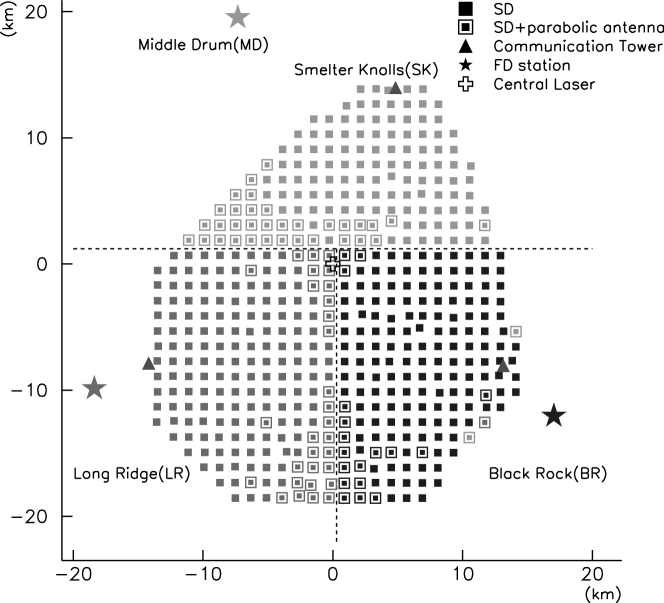
The SD array consists of 507 detector units, which were deployed in a square grid with 1.2 km spacing to cover a total area of approximately 700 km2. Fig. 1 shows a layout of the TA experiment. Each surface detector has a plastic scintillation counter of 3 m2 in size, and transmits SD data via a wireless LAN modem. As shown in Fig. 1, the SD array is divided into three subarrays each controlled by its trigger-decision electronics at the communication tower. The Long Ridge (LR), Black Rock (BR), and Smelter Knolls (SK) subarrays have 189, 170 and 148 SDs respectively. (The numbers of SDs in LR , BR and SK from March 2008 to November 2009 were 207, 190 and 110 respectively.) All detectors are powered by solar panels and batteries [13]. For events with energies beyond 1019 eV and with zenith angles below 45 degrees, the trigger efficiency reaches 100% and the aperture is 1100 km2sr. The observed energy region for the TA experiment has sufficient overlap with those for the previous experiments of UHECR.
3.1 Surface detector
The TA detector will operate for more than 10 years and must be designed to survive the expected conditions at the site. The detector must be robust and durable for long-term exposure to the desert environment where the detector temperature ranges from C to C with large diurnal variations. And the system requires detailed monitoring and periodic calibrations to track variations of detector response along time.
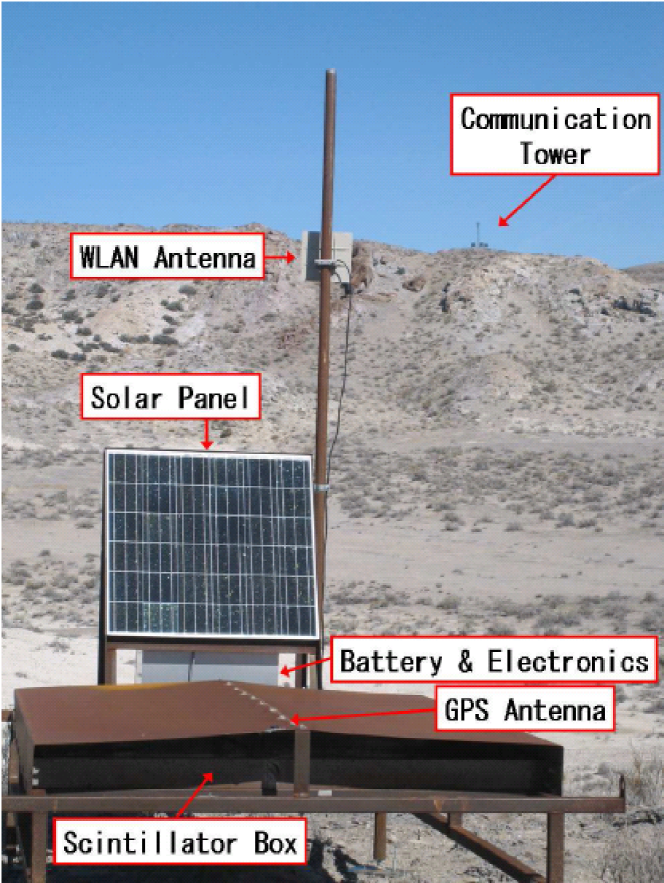
Fig. 2 shows one of the deployed SDs that communicate with the communication tower placed at Smelter Knolls (SK), a nearby hill. A communication antenna (ADAF2414; ADTEC Co.) with adjustable height is mounted on a 3-m long iron pole. A square solar panel 1 m on one side is mounted on the platform to supply power to the electronics. Front-end electronics and a battery are contained in a box made with 1.2 mm thick stainless steel. The box is mounted under the solar panel. The box that contains the scintillators and photomultiplier tubes (PMTs) is mounted under the 1.2-mm thick iron roof to protect the detector from large temperature variations.
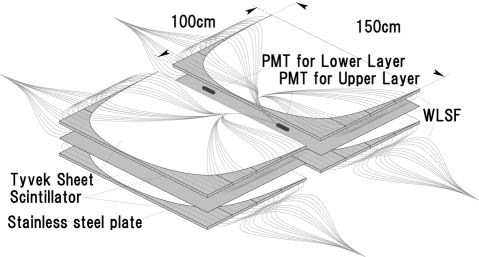
Fig. 3 shows a schematic of the inside of a scintillator box. Each surface detector consists of two layers of plastic scintillator. Each layer of scintillator has an area of 3 m2 and a thickness of 1.2 cm. A Stainless-steel plate has 1 mm in thickness and is inserted between the layers. As shown in Fig. 3, each scintillator layer consists of 2 segments, and each segment consists of 4 slabs. The size of one segment is 1.5 m 1.0 m. The size of each slab is 1.5 m 0.25 m and thickness is 1.2 cm. On top side of the scintillator slab, there are grooves in parallel along the length of the slab. The span of grooves is 2.0 cm and the depth is 1.5 mm. Scintillation light is collected through 104 wavelength-shifting (WLS) fibers (Y-11; Kuraray Co. Ltd.) that are laid along each groove. Total length of a WLS fiber is 5 m. The fibers are put in the grooves on the surfaces of the scintillator slabs without oil and grease, and are fixed at both edges of the slabs with tape (polyester tape #850 silver; 3M). The segment is wrapped with two layer of Tyvek (1073B; Dupont Co.) sheet. Both ends of the fibers from a layer are bundled together and connected to a PMT (9124SA; Electron Tubes Ltd.).
Each PMT is calibrated to obtain the relation of high voltage and gain. Linearity between input light amount and output charge is also obtained in the calibration [15]. Two LEDs (NSPB320BS; Nichia Corp.) are also installed on the side of each layer to calibrate linearity of output for input light. Scintillator plates and PMTs are contained in a 1.5 mm thick box made of stainless steel (top cover is 1.5 mm thick, with a 1.2 mm thick bottom) (TAITO Co. Ltd.).
3.2 Detector Electronics
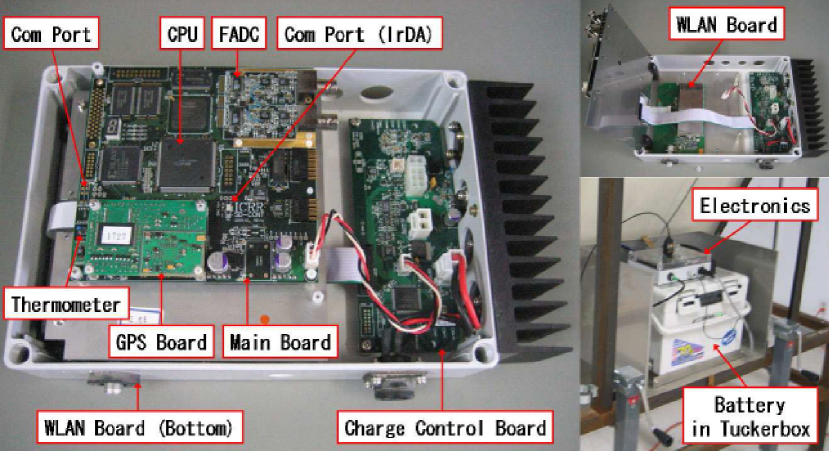
Fig. 4 shows the detector electronics for a scintillator counter installed in a stainless-steel box under the solar panel. The output signals from PMTs are digitized by a 12bit FADC (AD9235RU- 65; Analog Devices Co.) with a 50 MHz sampling rate on the CPU board (SH4; Renesas Electronics Co.). Signals greater than approximately 0.3 minimum ionizing particles (MIP) are stored in a memory buffer on CPU board as Level-0 trigger data. The stored waveform is 2.56 sec long (128 FADC bins). Signals greater than 3.0 MIP are stored as a Level-1 trigger event, which are sent to the trigger-decision electronics at the communication tower for the subarray via a wireless LAN modem (ADLINK540F; ADTEC. Co) using a custom-made communication protocol [16]. The local trigger rates are 750 Hz for the Level-0 trigger and 30 Hz for the Level-1 trigger. In FPGA, the FADC pedestals are monitored every second to keep threshold values for the trigger. The pedestal value is defined as the average of FADC values within 160 nsec (8 FADC bins). The threshold value for Level-0 trigger is fixed to 15 counts above the average of pedestal. Triggered waveforms mostly from atmospheric particles are counted into histograms based on integrated count and maximum count of the waveform. For the monitoring of detector gain, the signal part of the waveform is integrated for 240 nsec (-80 nsec from trigger timing and up to +160 nsec after) and the values are accumulated into histograms for each layer of scintillator. The integrated FADC value and the maximum value of the signal waveform within 2.56 sec are also accumulated in histograms. These are used for detector linearity monitoring. The synchronization of electronics of the surface detectors is done by PPS signals received by GPS units (Motorola M12+ oncore module). A time stamp with a precision of 20 nsec is created by the 50 MHz sub-clock on the main board. The total counts of the sub-clock between PPS signals are also sent to the trigger-decision electronics along with a Level-1 event list to correct the time stamp of the waveform in later analysis. The power bases (PS1806/12F-02; Electrontube Co. Ltd.) for PMTs are powered and controlled through DAC on the detector electronics. Each SD unit described above is powered by one solar panel (KC125TJ; KYOCERA Corp.) and one deep cycle battery (DCS100; C&D technologies, Inc.). The solar panel has 125 W of charging power. The battery has 100 Ah of capacity. The charging of the battery is controlled by home made charge control board that works with main CPU board. The solar panel system provides sufficient power required from the electronics (5 W).
3.3 Assembly and deployment
Detector assembly is divided into two parts. First, two layers of plastic scintillator are installed in the stainless-steel box and WLS fibers are laid on each layer. To increase the light intensity, each layer of scintillator is wrapped with two layers of Dupont Tyvek sheeting. Both ends of a bundle of WLS fibers from a layer are glued together with epoxy inserted into an acrylic sheath. The sheath is sized to fit the PMT surface. The ends of the WLS fibers are smoothed with a grinder and polished after making a bundle in the sheath. To ensure good optical contact, optical grease (Optseal; Shin-Etsu Chemical Co. Ltd.) is also applied on the surface of the PMT. The production rate of scintillator boxes was three boxes per day. In total 512 SD boxes were assembled in Japan and those boxes were shipped to Utah, USA. Second, the final assembly of other components such as solar panels, batteries, and electronics along with mounting these on to iron frames (T&D Co. Ltd.) was performed at the control center in Delta. Each SD unit was deployed to its location by using helicopter after transporting the units by trucks with a flatbed trailer to staging areas accessible from existing roads inside the TA site. From October 2006 to the end of February 2007, 485 surface detectors were deployed. A total of 503 SDs were deployed by the end of December 2007. Additional 4 SDs were deployed in December 2008.
3.4 Long-distance network for remote operation
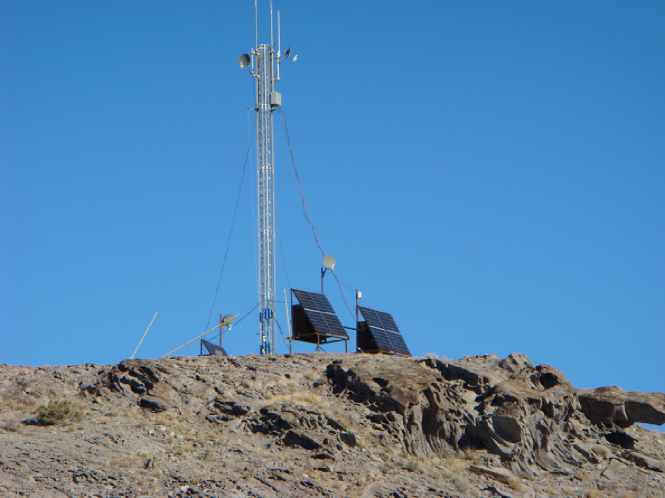
Fig. 5 shows one of the communication towers, which is located at Smelter Knolls (SK) near the north edge of the SD array. The other two towers also have the same size and are located on hills (Black Rock and Long Ridge) near the western and eastern edges of the SD array, respectively. The communication towers have the role of collecting trigger information from the SDs and providing communications for the FD stations and CLF (Central Laser Facility) [17] site for general purposes.
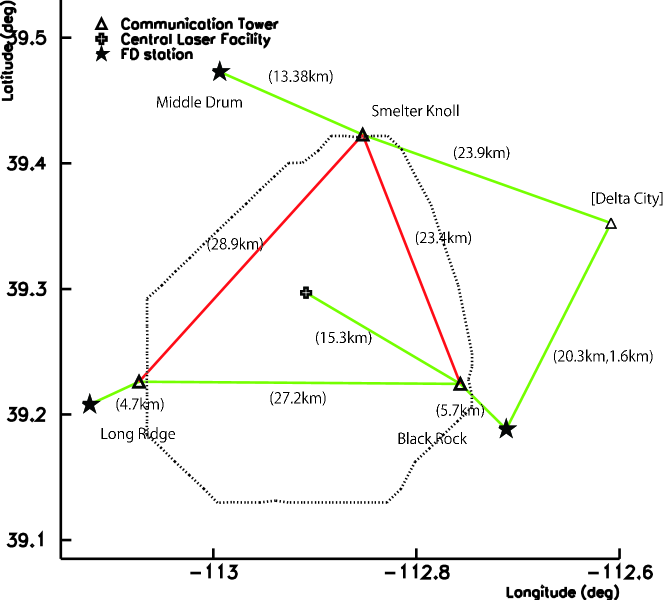
Fig. 6 shows the long-distance links for all the facilities and air fluorescence detectors in the entire TA site. The open triangles in Fig. 6 represent the locations of the communication towers. The data collected from the SDs are temporarily stored at the communication tower and regularly transferred to Delta City through this network every 12 hours. There are two types of antenna units (Canopy P2P100; Motorola Co. Ltd.) which are operated in different frequency ranges. The tower-to-tower and tower-to-FD links are operated at 5.7 GHz and the tower-to-SD links are operated at 2.4 GHz range. The line between the SK and BR towers and the line between the SK and LR towers are used for SD data acquisition. No access to FD stations and CLF for general purposes interferes with the SD data acquisition lines. The long distance networks are currently operated at 3 Mbps throughput, which is sufficient for SD data acquisitions, data transfer and operation of FD stations.
4 Data communication and air shower trigger
There is a trigger-decision module at each tower. The electronics is the same as shown in Fig. 4, running a different firmware program. The data communication between the trigger-decision electronics at communication tower and SDs is done by 2.4 GHz wireless LAN using a custom-made communication protocol. The baud rate of the data acquisition is 1 Mbps. Every second, the trigger-decision electronics at the communication tower requests each surface detector to send a Level-1 trigger event list and the total counts of the sub-clock between PPS signals. From the event lists, an air shower trigger is generated when three adjacent SDs are coincident within 8 sec.
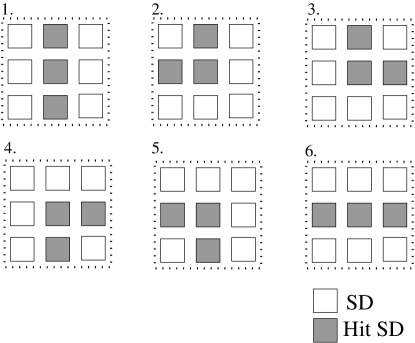
Fig. 8 shows the current trigger pattern of three adjacent SDs that are hit. We call this trigger the Level-2 trigger. With this trigger, collection of waveforms stored in each SD electronics starts. The trigger-decision electronics collects waveforms coincident within 32 sec from the trigger timing. When the Level-2 trigger is generated within one subarray, the trigger time information is transmitted to the central trigger decision process. The process is running at the data acquisition PC (TS7800; Technologic systems, Co. Ltd.) in the SK tower. From the SK tower, the Level-2 trigger signal is distributed to other two towers. The broadcasting of this trigger enables to collect waveforms associated with a shower which impacts multiple subarrays.
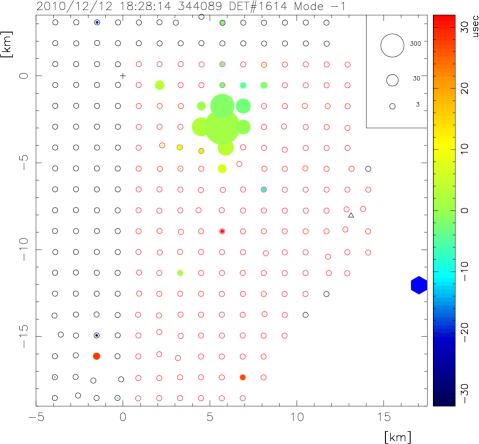
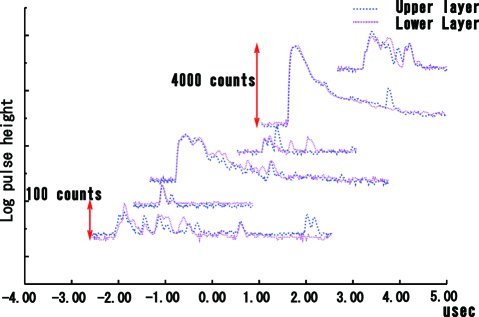
Fig. 9 shows an event triggered at BR
subarray. Fig. 10 shows a sample of waveforms.
To collect air shower event at the boundary of subarrays,
the Level-1 trigger event lists from the SDs at the boundary of subarrays are also sent
to the central trigger process in SK tower.
The central trigger process combines Level-1 trigger information
collected from SDs at the boundary of subarrays.
The central trigger process verifies whether the same trigger condition
was satisfied only by the boundary detectors.
As shown in Fig. 8, in the case of pattern 1 or 6 ,
the hit pattern that satisfies the Level-2 trigger condition can be spread over 2
subarrays, but the condition is not satisfied with edge detectors only.
To trigger such a case, central trigger process searches for the coincidence
of two adjacent hits in the boundary detectors from Level-1 trigger list.
If such a coincidence exists, the central trigger process sends time and
position information of the coincidence to all towers.
Trigger-decision electronics at towers verify the Level-2 trigger condition using
the received information from the central trigger process. Shower events of relatively small size that fall near the boundary
of subarrays is collected by this trigger scheme.
With the above trigger conditions, trigger efficiency reaches 97% for primary particle with energy of 1019.0 eV. Here the efficiency includes the effect of dead counters [16, 20, 23].
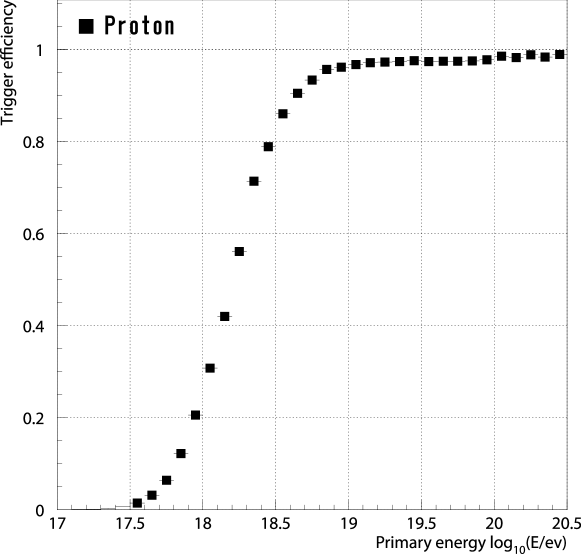
Fig. 11 shows trigger efficiency as a function of energy of primary particle obtained using CORSIKA [24] air shower Monte Carlo simulation and GEANT4 [25] detector Monte Carlo simulation [26].
To improve the efficiency of detecting FD-SD hybrid events at lower energies ( 1018.7 eV), an external trigger called Hybrid Trigger was installed to collect waveforms associated with air showers detected by FD. From nearest FD, the SD data acquisition system at a tower receives trigger timing and time window for requesting waveforms stored at each SD in the subarray. The efficiency of the waveform collection is greater than for the primary particle with energy of 1017.5 eV triggered by FD [27]. The extended hybrid trigger observations started in October 2010.
5 Detector Calibration and Monitoring
For stable observation, the status and environment of the batteries need to be monitored continuously. For calibration in later analysis, it is very important to monitor the detector response. For this purpose, a monitoring process runs on each SD in a 10 min cycle. The monitored items are summarized in Table 1 [28]. The size of monitoring data for 10 min is 9600 bytes. The data is divided into 600 subsets. All the subsets are sent along with the Level-1 trigger tables within 10 min.
| Item | Data | Resolution |
|---|---|---|
| 1MIP histogram | 12bin sum of FADC | 1 FADC count 10min |
| Pedestal histogram | 8bin sum of FADC | 1 FADC count 10min |
| Pulse height histogram | Maximum FADC | 32 FADC count 10min |
| Total charge histogram | 128bin sum of FADC | (FADC sum)=0.2 |
| Power cycle data | Battery (voltage, current) | 1min |
| Environmental data | Temperature, humidity | 1min |
| Trigger rate | Level-0, Level-1 trigger rate | 1min |
| GPS status | Number of satellites, status | 10min |
5.1 The 1-MIP monitor
The charge output by atmospheric charged particles is used to estimate the total energy deposited by shower particles. The integrated FADC value recorded by the Level-0 trigger is collected as monitoring data from each surface detector. Here the time window for the integration is 240 nsec (12 bins). The time window ranges between -4 bins from trigger timing and +8 bins after trigger timing. That is sufficient to evaluate MIP peak count of FADC.
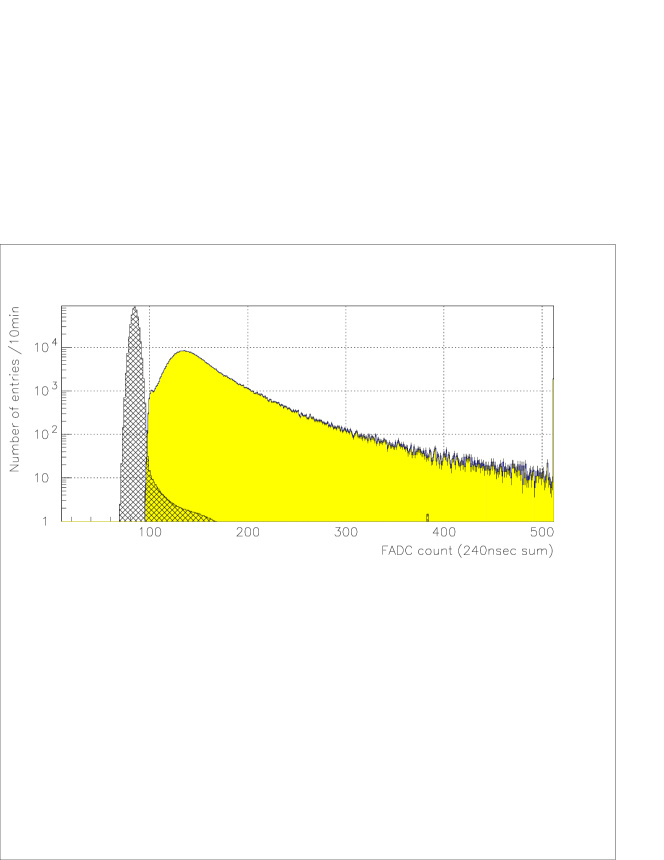
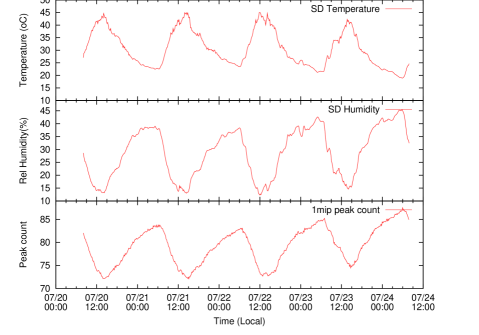
Fig. 12 shows an example of the charge output distribution. The last bin of the histogram is the overflow bin. The temperature coefficient of gain of the surface detectors is typically -0.8%/∘C for a diurnal variation of temperature that reaches up to 25∘C [21]. Fig. 13 shows examples of the monitored time variations of temperature, relative humidity inside the scintillator box, and 1-MIP peak value. Change of detector response caused mainly by the variation of the outside temperature is monitored by this distribution continuously to the nearest ten minutes.
5.2 Linearity monitor
A check on the linearity of charge output was performed by using two LEDs attached at each layer of scintillator. This was done for all the detectors before deployment. Two LEDs were flashed with 400 nsec wide square pulses alternately or simultaneously. The amount of light from each LED is changed by changing the pulse height of the square pulse. From the ratio of the measured output to the expected output, the linearity curves were measured. Here we describe the light amount as and the peak of the pulse from a PMT in FADC count as while driving one LED. The PMT output while driving LED 1 and 2 simultaneously is represented as . The linearity was checked by comparing and while changing and .
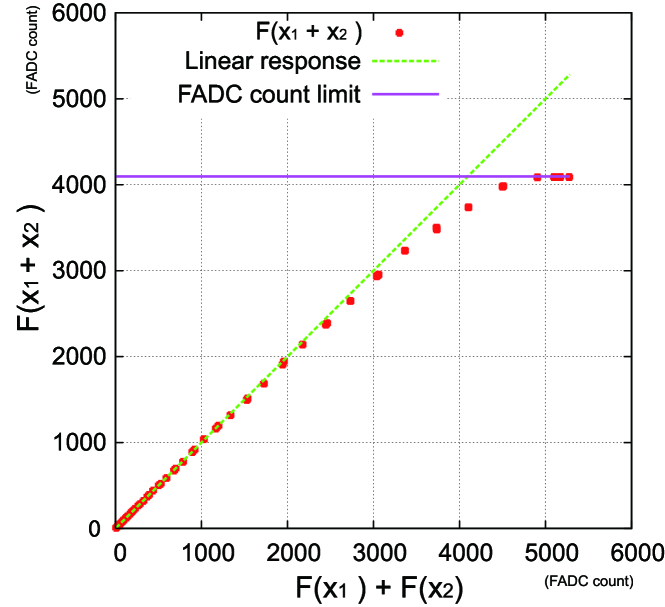
Fig. 14 shows a typical example of observed relation between and .
To check the linearity and its variation in the long term of operation, pulse-height (FADC peak) histograms are also taken as monitoring data. The pulse height of the signal that satisfies the level-0 trigger condition is counted into a histogram. The high voltage values of the PMTs of all the detectors are adjusted to obtain almost the same FADC counts for 1 MIP peaks. So the histograms differ between detectors because of the difference of the linearity of the PMTs. We monitor the histogram to detect time variation of the linearity. By comparing the tail of the histogram and the one from the tubes with good linearity, it is possible to estimate non-linearity.
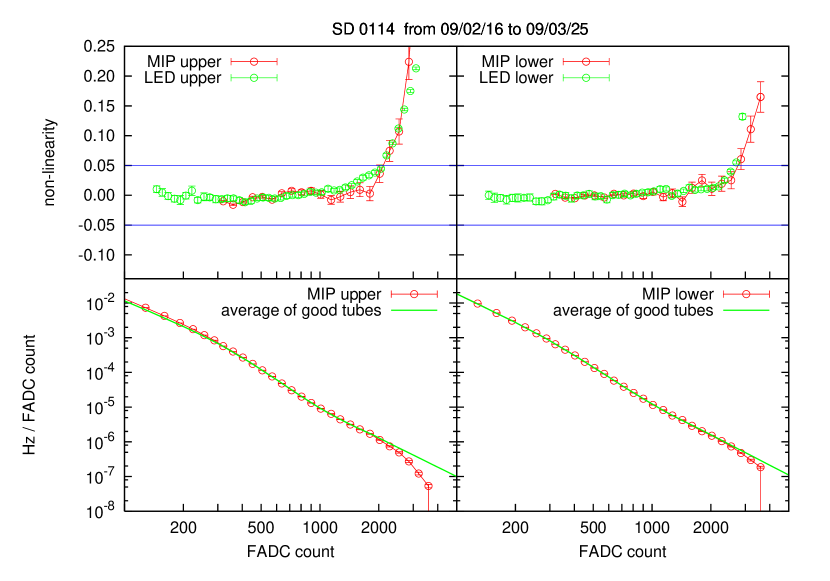
Fig. 15 shows an example of comparison between pulse-height linearity obtained from LED calibration and the one estimated using the pulse-height monitor. It shows fairly good agreement and it was confirmed that the histogram can be used for monitoring the stability of linearity. When the pulse height of signal is larger than the expected height of saturation, the signal is not used for analyzing lateral distribution of shower particle. But the timing information is used for calculating arrival direction.
5.3 Power monitor, GPS and environmental parameters
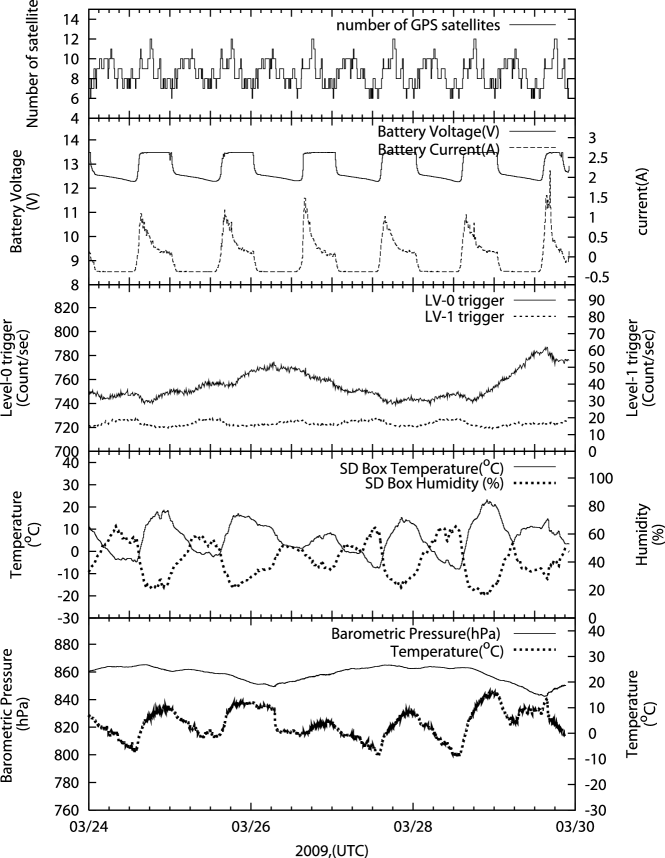
Since each SD is locally powered by a solar panel and a battery, it is very important to monitor the status of the output voltage and current from the battery. The 1PPS signals are generated by GPS modules using the signals from the satellites that are visible through the GPS antennas. To understand the status of the GPS module, the number of satellites visible through the GPS module and conductivity of the antenna are read out every 600 sec. Each surface detector is equipped with five temperature sensors and two humidity sensors to record the environment of the detector and electronics box.
6 Summary
The SD array of the TA experiment consists of 507 plastic scintillation detectors of 3 m2 in size. The array has the largest total area in the northern hemisphere. The detector enables us to compare estimated energy of primary particle using longitudinal shower development observed at FD and lateral distribution of shower particles detected with the SD array. The observation with the SD array is continuous to have 100% of duty cycle. This feature enables us to explore the anisotropy of arrival directions of highest energy cosmic rays with larger exposure than observation with FD.
The deployment of the surface detectors started in October 2006. Totally 507 surface detectors were deployed by November 2008. The deployed detectors have been calibrated and tuned. The air shower array began operation in March 2008. For more than three years, air shower events from UHECR have been collected along with detailed monitoring data. The monitoring data enables us to calibrate the variation of detector responses with enough accuracy.
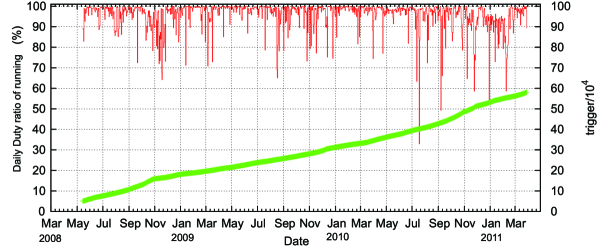
We showed the running status after three years of SD operation. An upgrade of the DAQ system was performed and additional deployment was made in November 2008. Including maintenance periods, the array has been operating with a 95% of duty cycle on average. The variations of detector response and status are recorded in 10 min resolution and are well understood. The number of triggers collected as of March 2011 has reached .
Acknowledgments
The Telescope Array experiment is supported by the Japan Society for the Promotion of Science through Grants-in-Aid for Scientific Research on Specially Promoted Research (21000002) “Extreme Phenomena in the Universe Explored by Highest Energy Cosmic Rays”, and the Inter-University Research Program of the Institute for Cosmic Ray Research; by the U.S. National Science Foundation awards PHY-0307098, PHY-0601915, PHY-0703893, PHY-0758342, and PHY-0848320 (Utah) and PHY-0649681 (Rutgers); by the National Research Foundation of Korea (2006-0050031, 2007-0056005, 2007-0093860, 2010-0011378, 2010-0028071, R32-10130, 2011-0002617); by the Russian Academy of Sciences, RFBR grants 10-02-01406a and 11-02-01528a (INR), IISN project No. 4.4509.10 and Belgian Science Policy under IUAP VI/11 (ULB). The foundations of Dr. Ezekiel R. and Edna Wattis Dumke, Willard L. Eccles and the George S. and Dolores Dore Eccles all helped with generous donations. The State of Utah supported the project through its Economic Development Board, and the University of Utah through the Office of the Vice President for Research. The experimental site became available through the cooperation of the Utah School and Institutional Trust Lands Administration (SITLA), U.S. Bureau of Land Management and the U.S. Air Force. We also wish to thank the people and the officials of Millard County, Utah, for their steadfast and warm support. We gratefully acknowledge the contributions from the technical staffs of our home institutions and the University of Utah Center for High Performance Computing (CHPC).
References
- [1] H. Kawai, et al., Nucl. Phys. Proc, suppl, vol 175-176 (2008) 221-226.
- [2] M. Takeda, et al., Phys. Rev. Lett. 81 (1998) 1163.
- [3] M. Takeda, et al., Astroparticle Physics 19 4 (2003) 447.
- [4] K. Greisen, Phys. Rev. Lett. 16 (1966) 748.
- [5] T. Zatsepin and V.A.Kuzmin, JETP Lett 4 (1966) 178.
- [6] T. Abu-Zayyad, et al., Phys. Rev. Lett. 92 (2004) 151101.
- [7] J. Abraham, et al., Phys. Rev. Lett. 101 (2008) 061101.
- [8] N. Hayashida, et al., Astroparticle Physics 10 (1999) 303-311.
- [9] J.N. Matthews, et al., Proceedings of the 30th International Cosmic Ray Conference in Merida Vol.4 (2007) 417-420 .
- [10] T. Shibata, et al., Proceedings of the 30th International Cosmic Ray Conference in Merida Vol.5 (2007) 1069-1072 .
- [11] T. Shibata, et al., Nucl. Instrum. Methods Phys. Res., Sect, A 597, 61 (2008).
- [12] I. Tkachev, et al., Proceedings of the 31th International Cosmic Ray Conference in Beijing ID 1311 (2011).
- [13] T. Tomida, Master thesis University of Yamanashi (2008).
- [14] S. Kawakami, et al., Proceedings of the 29th International Cosmic Ray Conference in Pune 8 (2005) 161.
- [15] S. Yoshida, et al., Proceedings of the 29th International Cosmic Ray Conference in Pune 8 (2005) 2411.
- [16] A. Taketa, et al., Proceedings of the 31th International Cosmic Ray Conference in Łódź ID 924 (2009).
- [17] S. Udo, et al., Proceedings of the 30th International Cosmic Ray Conference in Merida Vol.5 (2007) 1021.
- [18] T. Nonaka et al., Proceedings of the 31th International Cosmic Ray Conference C in Łódź ID 977 (2009).
- [19] S. Iwamoto, Master thesis University of Yamanashi (2009).
- [20] N.Sakurai, et al., Proceedings of the 30th International Cosmic Ray Conference in Merida, Vol.5 (2007) 1159.
- [21] T. Nonaka, et al., Proceedings of the 30th International Cosmic Ray Conference in Merida,Vol 5 (2007) 1005.
- [22] A. Taketa, et al., in preperation.
- [23] Y. Yamakawa, Master thesis University of Tokyo (2009).
- [24] D. Heck, et al., Forschungszentrum Karlsruhe Report FZKA 6019 (1998).
- [25] S. Agostinelli, et al., Nuclear Instruments and Methods in Physics Research A 506 (2003) 250-303.
- [26] B. Stokes, et al., Proceedings of the 31th International Cosmic Ray Conference in Łódź ID 1328 (2009).
- [27] R. Ishimori, et al., Proceedings of International Symposium on the Recent Progress of Ultra-high Energy Cosmic Ray Observation, Nagoya (2010).
- [28] T. Nonaka, et al., Proceedings of the 31th International Cosmic Ray Conference C in Łódź ID 974 (2009).