Are nuclear star clusters the precursors of massive black holes?
Abstract
We present new upper limits for black hole masses in extremely late type spiral galaxies.
We confirm that this class of galaxies has black holes with masses less than ,
if any. We also derive new upper limits for nuclear star cluster masses in massive galaxies
with previously determined black hole masses. We use the newly derived upper limits and a
literature compilation to study the low mass end
of the global-to-nucleus relations. We find the following: 1) The - relation cannot flatten at low
masses, but may steepen. 2) The - relation may well flatten in contrast. 3) The
- Sersic n relation is able to account for the large scatter
in black hole masses in low-mass disk galaxies. Outliers in the - Sersic n relation seem to
be dwarf elliptical galaxies, which may imply that while the morphological transformation mechanism
for massive galaxies is associated with black hole growth, this is not the case in dwarf galaxies.
When plotting vs. we find three different regimes:
a) nuclear cluster dominated nuclei, b) a transition region and c) black hole dominated nuclei.
This is consistent with the picture, in which black holes form inside nuclear clusters with a very
low-mass fraction. They subsequently grow much faster than the nuclear cluster, destroying it
when the ratio / grows above 100. Nuclear star clusters
may thus be the precursors of massive black holes in galaxy nuclei.
1. Introduction
Supermassive black holes (BHs) are thought to be ubiquitous in the nuclei of massive galaxies. The discovery of a number of tight correlations between the global properties of galaxies and the properties of their nuclei (e.g. Ferrarese & Merritt, 2000; Gebhardt et al., 2000a; Häring & Rix, 2004) has led astronomers to realize that the evolution of galaxies may be closely linked to their nuclear properties. However, the nuclei of galaxies do not only host massive BHs, but also massive star clusters, commonly called nuclear star clusters (NC)111Note that we here make the distinction between nucleus, i.e. the location at the very center, and nuclear star cluster. Often the NC has been called nucleus or stellar nucleus in the past, but this seems ambiguous to us.. The overall nucleation frequency is around 75% over all Hubble types (Carollo et al., 1998; Côté et al., 2006; Böker et al., 2002, hereafter B02), but NCs seem to be absent in the most massive galaxies (Graham & Spitler, 2009; Côté et al., 2006). NCs typically have stellar velocity dispersions of , effective radii of a few parsecs, and dynamical masses of (B02; Böker et al., 2004; Walcher et al., 2005). Moreover, they show stellar populations of multiple ages (Rossa et al., 2006; Seth et al., 2006; Walcher et al., 2006), pointing towards them having a complex formation history. This might be related to their special location in the galaxy, as on average, NCs appear to sit at the photometric centre of their host galaxy (Binggeli et al., 2000; Böker et al., 2002). We recently showed that for bulgeless galaxies their location also coincides with the kinematic centre, i.e. the bottom of the potential well (Neumayer et al., 2011).
Intriguingly, NCs in late-type spirals and dwarf ellipticals follow relationships with their host galaxies that mirror the and relationships of high-mass galaxies (Rossa et al., 2006; Ferrarese et al., 2006a; Wehner & Harris, 2006), suggesting the possibility that the fueling and growth of NCs and BHs are determined by similar processes, and that BHs and NCs should be grouped together into “central massive objects” (CMOs, Ferrarese et al., 2006a). The NC would then be nothing else than the failed BH (Elmegreen et al., 2008). In this picture, BHs would form in high density clumps typically located in high mass galaxies, while NCs form from lower density clumps in lower density disks. Recent simulation studies (e.g. Regan & Haehnelt, 2009; Mayer et al., 2010) have been able to reproduce the formation of BHs through direct collapse models. If the collapse is quick - compared to the cooling time of the gas - a BH will form. If however, the gas has sufficient time to cool and form stars, it will form a NC (see also the recent review by Bromm & Yoshida, 2011). Competing formation scenarios for NCs are, however, equally successful. For example recent work by Hartmann et al. (2011) has shown that the observed properties of NCs are well reproduced by combining mergers of star clusters with the accretion of gas at a much later time in the history of a galaxy.
A further reason for interest in NCs and their BHs is that a number of authors (Ebisuzaki et al., 2001; Portegies Zwart et al., 2004; Gürkan et al., 2004; Freitag et al., 2006b, a; Gaburov et al., 2008) have found that dense clusters of young, massive stars can experience runaway coalescence of their most massive stars, leading to an intermediate mass black hole (IMBH, but see also Glebbeek et al., 2009). It would then be tempting to identify NCs with the long-sought seeds for BH formation. An observational result supporting this view, is that NCs and BHs can coincide (Filippenko & Ho, 2003; Seth et al., 2008), this is especially well-studied in our own Galaxy (Schödel et al., 2007; Genzel et al., 2010). On the other hand, parameter studies of the runaway collapse scenario (e.g. Freitag et al., 2006b) show that NCs are actually not in a region of parameter space that would be favourable to the collapse.
Of the many global-to-nucleus relations, the three most frequently referred to ones seem to be the relation (Ferrarese & Merritt, 2000; Gebhardt et al., 2000a), the relation (Häring & Rix, 2004) and the relation (Graham & Driver, 2007). As all these relations have been initially set up for the range of massive galaxies (i.e. ), the low-mass range of BHs is not very well populated and holds most potential to find out which one of the three is more fundamental. A particularly interesting case are BHs and NCs in bulgeless galaxies. Indeed, while according to the relation one would expect late-type, bulgeless spirals to host BHs of mass , the relation is no longer “defined” for bulgeless galaxies. As the lack of a bulge would imply the absence of a black hole. On the other hand, exploring the low mass end of the scaling relations, Greene et al. (2010) have derived reliable BH masses in spiral galaxies (with bulges) from maser measurements and find that these fall below the relation of elliptical galaxies, but seem consistent with the relation.
In fact both NCs and BHs have been found in bulgeless galaxies. For NCs see B02, for BHs see e.g. the cases of NGC4395 (Filippenko & Sargent, 1989; Filippenko & Ho, 2003), NGC1042 (Shields et al., 2008), NGC3621 (Barth et al., 2009; Gliozzi et al., 2009) and probably many more (see e.g. Satyapal et al., 2008; Greene & Ho, 2007; Barth et al., 2008; McAlpine et al., 2011). On the other hand, very tight upper limits for the BH mass exist for some galaxies such as M33 (Gebhardt et al., 2001; Merritt et al., 2001), but direct observational constraints are scarce because such small BHs are extremely difficult targets for dynamical searches and therefore very few objects have useful measurements. While it would thus seem tempting to declare that NCs are the central spheroids in bulgeless galaxies, this could lead to a paradox. Indeed, NCs have largely been identified with CMOs in massive galaxies, on the ground that they follow similar scaling relations as BHs. Identifying the same objects with the spheroid in low-mass galaxies would imply a transition in physical properties of the NC. Many observational hints seem to point against this possibility (Walcher et al., 2005), the most important being that NCs have constant radius over Hubble type. A backdoor might be that Erwin & Gadotti (2010) find that BH mass correlates with bulge mass (and no correlation with disk mass exists, Kormendy et al., 2011), while NC mass correlates better with total galaxy mass.
To conclude this introduction, measurements of the demographics of the lowest-mass BHs are an important goal. Their mass distribution encodes a fossil record of the mass scale and formation efficiency of the initial BH seeds at high redshift (e.g. Volonteri et al., 2008) and they hold the power to help us distinguish between different scenarios explaining the observed global-to-nucleus relations (Di Matteo et al., 2005; Hopkins et al., 2006; Peng, 2007; Jahnke & Macciò, 2011). In order to increase the statistics in this particularly interesting low-mass regime, we have calculated upper limits for a sample of 9 NCs, for which integrated velocity dispersions had been published previously (Walcher et al., 2005, hereafter W05). We have also placed upper limits on for a sample of 11 galaxies with measured black hole masses. We have then used these upper limits in conjunction with a literature compilation to gauge which of the different proposed global-to-nucleus relations seem to hold best at the low mass end.
2. New upper limits for BHs in NCs
2.1. Data
Our sample consists of 9 NCs culled from the HST/WFPC2 snapshot survey of B02. Imaging in the F804W filter is available from B02 and we refer to this paper for all details. All 9 NCs are resolved, even if some only barely. We here use the images as available through MAST to yield the surface brightness profile through a multi-Gaussian expansion (see below).
VLT/UVES spectra with high S/N and high spectral resolution have been obtained by W05. We use their velocity dispersion measurement. The properties of our sample are summarized in Table 1.
The sample selection for spectroscopic follow-up technically implied a slight bias to the more luminous among the NCs. Nevertheless, we expect this sample to be a fair representation of NCs in pure disk galaxies in general, as it covers the upper 2/3 of the luminosity range of NCs.
2.2. Analysis
We constructed a dynamical model to estimate the mass and M/L of the NCs and to put meaningful upper limits on the possible central black holes inside them. The first step in this process is developing a model for the light distribution. To parametrise the surface brightness profiles of the NCs and to deproject the surface brightness into three dimensions, we adopted a Multi-Gaussian Expansion (MGE; Emsellem et al., 1994). The MGE fit was performed with the method and software of Cappellari (2002), on the HST I-band images deconvolved from the PSF (using a Tiny Tim PSF Krist, 1995). As most of the clusters are barely resolved in the HST images and shape measurements are therefore impossible, we assume spherical symmetry. Note that although the NCs in NGC300 and NGC7793 (the best resolved) are indeed round, this may be due to their host disks being seen face-on. Seth et al. (2006) find that edge-on NCs can have quite disky outer isophotes.
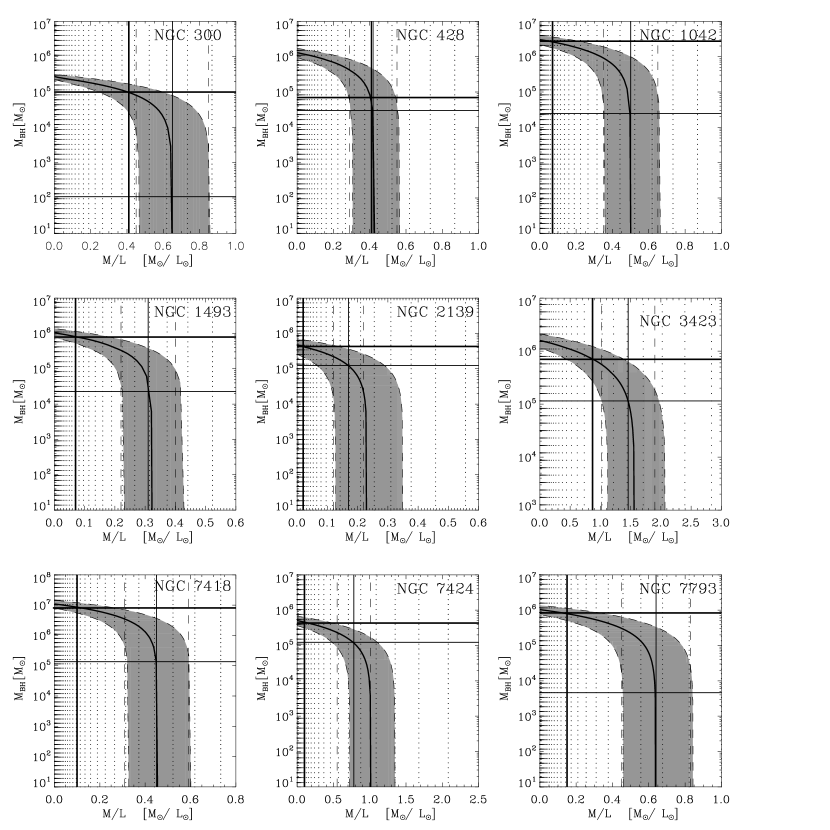
We use the Jeans Anisotropic MGE (JAM) software by Cappellari (2008) which implements the solution of the Jeans equations allowing for orbital anisotropy. The model has three free parameters: (i) The anisotropy, (ii) the mass of a central black hole and (iii) the I-band total dynamical . From the velocity dispersion profile computed by JAM, we compute the luminosity weighted velocity dispersion () over an aperture of 1 square arcsecond. This corresponds to the width of the UVES slit on the sky. We iterate the computation of over a grid of values for M/L and . The results are shown in Figure 1 which is directly comparable to Figure 8 of Barth et al. (2009). Direct comparison with the mass-to-light ratios obtained by W05 (thin solid vertical line), shows that the ratios scatter around 1.0, with no obvious systematic outliers. The small differences in the result can be attributed to the way in which the surface brightness was modelled (Multi-Gaussian expansion here vs. direct deprojection in W05).
The maximum allowed mass of the black hole will be obtained when a minimum of mass is present in the form of stars. From Figure 1 one can easily read what BH mass would result if we assumed M/L = 0 for the stars in the cluster. A more interesting lower limit to the M/L comes from the spectral fitting with stellar population models. We exploit the fact that the age obtained by fitting a simple single stellar population to a composite stellar population is strongly biased to the age of the youngest population in that object which contributes significantly to the total luminosity (see e.g. W06, Serra & Trager, 2007). The relevant values are tabulated in W06, and repeated in Table 1 along with the values derived as upper limits to the mass of a putative BH from the intersection between both thick solid lines in Figure 1. This is a conservative estimate for the upper limit. A more realistic value for can be derived from the intersection or asymptotic point of the model (thick solid curved line) with the best-fit M/L from W05 (thin solid vertical line) in Figure 1. The resulting best-fit values are listed in Table 1.
We explicitly test the effect of velocity anisotropy on the modeling results and found very little change in the results - certainly below our systematic uncertainties due to the lower limit to the mass to light ratio that we apply (see also Barth et al., 2009). We therefore neglect this effect for the rest of this paper.
| Galaxy | Type | NC re | M/Lmin | M | M | |
|---|---|---|---|---|---|---|
| () | () | |||||
| NGC 300 | SAd | 2.9 | 0.41 | 1 | 1 | |
| NGC 428 | SABm | 3.36 | 24.44 | 0.41 | 7 | 3 |
| NGC 1042 | SABcd | 1.94 | 325 | 0.07 | 3 | 2.5 |
| NGC 1493 | SBcd | 2.6 | 254 | 0.07 | 8 | 2.5 |
| NGC 2139 | SABcd | 10.3 | 173 | 0.02 | 4 | 1.5 |
| NGC 3423 | SAcd | 4.18 | 305 | 0.87 | 7 | 1.5 |
| NGC 7418 | SABcd | 12.3 | 345 | 0.10 | 9 | 1.5 |
| NGC 7424 | SABcd | 7.4 | 162 | 0.10 | 4 | 1.5 |
| NGC 7793 | SAd | 7.7 | 254 | 0.15 | 8 | 5 |
| Galaxy | Type | Dist | MBH | MNC | Sersic n | MBulge | Ref | |
| () | () | () | ||||||
| group 1 | ||||||||
| NGC 300 | SAd | 2.2 | 1 | 1.1 | – | 1 | ||
| NGC 428 | SABm | 24.44 | 16.1 | 3 | 1.05 | – | 1 | |
| NGC 1042 | SABcd | 325 | 18.2 | 3 | 1.15 | – | 1 | |
| NGC 1493 | SBcd | 254 | 11.4 | 2 | 2.36 | – | 1 | |
| NGC 2139 | SABcd | 173 | 23.6 | 8 | 1.53 | – | 1 | |
| NGC 3423 | SAcd | 305 | 14.6 | 3 | 1.20 | – | 1 | |
| NGC 7418 | SABcd | 345 | 18.4 | 6 | – | – | 1 | |
| NGC 7424 | SABcd | 162 | 10.9 | 1 | 0.91 | – | 1 | |
| NGC 7793 | SAd | 254 | 3.3 | 8 | 1.27 | – | 1 | |
| group 2 | ||||||||
| NGC 4486 | E1 | 375 | 17.0 | 6.3 | 6.86 | 6.0 | 2 | |
| NGC 4374 | E1 | 296 | 17.0 | 1.5 | 5.60 | 3.6 | 3 | |
| NGC 1332 | S0 | 321 | 19.6 | 1.45 | – | – | 4 | |
| NGC 3031 | Sb | 143 | 4.1 | 8 | 3.26 | – | 5 | |
| NGC 4261 | E2 | 315 | 33.4 | 5 | 7.30 | 3.6 | 6 | |
| group 3 | ||||||||
| NGC 4649 | E2 | 385 | 16.5 | 2.1 | 6.04 | 4.9 | 7 | |
| NGC 3998 | S0 | 305 | 14.9 | 2.4 | – | – | 8 | |
| NGC 2787 | SB0 | 189 | 7.9 | 0.7 | 1.97 | – | 9 | |
| NGC 3379 | E0 | 206 | 11.7 | 1.2 | 4.29 | 6.8 | 10 | |
| NGC 4342 | S0 | 225 | 18.0 | 3.6 | 5.11 | 1.2 | 11 | |
| NGC 4291 | E2 | 242 | 25.0 | 3.2 | 4.02 | 1.3 | 7 |
Note. – Galaxies for group 1 are from W05, and we here derived upper limits on the black hole mass and Sersic n. Galaxies for group 2 and 3 are from Gültekin et al. (2011a). For group 2 objects we derived upper limits on the NC mass via dynamical arguments, while for group 3 objects we used photometry to derive upper limits. For group 2 & 3 Sersic n values are taken from Graham & Driver (2007), bulge masses are from Häring & Rix (2004), and velocity dispersions are from Hyperleda. The newly derived quantities are marked with an at the top of the respective column. References for black hole masses. - (1) this work, (2) Gebhardt & Thomas 2009; Gebhardt et al. 2011, (3) Bower et al. 1998, (4) Rusli et al. 2011, (5) Devereux et al. 2003, (6) Ferrarese et al. 1996, (7) Gebhardt et al. 2003, (8) de Francesco et al. 2006, (9) Sarzi et al. 2001, (10) Gebhardt et al. 2000b; Shapiro et al. 2006, (11) Cretton & van den Bosch (1999)
3. Global-to-nucleus relations
We now plot the the upper limits we have derived into figures showing existing correlations from earlier work. In these figures we typically have a comparison sample which is taken from a larger statistical study and we add a number of objects at the low mass end from different sources in the literature. We have tried to be complete at the very lowest mass end of the relations. Further literature does exist, but typically, the BH masses exceed values of and the galaxies structural parameters have not been studied individually.
3.1. relation
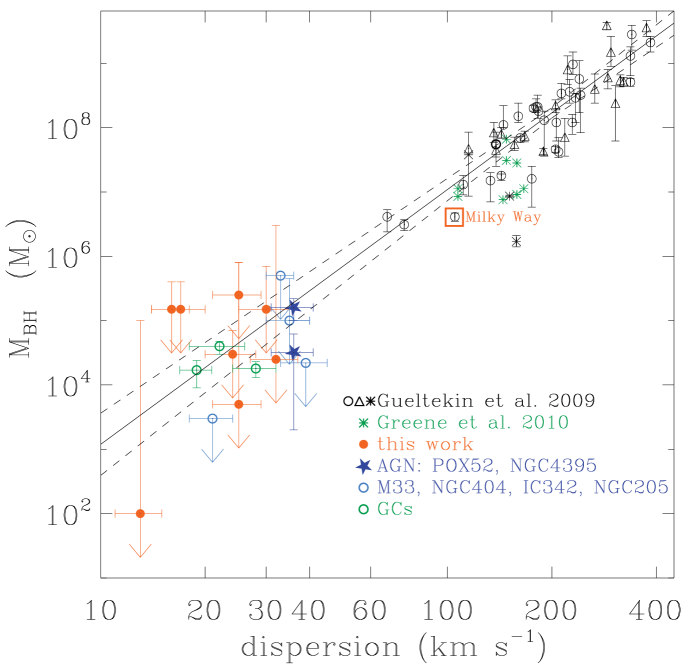
For Figure 2, the relation, the comparison sample and relation are as compiled in Gültekin et al. (2009, black open symbols). We extend this compilation with recent maser measurements by Greene et al. (2010, green crosses). Active AGN are denoted as blue stars; these are NGC4395 (Filippenko & Ho, 2003; Peterson et al., 2005) and POX52 (Barth et al., 2004). In principle, NGC1042 from the present work falls also into this category (see Shields et al., 2008), but is plotted as a filled red circle. Previous upper limits for non-active nucleated galaxies are plotted as open blue circles: M33 (Gebhardt et al., 2001; Merritt et al., 2001), NGC205 (Valluri et al., 2005), IC342 (Böker et al., 1999), and NGC404 (Seth et al., 2010). We also plot the globular clusters G1 (Gebhardt et al., 2005), Cen (Noyola et al., 2008, 2010; Gültekin et al., 2011b), and NGC6388 (Lützgendorf et al., 2011) as green open circles. The verdict on the usefulness of these measurements is still out, with strong contrasting claims by other authors that there is no evidence for a black hole in Cen (Anderson & van der Marel, 2010; van der Marel & Anderson, 2010) and in G1 (e.g. Baumgardt et al., 2003). We nevertheless use the derived values in a spirit of adventure, i.e. what would it mean if these measurements were correct? Finally, the new upper limits derived in this work are denoted as filled red circles. It emerges that a flattening of the relation is not consistent with the current measurements. It may well be that a downwards bending would be necessary, if more stringent upper limits such as that for M33 would be published.
3.2. relation
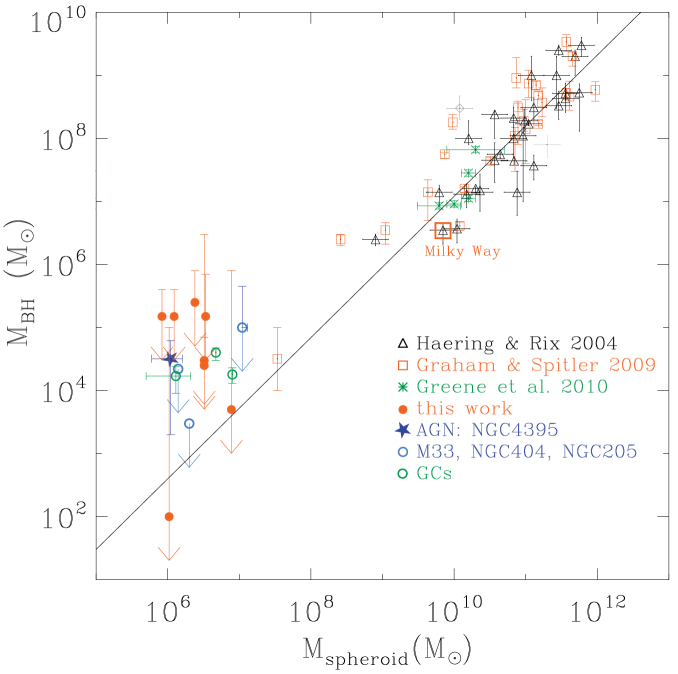
For Figure 3, the relation, the comparison relation and sample are taken from Häring & Rix (2004) (filled black circles), while the other data points come from the same sources as in Figure 2. There is a hint towards a flattening of the relation with the lowest spheroid masses, but it will be difficult to confirm this without much better estimates of the masses of IMBHs. On the other hand a steepening, i.e. bulges that are too massive for their BHs, has been mentioned by Greene et al. (2008, 2010). If there are BHs in galaxies with no bulges as well as bulges that are too massive for their BHs, it seems clear that the relation must suffer from large scatter at small masses.
3.3. relation
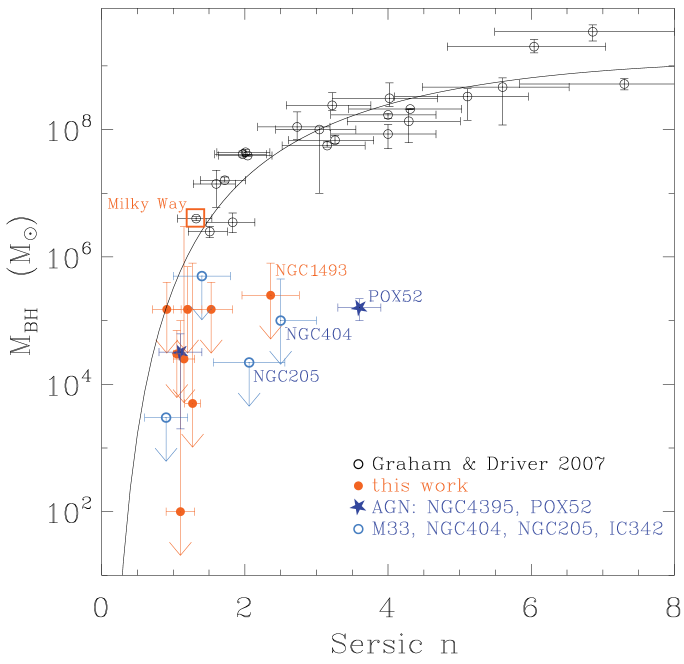
For Figure 4, the relation, the comparison relation and sample are taken from Graham & Driver (2007) (filled black circles), while the other data points come from the same sources as in Figure 2. We have also assembled measurements of the Sersic n from literature sources for all objects with published BH masses. For the galaxies with limits newly derived in the present paper, Sersic n was derived from the following literature sources: Ganda et al. (2009) for NGC1042 and NGC3423, Weinzirl et al. (2009) for NGC2139. For NGC300 and NGC428 Spitzer IRAC 3.6m images were downloaded from the Spitzer Heritage Archive222http://sha.ipac.caltech.edu/ and Sersic n was determined using the GALFIT software (Peng et al., 2002). For NGC 205 we used the surface brightness profile of (Valluri et al., 2005) to derive Sersic n. For NGC1493, NGC7424 and NGC7793 the corresponding images were obtained from the 2MASS archive333http://irsa.ipac.caltech.edu/ and again fitted with GALFIT. All galaxies were fit using one PSF component for the central NC, one Sersic component representing the disk and one constant sky component. All parameters were left free to be fit for. The webpages provide appropriate point spread functions, although all of our targets are nearby and therefore well resolved, the resulting Sersic n is almost independent of the PSF used in GALFIT. We caution that the resulting Sersic n may depend heavily on the radial range used in the fitting. To cite two extreme examples, the Sersic n of NGC300 is independent of the radial range used within . On the other extreme, the Sersic n for NGC1493 varies between and the reported value of . It is beyond the scope of the current paper to derive a physically meaningful fit range that would put the physical meaning of the Sersic n on firmer ground. We emphasize that it is despite the cited uncertainties that the relation between and Sersic n seems to hold.
Figure 4, shows two interesting features: 1) Because the relation fitted by Graham & Driver (2007) curves down at =1, a large range of BH masses is allowed in this regime, which clearly allows for the scatter that seems to emerge as a common trend in the previous two nucleus-to-global relations. 2) There are significant outliers in this plot, in the sense that some low-mass galaxies can have too high Sersic for their BH mass.
3.4. relation
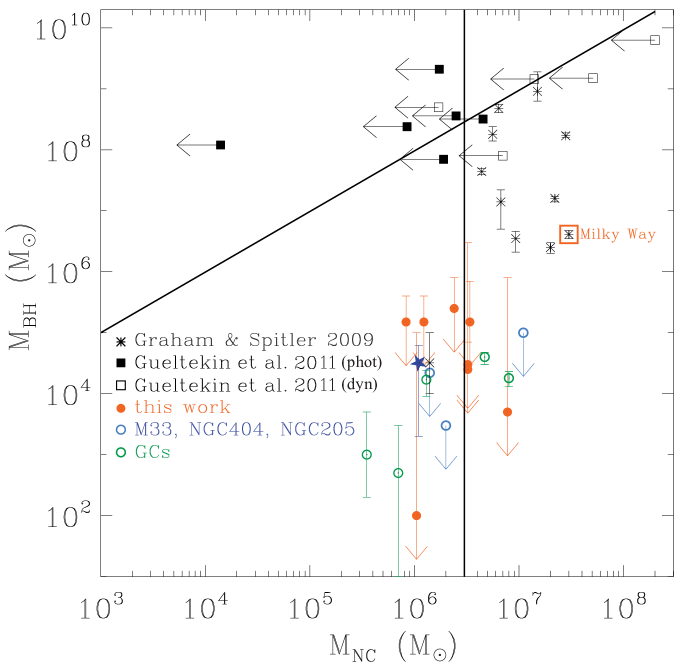
In Figure 5 we show the relation between and (compare Graham & Spitler, 2009; Seth et al., 2008). We have plotted objects already used above, for which determinations of both and exist. In searching for a high mass comparison sample we have made use of the compilations by Graham & Spitler (2009) and Gültekin et al. (2011a) from which we also take the distances. Where not available, we have then proceeded to derive upper limits to the NC masses either from the literature or from own fits to archival HST images 444Thorough work deriving consistent photometry and structural parameters for NCs across the entire Hubble sequence for large swaths of the HST archive is badly needed, but is beyond the scope of the current work. Note that one focus of such work could be the distinction (if any clear distinction exists) between NCs and nuclear disks. In the case of NGC4342, for example, the upper limit we give on the NC mass is not only observationally uncertain, but also conceptually uncertain. As Scorza & van den Bosch (1998) discuss, a relation between the nuclear disk mass and the BH is as plausible as between the NC and the BH. Indeed, some NCs may turn out to be nuclear discs on close inspection (compare Seth et al., 2006)..
We now discuss the ways that we have obtained upper limits for the NC masses galaxy by galaxy. We strongly emphasize that we have tried to obtain upper limits to rather than real measurements of the NC mass. Real measurements of NC masses can only be carried out by a combination of dynamical modeling and spectral analysis to determined the relative influence of the AGN and possible varying M/L ratios. We rather aim to be conservative with respect to all uncertainties affecting our estimates of upper limits to the NC masses. Our resulting upper limits are listed in Table 2. For the following 5 objects we estimated upper mass limits from the literature only.
NGC4486 (M87): the bright nucleus is dominated by AGN light. There is no evidence for a NC. We therefore use Figure 7 of Gebhardt & Thomas (2009), which shows the enclosed stellar mass within the central arcsec to be . This is consistent with an estimate from Young et al. (1978), which gives a total of M = within a radius of 100pc and M/L=60, thus leading to an estimate of the stellar mass within that radius of , assuming that the stellar M/L = 4. We emphasize that this is the total stellar mass within a radius comparable to the radii of typical NCs, and therefore gives an upper limit to . We do not claim that M87 actually hosts a stable NC at it centre.
NGC4374 (M84): an AGN has been shown to exist by Bower et al. (2000), with very weak stellar features. To estimate an upper mass to the NC in NGC4374 we use the paper by Walsh et al. (2010), which yields a BH mass estimate of . Their Figure 4 shows the circular velocity profiles due to the BH and the stellar mass, respectively. Assuming a distance to M84 of 17 Mpc, yields 70 pc / arcsec. Assuming a NC radius of 10″and a stellar M/L=4, we obtain that at 10 pc radius the circular velocity due to the BH is 400 km/s, while the circular velocity due to the remaining stellar mass is smaller than 50 km/s. To obtain an estimate of the upper limit for a putative NC, we need to correct for the different masses and for the different spatial distribution (point-like vs. extended). From the virial theorem, we can scale the velocity quadratically. From Table 2 in the current work it can be seen that a conservative factor (i.e. one that gives a lot of stellar mass) for the conversion from point-like to extended would be a factor of 10. The upper limit for the stellar mass within 10 ″then becomes: / = = 0.15, thus yielding a NC upper mass limit of . Walsh et al. (2010) also state that stellar mass is a negligible contributor to their mass budget, it is therefore entirely possible that no NC exists in that galaxy.
NGC4261: The central luminosity distribution is complex, with a nuclear disk and a luminous nuclear source which seems to be dominated by an AGN, at least a radio jet is present (Ferrarese et al., 1996). There is thus no clear evidence in favour of any NC. Ferrarese et al. (1996) find that M/LV = 2100 within the inner 14.5 pc. A maximum M/LV for stellar populations is 7. We thus obtain that 7 / 2100 of the central mass within 15 pc can be in stars, which is / 300 = 1.6 .
NGC1332: There is no firm evidence for a NC, although the surface brightness profile of Rusli et al. (2011) hints at a central luminosity excess within the central arcsec. The dynamical model of Rusli et al. (2011) gives a central stellar luminosity density of L⊙ kpc-3. For a NC of 5 pc radius this yields a NC luminosity of 2 L⊙ in the R-band. With M/L 7 (also according to Rusli et al., 2011), max is 1.4 .
NGC3031: Devereux et al. (2003) list values of stellar mass within radius in their Table 3. From their Figure 3, it is clear that the nuclear source is not extended, there is thus no evidence for the presence of a NC. To estimate an upper mass limit for the NC, we assume a NC radius of 7pc (compare Böker et al., 2002; Côté et al., 2006), the upper limit to is then 7 .
For the following 6 objects no NC mass estimate was available. We therefore turned to the HST images as downloaded from the Hubble Legacy Archive. We have then used GALFIT (Peng et al., 2002) to derive the magnitudes of the NCs. Because all NCs we treat in this last step are in early-type galaxies, we can assume that their ages range between 1 and 10 Gyr, yielding an estimate of the allowed range for the M/L ratio. For most cases we used the F814W filter on either ACS or WFPC2, setting the allowed range of M/L between 1 and 4. Much more sophisticated modeling of the photometry, while possible, would yield only marginally better estimates of the total stellar mass of the NC for several reasons: 1) The star formation histories (SFHs) of NCs are unknown and indeed, likely to be semi-random, repetitive bursts of star formation. Therefore no strong prior can be applied to the SFH. Because the oldest stellar populations are the faintest per unit mass, the resulting uncertainty on M/L is of order a factor 2. 2) The photometry of the NCs is in itself uncertain. We have made use of realistic PSFs from either Jee et al. (2007)555http://acs.pha.jhu.edu/m̃kjee/acs_psf/ or from Tiny Tim666http://www.stsci.edu/hst/observatory/focus/TinyTim. It is much less certain, what the ideal profile for the surface brightness of the host galaxy should be though (compare Ferrarese et al., 2006b; Lauer et al., 2007). We have used one single Sersic, as we are only interested in subtracting the host, not in describing it. Nevertheless, we estimate that the use of different profiles (2 Sersics, Nuker, etc.) could impact the total photometry of the NC by up to 0.5 or even 1 magnitude (compare e.g. the central extrapolations of Böker et al., 2002). We therefore have chosen to let these uncertainties be reflected in the errorbars of the NC mass estimate, rather than trying to hide them somewhere within a sophisticated analysis.
NGC4649: No nuclear source is visible (as also found by Graham & Spitler, 2009). We first fit this galaxy with a single Sersic. When additionally forcing in a point source (GALFIT PSF component) of different magnitudes (20, 20.5, 21,21.5, 22), the resulting oversubtraction can be seen clearly in the residual image for as faint as mI = 21.0. We use this value as a conservative upper limit to the NC magnitude. This results in an upper mass limit of .
NGC4291: We attempted the same procedure as before. However, due to a flat central surface brightness profile, our simple Sersic fit by itself produced an oversubtraction of the central flux, not allowing us to use the exact same procedure as for NGC4649. Nevertheless, the HST image clearly shows the absence of any point source in the center. We therefore assumed the same limit as before, i.e. 21 mag in F814W, which results in .
NGC3998: After the GALFIT fit, a clear spiral structure and a bar are seen in the residuals. The central light source was modeled as a Sersic with an effective radius of 0.2″ and a Sersic n = 0.1, making us believe it is unresolved. de Francesco et al. (2006) classify this galaxy as a LINER, thus the central source is AGN-light dominated. Therefore our photometrically derived NC mass of again is a conservative upper limit.
NGC4342: The fit with GALFIT was difficult, with 4 Sersic components in the final fit. The final solution was chosen to oversubtract the NC. Again we have a conservative upper limit of 21.85 mag corresponding to , using an M/L of 6.5 in I from Cretton & van den Bosch (1999). Contamination from AGN light is also possible, making our upper mass limit more robust.
NGC3379 (M105): The NC is visible in Gebhardt et al. (2000b), but not mentioned there. Graham & Spitler (2009) note this galaxy as un-nucleated. Two extended components with Sersic n and one very compact source with Sersic n 1/2 (i.e. Gaussian surface brightness profile) and re = 0.2 ″ give a good fit to this object. The measured integrated magnitude of the central point source is 25.7 in the F814W of WFPC2, corresponding to . We used M/L = 3 as a suitable upper limit to the M/L.
NGC2787: This galaxy was analyzed in Peng et al. (2002) and the nuclear photometry is taken from that source. We used M/L = 3 as a suitable upper limit to the M/L. Thus, the NC upper mass limit is .
Note that in the galaxies NGC4486, NGC4374, and NGC3379 a luminous nuclear source is clearly seen. While this could all be AGN light, we see no way to ascertain the absence of a NC. In contrast to Graham & Spitler (2009) we only claim to be able to derive an upper limit to the NC mass, rather than excluding a NC alltogether. Note also that a stellar cusp containing 10% of the BH mass is predicted around any BH (Merritt & Szell, 2006a).
4. Discussion
We now discuss and interpret a number of features we saw in the previous section, with the aim to discuss ideas that emerge from these Figures but to our knowledge, have not been discussed in the literature before. The ultimate aim of our study is of course to contribute to a consistent physical picture of black hole and nuclear cluster growth.
In Figure 4, one relation between the global galaxy properties and holds for a large range of , independent of the presence of a bulge. Outliers are rather low-mass galaxies (and not low-mass black holes).
We stress that this relation is purely observational at this stage. Due to the heterogeneous assembly of the Sersic n values (literature, own fitting) the physical region represented by them is not always the same. In particular some of the galaxies do not contain a bulge, while for others the Sersic n has been explicitly measured for the bulge component. The existence of a relation seems evidence that indeed the measurement of Sersic n is meaningful. In particular, no conspiracy is obvious that would fundamentally bias our measurements in the sense of producing a spurious correlation. It thus seems to us that even independently of the exact details of the derivation of the Sersic n, it clearly describes a property of the galaxy that is relevant for the BH mass. A question to ask is then, whether we fully understand the physical implications of that relation, and whether we could potentially reduce the relation to underlying intrinsic distribution of galaxy properties (e.g. if Sersic n was related to bulge mass in a very tight manner, we might be tempted to argue that bulge mass is the more fundamental measurement). We believe the present paper cannot resolve this question but hope it provides motivation to explore these issues further.
To venture a possible physical interpretation of the outliers from the relation we note the following: it could be that the transformation process from disk galaxy to spheroid is different in this galaxy mass regime. While BHs in massive galaxies grow during the morphological transformation process of their host galaxies, BHs in low mass galaxies are not affected (fed) during the transformation process. It might be worthwhile exploring through simulations, whether this has to do with a possible transformation dichotomy, i.e. mergers vs. harassment. It is worth pointing out here that such a dichotomy does not seem to be immediately apparent from the age or metallicity profiles, as these seem not to depend on mass (Koleva et al., 2011).
Figure 5 has not been published previously in this form to the best of our knowledge (though compare Graham & Spitler, 2009; Seth et al., 2008, for similar representations) and may yield considerable insight on the relation between NCs and BHs. An immediate conclusion from this figure is that BHs and their host NCs do not share the same intimate connection as BHs and their host spheroids. It rather seems that in galaxies with a high total mass, or alternatively a sizable spheroid, the BH has been able to grow independently of the NC, thus being able to reach comparable masses. In galaxies or star clusters unaffected by spheroid growth, as e.g. the GCs, M33 and others, it seems the BH, if existent, is only a very small portion of the mass of the NC.
Figure 5 (and similar Figures, see Seth et al., 2008; Graham & Spitler, 2009; Graham et al., 2011) is still in an early phase and we believe further studies in the field will attempt to fill in the high and low mass end of the BH mass regime with more NC masses and BH masses, respectively. Nevertheless it seems that two extreme ends can be identified, with a transition region in between. At the low BH-mass end, there is little evidence for the presence of any BH, yet NCs seem to be common (B02). On the other hand no nuclear BH has been found that is not surrounded by a NC in this regime. If GCs with BHs are indeed the remnants of accreted satellite galaxies (e.g. Zinnecker et al., 1988; Freeman, 1993; Bekki & Freeman, 2003; Böker, 2008) and if indeed they lie on the relation, this would imply however, that at this stage BH growth is linked to NC growth much in the same way that BH growth is later tied to galaxy growth. A close look suggests indeed that some physical processes that occur in or with NCs, such as gas accretion (Milosavljević, 2004; Bekki et al., 2006; Pflamm-Altenburg & Kroupa, 2009) and merging (Tremaine et al., 1975; Capuzzo-Dolcetta, 1993; McLaughlin, 1995; Bekki et al., 2004; Miocchi et al., 2006; Agarwal & Milosavljević, 2011), are quite similar to those experienced by galaxies. An alternative to the assumption that the process giving rise to the is so astoundingly generic is of course that the BH mass measurements in GCs may be subject to the ”expectation bias”, i.e. when the measurement is in accordance with the expectations of the community they get accepted more easily.
At the very high mass end of the BH mass range, the BH is much more massive than the NC. On the other hand, this is the region where global-to-nucleus relations hold best. This could happen through two mechanisms: 1) either the galaxies in question never had a sizable NC, possibly because their central BHs grew early on in the age of the universe, thus stopping NC growth (Nayakshin et al., 2009). Or 2) massive BHs destroy their host NCs. Figure 5 in its current form suggests that this may happen at a mass ratio of 100 or alternatively when the BH radius of influence is of the same size as the NC radius. Loss cone depletion and core formation in early-type galaxies are well-studied mechanisms, that would amply suffice to destroy the pre-existing NC (Merritt, 2006b).
Bekki & Graham (2010) have examined an alternative solution for the disappearance of NCs for massive galaxies. Their argument relies on the mergers that are responsible for the morphological transformation from disk-dominated to bulge-dominated galaxies. They show that NCs can be significantly heated and thus be made susceptible to destruction during the merger event. The picture painted here differs significantly from that painted in Bekki & Graham (2010) in that we put weight on the importance of the BH for destroying the NC. Indeed, what determines NC disappearance does not seem to be galaxy morphology, as most early-type galaxies have NCs. Rather, there is evidence for an upper limit to the BH/NC mass ratio, arguing strongly for a pivotal role of this ratio in leading to NC disruption.
The intermediate mass or transition regime may possibly lie between two boundaries, i.e. above NC masses of 5 M⊙ and below a / mass ratio of 100. In this intermediate mass regime, while BHs have grown by at least 2 orders of magnitude, and probably more than 4 as compared to the NC-dominated regime, the NC grows by at most a factor of 10. There thus is some common growth, yet it does not occur in parallel. On the other hand, this is the region of most scatter in the typical global-to-nucleus relations. This phase would thus be characterized as a transition phase between NC-dominated nuclei and BH-dominated nuclei.
Does Figure 5 imply that NCs do not grow by the same processes as their BHs and is this a serious setback to the grouping together of NCs and BHs into CMOs (Ferrarese et al., 2006a)? That NCs and BHs need not grow in parallel has been emphasized by Nayakshin et al. (2009), where both types of objects rather grow in competition for the same gas reservoir. Nayakshin et al. (2009) ask whether the BH can prevent the NC from growing through its feedback, and postulate that this is the case when the gas accretion rate is smaller than the Eddington rate. This picture is attractive in explaining Figure 5 because it naturally explains the three regimes – NC dominated, NC/BH transition, BH dominated. Nevertheless, given the very low accretion rates observed in bulgeless galaxies and the presence of significant BHs in at least a few of them, this picture seems to break down exactly for the NC-dominated regime.
Discrimination between the different scenarios envisaged in the literature seems to be mostly an observational question at present. At low masses the error bars on BH measurements are typically very large, while NC masses are well measured. At high masses, BH masses are more accurate while the uncertainties for NC masses increase, due to resolution problems of the NCs above the underlying galaxies. We need both reliable BH and NC masses to see what the exact locus of points in this plot is. If there is a smooth transition, making the sequence look like a closed parenthesis, this would imply that the destruction of the NC due to the growing black hole is a slow process. If there really is a well-defined transition at / = 100 then this would imply either that the process of NC destruction is very fast or that these galaxies never had a NC.
5. Conclusions
We have computed new upper limits for the masses of intermediate mass black holes in 9 pure disk galaxies with very low BH masses. We also computed upper limits to the masses of nuclear star clusters in the nuclei of galaxies with previously determined massive BHs. We plot these upper limits on the three global-to-nucleus relations - , - and - Sersic n, as well as on a new Figure that compares and . We discuss the features we see in these figures. Two possible conclusions emerge from our discussion:
-
1.
In the - Sersic n figure, those galaxies that lie on the relation seem to prove that there is a relation between and the morphological transformation of their host galaxies. A few notable outliers are dwarf elliptical galaxies, where the morphological transformation process does not seem to be associated with BH growth. We speculate that this difference may arise from different mechanisms, i.e. mergers for high mass galaxies and harassment for dwarfs.
-
2.
In the - figure, we can clearly distinguish three regimes, NC dominated, BH dominated and transition between the two. We speculate that this could imply that BHs are formed in NCs, then start to grow much faster than their host NCs and, through a transition phase with similar masses for both components, could then ultimately destroy their host through loss cone depletion.
We expect further progress in the field to arise from better measurements of BH masses at the low mass end of the mass function and from better measurements of NC masses at the high mass end of the mass function. In particular, it might be useful for further research in the field if authors attempting to measure black hole masses also stated more clearly what their constraints on the NC mass are. Currently NCs are treated more or less as a nuisance to get rid of, while a clearer assessment of the constraint on their mass would benefit our understanding of the role NCs play in galaxy nuclei.
References
- Agarwal & Milosavljević (2011) Agarwal, M. & Milosavljević, M. 2011, ApJ, 729, 35
- Anderson & van der Marel (2010) Anderson, J. & van der Marel, R. P. 2010, ApJ, 710, 1032
- Barth et al. (2008) Barth, A. J., Greene, J. E., & Ho, L. C. 2008, AJ, 136, 1179
- Barth et al. (2004) Barth, A. J., Ho, L. C., Rutledge, R. E., & Sargent, W. L. W. 2004, ApJ, 607, 90
- Barth et al. (2009) Barth, A. J., Strigari, L. E., Bentz, M. C., Greene, J. E., & Ho, L. C. 2009, ApJ, 690, 1031
- Baumgardt et al. (2003) Baumgardt, H., Makino, J., Hut, P., McMillan, S., & Portegies Zwart, S. 2003, ApJ, 589, L25
- Bekki et al. (2004) Bekki, K., Couch, W. J., Drinkwater, M. J., & Shioya, Y. 2004, ApJ, 610, L13
- Bekki et al. (2006) Bekki, K., Couch, W. J., & Shioya, Y. 2006, ApJ, 642, L133
- Bekki & Freeman (2003) Bekki, K. & Freeman, K. C. 2003, MNRAS, 346, L11
- Bekki & Graham (2010) Bekki, K. & Graham, A. W. 2010, ApJ, 714, L313
- Binggeli et al. (2000) Binggeli, B., Barazza, F., & Jerjen, H. 2000, A&A, 359, 447
- Böker (2008) Böker, T. 2008, ApJ, 672, L111
- Böker et al. (2002) Böker, T., Laine, S., van der Marel, R. P., Sarzi, M., Rix, H.-W., Ho, L. C., & Shields, J. C. 2002, AJ, 123, 1389
- Böker et al. (2004) Böker, T., Sarzi, M., McLaughlin, D. E., van der Marel, R. P., Rix, H.-W., Ho, L. C., & Shields, J. C. 2004, AJ, 127, 105
- Böker et al. (1999) Böker, T., van der Marel, R. P., & Vacca, W. D. 1999, AJ, 118, 831
- Bower et al. (1998) Bower, G. A., Green, R. F., Danks, A., Gull, T., Heap, S., Hutchings, J., Joseph, C., Kaiser, M. E., Kimble, R., Kraemer, S., Weistrop, D., Woodgate, B., Lindler, D., Hill, R. S., Malumuth, E. M., Baum, S., Sarajedini, V., Heckman, T. M., Wilson, A. S., & Richstone, D. O. 1998, ApJ, 492, L111+
- Bower et al. (2000) Bower, G. A., Green, R. F., Quillen, A. C., Danks, A., Gull, T., Hutchings, J., Joseph, C., Kaiser, M. E., Weistrop, D., Woodgate, B., Malumuth, E. M., & Nelson, C. 2000, ApJ, 534, 189
- Bromm & Yoshida (2011) Bromm, V. & Yoshida, N. 2011, ARA&A, 49, 373
- Cappellari (2002) Cappellari, M. 2002, MNRAS, 333, 400
- Cappellari (2008) —. 2008, MNRAS, 390, 71
- Capuzzo-Dolcetta (1993) Capuzzo-Dolcetta, R. 1993, ApJ, 415, 616
- Carollo et al. (1998) Carollo, C. M., Stiavelli, M., & Mack, J. 1998, AJ, 116, 68
- Côté et al. (2006) Côté, P., Piatek, S., Ferrarese, L., Jordán, A., Merritt, D., Peng, E. W., Haşegan, M., Blakeslee, J. P., Mei, S., West, M. J., Milosavljević, M., & Tonry, J. L. 2006, ApJS, 165, 57
- Cretton & van den Bosch (1999) Cretton, N. & van den Bosch, F. C. 1999, ApJ, 514, 704
- de Francesco et al. (2006) de Francesco, G., Capetti, A., & Marconi, A. 2006, A&A, 460, 439
- Devereux et al. (2003) Devereux, N., Ford, H., Tsvetanov, Z., & Jacoby, G. 2003, AJ, 125, 1226
- Di Matteo et al. (2005) Di Matteo, T., Springel, V., & Hernquist, L. 2005, Nature, 433, 604
- Ebisuzaki et al. (2001) Ebisuzaki, T., Makino, J., Tsuru, T. G., Funato, Y., Portegies Zwart, S., Hut, P., McMillan, S., Matsushita, S., Matsumoto, H., & Kawabe, R. 2001, ApJ, 562, L19
- Elmegreen et al. (2008) Elmegreen, B. G., Bournaud, F., & Elmegreen, D. M. 2008, ApJ, 684, 829
- Emsellem et al. (1994) Emsellem, E., Monnet, G., & Bacon, R. 1994, A&A, 285, 723
- Erwin & Gadotti (2010) Erwin, P. & Gadotti, D. 2010, in American Institute of Physics Conference Series, Vol. 1240, American Institute of Physics Conference Series, ed. V. P. Debattista & C. C. Popescu, 223–226
- Ferrarese et al. (2006a) Ferrarese, L., Côté, P., Dalla Bontà, E., Peng, E. W., Merritt, D., Jordán, A., Blakeslee, J. P., Haşegan, M., Mei, S., Piatek, S., Tonry, J. L., & West, M. J. 2006a, ApJ, 644, L21
- Ferrarese et al. (2006b) Ferrarese, L., Côté, P., Jordán, A., Peng, E. W., Blakeslee, J. P., Piatek, S., Mei, S., Merritt, D., Milosavljević, M., Tonry, J. L., & West, M. J. 2006b, ApJS, 164, 334
- Ferrarese et al. (1996) Ferrarese, L., Ford, H. C., & Jaffe, W. 1996, ApJ, 470, 444
- Ferrarese & Merritt (2000) Ferrarese, L. & Merritt, D. 2000, ApJ, 539, L9
- Filippenko & Ho (2003) Filippenko, A. V. & Ho, L. C. 2003, ApJ, 588, L13
- Filippenko & Sargent (1989) Filippenko, A. V. & Sargent, W. L. W. 1989, ApJ, 342, L11
- Freeman (1993) Freeman, K. C. 1993, in Astronomical Society of the Pacific Conference Series, Vol. 48, The Globular Cluster-Galaxy Connection, ed. G. H. Smith & J. P. Brodie, 608–+
- Freitag et al. (2006a) Freitag, M., Gürkan, M. A., & Rasio, F. A. 2006a, MNRAS, 368, 141
- Freitag et al. (2006b) Freitag, M., Rasio, F. A., & Baumgardt, H. 2006b, MNRAS, 368, 121
- Gaburov et al. (2008) Gaburov, E., Gualandris, A., & Portegies Zwart, S. 2008, MNRAS, 384, 376
- Ganda et al. (2009) Ganda, K., Peletier, R. F., Balcells, M., & Falcón-Barroso, J. 2009, MNRAS, 395, 1669
- Gebhardt et al. (2011) Gebhardt, K., Adams, J., Richstone, D., Lauer, T. R., Faber, S. M., Gültekin, K., Murphy, J., & Tremaine, S. 2011, ApJ, 729, 119
- Gebhardt et al. (2000a) Gebhardt, K., Bender, R., Bower, G., Dressler, A., Faber, S. M., Filippenko, A. V., Green, R., Grillmair, C., Ho, L. C., Kormendy, J., Lauer, T. R., Magorrian, J., Pinkney, J., Richstone, D., & Tremaine, S. 2000a, ApJ, 539, L13
- Gebhardt et al. (2001) Gebhardt, K., Lauer, T. R., Kormendy, J., Pinkney, J., Bower, G. A., Green, R., Gull, T., Hutchings, J. B., Kaiser, M. E., Nelson, C. H., Richstone, D., & Weistrop, D. 2001, AJ, 122, 2469
- Gebhardt et al. (2005) Gebhardt, K., Rich, R. M., & Ho, L. C. 2005, ApJ, 634, 1093
- Gebhardt et al. (2000b) Gebhardt, K., Richstone, D., Kormendy, J., Lauer, T. R., Ajhar, E. A., Bender, R., Dressler, A., Faber, S. M., Grillmair, C., Magorrian, J., & Tremaine, S. 2000b, AJ, 119, 1157
- Gebhardt et al. (2003) Gebhardt, K., Richstone, D., Tremaine, S., Lauer, T. R., Bender, R., Bower, G., Dressler, A., Faber, S. M., Filippenko, A. V., Green, R., Grillmair, C., Ho, L. C., Kormendy, J., Magorrian, J., & Pinkney, J. 2003, ApJ, 583, 92
- Gebhardt & Thomas (2009) Gebhardt, K. & Thomas, J. 2009, ApJ, 700, 1690
- Genzel et al. (2010) Genzel, R., Eisenhauer, F., & Gillessen, S. 2010, Reviews of Modern Physics, 82, 3121
- Glebbeek et al. (2009) Glebbeek, E., Gaburov, E., de Mink, S. E., Pols, O. R., & Portegies Zwart, S. F. 2009, A&A, 497, 255
- Gliozzi et al. (2009) Gliozzi, M., Satyapal, S., Eracleous, M., Titarchuk, L., & Cheung, C. C. 2009, ApJ, 700, 1759
- Graham & Driver (2007) Graham, A. W. & Driver, S. P. 2007, ApJ, 655, 77
- Graham et al. (2011) Graham, A. W., Onken, C. A., Athanassoula, E., & Combes, F. 2011, MNRAS, 412, 2211
- Graham & Spitler (2009) Graham, A. W. & Spitler, L. R. 2009, MNRAS, 397, 2148
- Greene & Ho (2007) Greene, J. E. & Ho, L. C. 2007, ApJ, 670, 92
- Greene et al. (2008) Greene, J. E., Ho, L. C., & Barth, A. J. 2008, ApJ, 688, 159
- Greene et al. (2010) Greene, J. E., Peng, C. Y., Kim, M., Kuo, C.-Y., Braatz, J. A., Violette Impellizzeri, C. M., Condon, J. J., Lo, K. Y., Henkel, C., & Reid, M. J. 2010, ApJ, 721, 26
- Gültekin et al. (2009) Gültekin, K., Richstone, D. O., Gebhardt, K., Lauer, T. R., Tremaine, S., Aller, M. C., Bender, R., Dressler, A., Faber, S. M., Filippenko, A. V., Green, R., Ho, L. C., Kormendy, J., Magorrian, J., Pinkney, J., & Siopis, C. 2009, ApJ, 698, 198
- Gültekin et al. (2011a) Gültekin, K., Tremaine, S., Loeb, A., & Richstone, D. O. 2011a, ApJ, 738, 17
- Gültekin et al. (2011b) —. 2011b, ApJ, 738, 17
- Gürkan et al. (2004) Gürkan, M. A., Freitag, M., & Rasio, F. A. 2004, ApJ, 604, 632
- Häring & Rix (2004) Häring, N. & Rix, H.-W. 2004, ApJ, 604, L89
- Hartmann et al. (2011) Hartmann, M., Debattista, V. P., Seth, A., Cappellari, M., & Quinn, T. R. 2011, MNRAS, 418, 2697
- Hopkins et al. (2006) Hopkins, P. F., Hernquist, L., Cox, T. J., Di Matteo, T., Robertson, B., & Springel, V. 2006, ApJS, 163, 1
- Jahnke & Macciò (2011) Jahnke, K. & Macciò, A. V. 2011, ApJ, 734, 92
- Jee et al. (2007) Jee, M. J., Blakeslee, J. P., Sirianni, M., Martel, A. R., White, R. L., & Ford, H. C. 2007, PASP, 119, 1403
- Koleva et al. (2011) Koleva, M., Prugniel, P., de Rijcke, S., & Zeilinger, W. W. 2011, MNRAS, 417, 1643
- Kormendy et al. (2011) Kormendy, J., Bender, R., & Cornell, M. E. 2011, Nature, 469, 374
- Krist (1995) Krist, J. 1995, in Astronomical Society of the Pacific Conference Series, Vol. 77, Astronomical Data Analysis Software and Systems IV, ed. R. A. Shaw, H. E. Payne, & J. J. E. Hayes, 349–+
- Lauer et al. (2007) Lauer, T. R., Gebhardt, K., Faber, S. M., Richstone, D., Tremaine, S., Kormendy, J., Aller, M. C., Bender, R., Dressler, A., Filippenko, A. V., Green, R., & Ho, L. C. 2007, ApJ, 664, 226
- Lützgendorf et al. (2011) Lützgendorf, N., Kissler-Patig, M., Noyola, E., Jalali, B., de Zeeuw, P. T., Gebhardt, K., & Baumgardt, H. 2011, A&A, 533, A36
- Mayer et al. (2010) Mayer, L., Kazantzidis, S., Escala, A., & Callegari, S. 2010, Nature, 466, 1082
- McAlpine et al. (2011) McAlpine, W., Satyapal, S., Gliozzi, M., Cheung, C. C., Sambruna, R. M., & Eracleous, M. 2011, ApJ, 728, 25
- McLaughlin (1995) McLaughlin, D. E. 1995, AJ, 109, 2034
- Merritt (2006b) Merritt, D. 2006b, Reports on Progress in Physics, 69, 2513
- Merritt et al. (2001) Merritt, D., Ferrarese, L., & Joseph, C. L. 2001, Science, 293, 1116
- Merritt & Szell (2006a) Merritt, D. & Szell, A. 2006a, ApJ, 648, 890
- Milosavljević (2004) Milosavljević, M. 2004, ApJ, 605, L13
- Miocchi et al. (2006) Miocchi, P., Capuzzo Dolcetta, R., Di Matteo, P., & Vicari, A. 2006, ApJ, 644, 940
- Nayakshin et al. (2009) Nayakshin, S., Wilkinson, M. I., & King, A. 2009, MNRAS, 398, L54
- Neumayer et al. (2011) Neumayer, N., Walcher, C. J., Andersen, D., Sánchez, S. F., Böker, T., & Rix, H.-W. 2011, MNRAS, 413, 1875
- Noyola et al. (2008) Noyola, E., Gebhardt, K., & Bergmann, M. 2008, ApJ, 676, 1008
- Noyola et al. (2010) Noyola, E., Gebhardt, K., Kissler-Patig, M., Lützgendorf, N., Jalali, B., de Zeeuw, P. T., & Baumgardt, H. 2010, ApJ, 719, L60
- Peng (2007) Peng, C. Y. 2007, ApJ, 671, 1098
- Peng et al. (2002) Peng, C. Y., Ho, L. C., Impey, C. D., & Rix, H.-W. 2002, AJ, 124, 266
- Peterson et al. (2005) Peterson, B. M., Bentz, M. C., Desroches, L.-B., Filippenko, A. V., Ho, L. C., Kaspi, S., Laor, A., Maoz, D., Moran, E. C., Pogge, R. W., & Quillen, A. C. 2005, ApJ, 632, 799
- Pflamm-Altenburg & Kroupa (2009) Pflamm-Altenburg, J. & Kroupa, P. 2009, MNRAS, 397, 488
- Portegies Zwart et al. (2004) Portegies Zwart, S. F., Baumgardt, H., Hut, P., Makino, J., & McMillan, S. L. W. 2004, Nature, 428, 724
- Regan & Haehnelt (2009) Regan, J. A. & Haehnelt, M. G. 2009, MNRAS, 396, 343
- Rossa et al. (2006) Rossa, J., van der Marel, R. P., Böker, T., Gerssen, J., Ho, L. C., Rix, H.-W., Shields, J. C., & Walcher, C.-J. 2006, AJ, 132, 1074
- Rusli et al. (2011) Rusli, S. P., Thomas, J., Erwin, P., Saglia, R. P., Nowak, N., & Bender, R. 2011, MNRAS, 410, 1223
- Sarzi et al. (2001) Sarzi, M., Rix, H.-W., Shields, J. C., Rudnick, G., Ho, L. C., McIntosh, D. H., Filippenko, A. V., & Sargent, W. L. W. 2001, ApJ, 550, 65
- Satyapal et al. (2008) Satyapal, S., Vega, D., Dudik, R. P., Abel, N. P., & Heckman, T. 2008, ApJ, 677, 926
- Schödel et al. (2007) Schödel, R., Eckart, A., Alexander, T., Merritt, D., Genzel, R., Sternberg, A., Meyer, L., Kul, F., Moultaka, J., Ott, T., & Straubmeier, C. 2007, A&A, 469, 125
- Scorza & van den Bosch (1998) Scorza, C. & van den Bosch, F. C. 1998, MNRAS, 300, 469
- Serra & Trager (2007) Serra, P. & Trager, S. C. 2007, MNRAS, 374, 769
- Seth et al. (2008) Seth, A., Agüeros, M., Lee, D., & Basu-Zych, A. 2008, ApJ, 678, 116
- Seth et al. (2010) Seth, A. C., Cappellari, M., Neumayer, N., Caldwell, N., Bastian, N., Olsen, K., Blum, R. D., Debattista, V. P., McDermid, R., Puzia, T., & Stephens, A. 2010, ApJ, 714, 713
- Seth et al. (2006) Seth, A. C., Dalcanton, J. J., Hodge, P. W., & Debattista, V. P. 2006, AJ, 132, 2539
- Shapiro et al. (2006) Shapiro, K. L., Cappellari, M., de Zeeuw, T., McDermid, R. M., Gebhardt, K., van den Bosch, R. C. E., & Statler, T. S. 2006, MNRAS, 370, 559
- Shields et al. (2008) Shields, J. C., Walcher, C. J., Böker, T., Ho, L. C., Rix, H.-W., & van der Marel, R. P. 2008, ApJ, 682, 104
- Tremaine et al. (1975) Tremaine, S. D., Ostriker, J. P., & Spitzer, Jr., L. 1975, ApJ, 196, 407
- Valluri et al. (2005) Valluri, M., Ferrarese, L., Merritt, D., & Joseph, C. L. 2005, ApJ, 628, 137
- van der Marel & Anderson (2010) van der Marel, R. P. & Anderson, J. 2010, ApJ, 710, 1063
- Volonteri et al. (2008) Volonteri, M., Lodato, G., & Natarajan, P. 2008, MNRAS, 383, 1079
- Walcher et al. (2006) Walcher, C. J., Böker, T., Charlot, S., Ho, L. C., Rix, H.-W., Rossa, J., Shields, J. C., & van der Marel, R. P. 2006, ApJ, 649, 692
- Walcher et al. (2005) Walcher, C. J., van der Marel, R. P., McLaughlin, D., Rix, H.-W., Böker, T., Häring, N., Ho, L. C., Sarzi, M., & Shields, J. C. 2005, ApJ, 618, 237
- Walsh et al. (2010) Walsh, J. L., Barth, A. J., & Sarzi, M. 2010, ApJ, 721, 762
- Wehner & Harris (2006) Wehner, E. H. & Harris, W. E. 2006, ApJ, 644, L17
- Weinzirl et al. (2009) Weinzirl, T., Jogee, S., Khochfar, S., Burkert, A., & Kormendy, J. 2009, ApJ, 696, 411
- Young et al. (1978) Young, P. J., Westphal, J. A., Kristian, J., Wilson, C. P., & Landauer, F. P. 1978, ApJ, 221, 721
- Zinnecker et al. (1988) Zinnecker, H., Keable, C. J., Dunlop, J. S., Cannon, R. D., & Griffiths, W. K. 1988, in IAU Symposium, Vol. 126, The Harlow-Shapley Symposium on Globular Cluster Systems in Galaxies, ed. J. E. Grindlay & A. G. D. Philip, 603–+