Self-Energy Effects on the Low- to High-Energy Electronic Structure of SrVO3
Abstract
The correlated electronic structure of SrVO3 has been investigated by angle-resolved photoemission spectroscopy using in-situ prepared thin films. Pronounced features of band renormalization have been observed: a sharp kink meV below the Fermi level () and a broad so-called “high-energy kink” 0.3 eV below as in the high- cuprates although SrVO3 does not show magnetic fluctuations. We have deduced the self-energy in a wide energy range by applying the Kramers-Kronig relation to the observed spectra. The obtained self-energy clearly shows a large energy scale of 0.7 eV which is attributed to electron-electron interaction and gives rise to the 0.3 eV “kink” in the band dispersion as well as the incoherent peak 1.5eV below . The present analysis enables us to obtain consistent picture both for the incoherent spectra and the band renormalization.
pacs:
71.18.+y, 71.20.-b, 71.27.+a, 71.30.+h, 79.60.-iIn a correlated electron system, coupling of single-particle excitations with collective excitations leads to a pronounced energy-dependent band renormalization, so-called kink, in the band dispersion. In the studies of high- cuprate superconductors by angle-resolved photoemission spectroscopy (ARPES), a “kink” has been observed around meV below Lanzara et al. (2001) in the nodal region of the Fermi surface, where no superconducting gap opens. Moreover, a “high-energy kink” has also been observed around - eV below Graf et al. (2007); Meevasana et al. (2007) and its origin has been debated. Electron-phonon interaction Lanzara et al. (2001), antiferromagnetic fluctuations, and/or the magnetic resonance mode Johnson et al. (2001) have been proposed as possible origins of the low energy kink. As for the high energy kink Graf et al. (2007), short-range Coulomb interaction Meevasana et al. (2007), a disintegration of an electron into a spinon and a holon high-energy spin fluctuations Macridin et al. (2007), loop-current fluctuations Zhu et al. (2008) and electron correlation Byczuk et al. (2007) have been proposed as a possible candidate. In order to clarify the origin of the high energy kink, studies of kinks in transition-metal oxides other than the cuprates will give useful information.
One of the perovskite-type light transition-metal oxides (TMOs) SrVO3 (SVO) is a prototypical Mott-Hubbard-type system with the electronic configuration and is an ideal systems to study the fundamental physics of electron correlation. In fact, a dynamical mean-field-theory (DMFT) calculation Georges et al. (1996) of the momentum-dependent spectral function of SVO has foreseen the existence of a high-energy kink caused by a general property of electron-electron interaction and hence a general feature of the electron self-energy of correlated metals Nekrasov et al. (2005). To address the nature of electron correlation in SVO, photoemission spectroscopy measurements have been extensively performed Imada et al. (1998); Fujimori et al. (1992); Inoue et al. (1998, 1995); Sekiyama et al. (2004); Eguchi et al. (2006); Maiti et al. (2001). The V 3 band dispersion and the Fermi surfaces of bulk SVO were studied by ARPES by Yoshida et al. Yoshida et al. (2005). They obtained the mass enhancement factor of near , consistent with the bulk thermodynamic properties Inoue et al. (1998). A more recent ARPES study of SrVO3 and CaVO3 showed that the bandwidth indeed decreased by % in going from SrVO3 to CaVO3 Yoshida et al. (2010). Takizawa et al. Takizawa et al. (2009) fabricated SVO thin films having atomically flat surfaces using the pulsed laser deposition (PLD) technique and studied its detailed electronic structure by in-situ ARPES measurements. Clear band dispersions were observed not only in the coherent quasi-particle (QP) part but also in the incoherent part, consistent with the DMFT calculation Nekrasov et al. (2005).
In the present work, we have investigated the existence or absence of the low and high energy kinks in SVO with improved sample quality and instrumental resolution. A pronounced effect of energy-dependent band renormalization, namely a “kink” has been observed at the binding energy of meV and a “high energy kink” at 0.3 eV. Since SVO is a Pauli-paramagnetic metal without any signature of magnetic fluctuations, the presence of the kinks will give us a clue to understand the nature of the interaction which gives rise to the kinks. Furthermore, we deduced the self-energy in a wide energy range through Kramers-Kronig analysis.
In-situ photoemission measurements in the valence-band and core-level regions were performed at beamlines 28A and 2C of Photon Factory (PF) using a Scienta SES-2002 electron analyzer at photon energies = to eV and =800 eV, respectively. Epitaxial thin films of SVO were grown on single-crystal Nb-doped SrTiO3 (001) substrates by the PLD method. The substrates were annealed at 1050∘C under an oxygen pressure of Torr to obtain an atomically flat TiO2-terminated surface. SVO thin films were deposited on the substrates at 900∘C under a high vacuum of Torr. The chemical composition was checked by core-level photoemission and the surface morphology by ex-situ atomic force microscopy, showing atomically flat step-and-terrace structures. ARPES measurements were performed in an ultrahigh vacuum better than Torr below 20 K. In-plane electron momenta and are expressed in units of , where Å is the in-plane lattice constant of the SVO thin film, identical to that of the SrTiO3 substrate. Electron momentum in the out-of-plane direction is expressed in units of /c, where Å is the out-of-plane lattice constant of the SVO thin film determined by x-ray diffraction reciprocal space mapping.
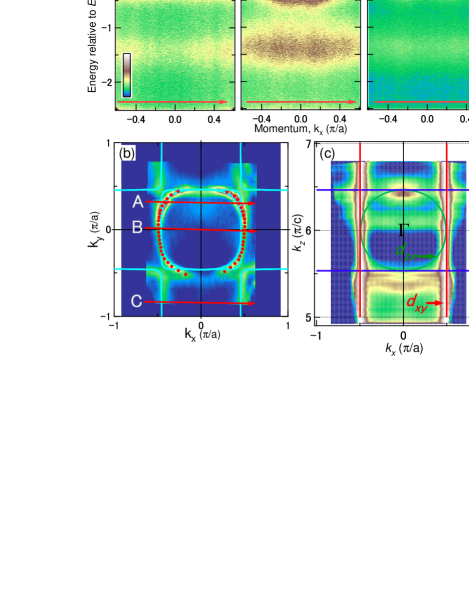
In SVO, each of the , and orbitals forms a nearly two-dimensional band. Consequently, the Fermi surfaces (FSs) consist of three cylinders penetrating perpendicularly to each other. Figure 1(a) shows ARPES spectra near along the cuts in the Fermi surface mapping of Fig. 1(b). There are two main features near ; the coherent part (the sharp QP peak within eV of ) and the broad incoherent part (often regarded as the remnant of the lower Hubbard band centered eV below ). As reported before Yoshida et al. (2005); Takizawa et al. (2009), the coherent part shows a clear band dispersion.
In order to examine the three-dimensional electronic structure, we obtained the intensity map in - space by changing the photon energy as shown in Fig. 1(c). Here, the values have been obtained by assuming the inner potential of = 18 eV and the work function of = 4.5 eV. The intensity distribution indicates that the FS is nearly a straight cylinder along the direction and is therefore two dimensional. On the other hand, the and FSs are not clearly observed due to matrix-element effect and broadening.
We shall investigate correlation effects in the QP spectra by close examination of the nearly two-dimensional band. Image plots of the band in - space are shown in Fig. 2(a). Here, QP band dispersions are determined by the peak positions of the momentum distribution curves (MDCs) and the second derivative of the energy distribution curves (EDCs). Note that the spectral intensity at the bottom of the dispersion is suppressed due to matrix-element effect. Hence, the dispersion near the band bottom is well represented by EDC peaks, while the MDC peaks well represent that near . By smoothly connecting the MDC peak dispersion and the EDC dispersion in an intermediate energy region of 0.25 eV, one can obtain a reasonable picture of the band dispersion in the entire energy range.
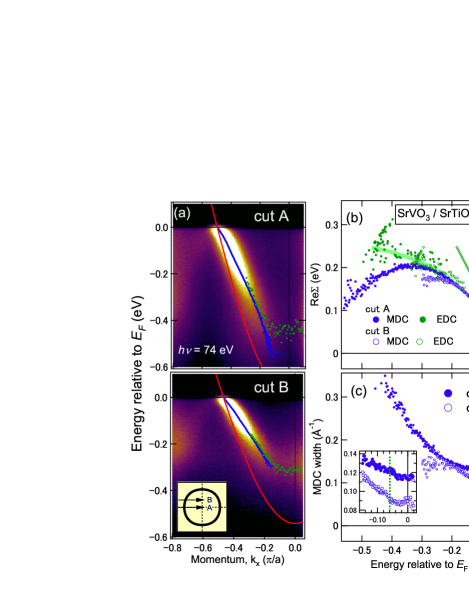
In order to deduce the real part of the self-energy , we use the non-interacting band dispersion calculated within the local-density approximation (LDA) (red curve) and take the difference between the band dispersions and the LDA band as shown in Fig. 2(b). The nearly identical for cuts A and B indicates that the self-energy is nearly -independent at least within the studied momenta. In the deduced , a “kink” is seen around meV below and shall be referred to as the “low-energy kink”, very similar to those observed in the high- cuprate superconductors. As shown in Fig. 2(c), the signature of the kink is also seen in the MDC width, which is proportional to . Lanzara et al. related the kink in the high- cuprates with the oxygen half-breathing phonon mode of meV Lanzara et al. (2001). In SrTiO3 (STO), which has the perovskite-type crystal structure like SVO, an optical phonon mode has been identified at meV Han et al. (2007). Also, SVO does not have low energy spin fluctuations unlike the cuprates. Therefore, the present observation of the low-energy kink in SVO can be unambiguously attributed to coupling of electrons to the oxygen breathing modes.
The thus deduced shows not only the low-energy kink ( meV) but also a weak, broad “kink” at -0.3–0.4 eV, again similar to the high-energy kink of the high- cuprates. Here, it should be noted that if MDC peaks are used to deduce in the entire energy range, the high-energy kink feature is over-emphasized compared to the actual high-energy kink. Therefore, the correct deduction of the experimental band dispersion using both MDC and EDC peaks is necessary to study the high-energy kink phenomena.
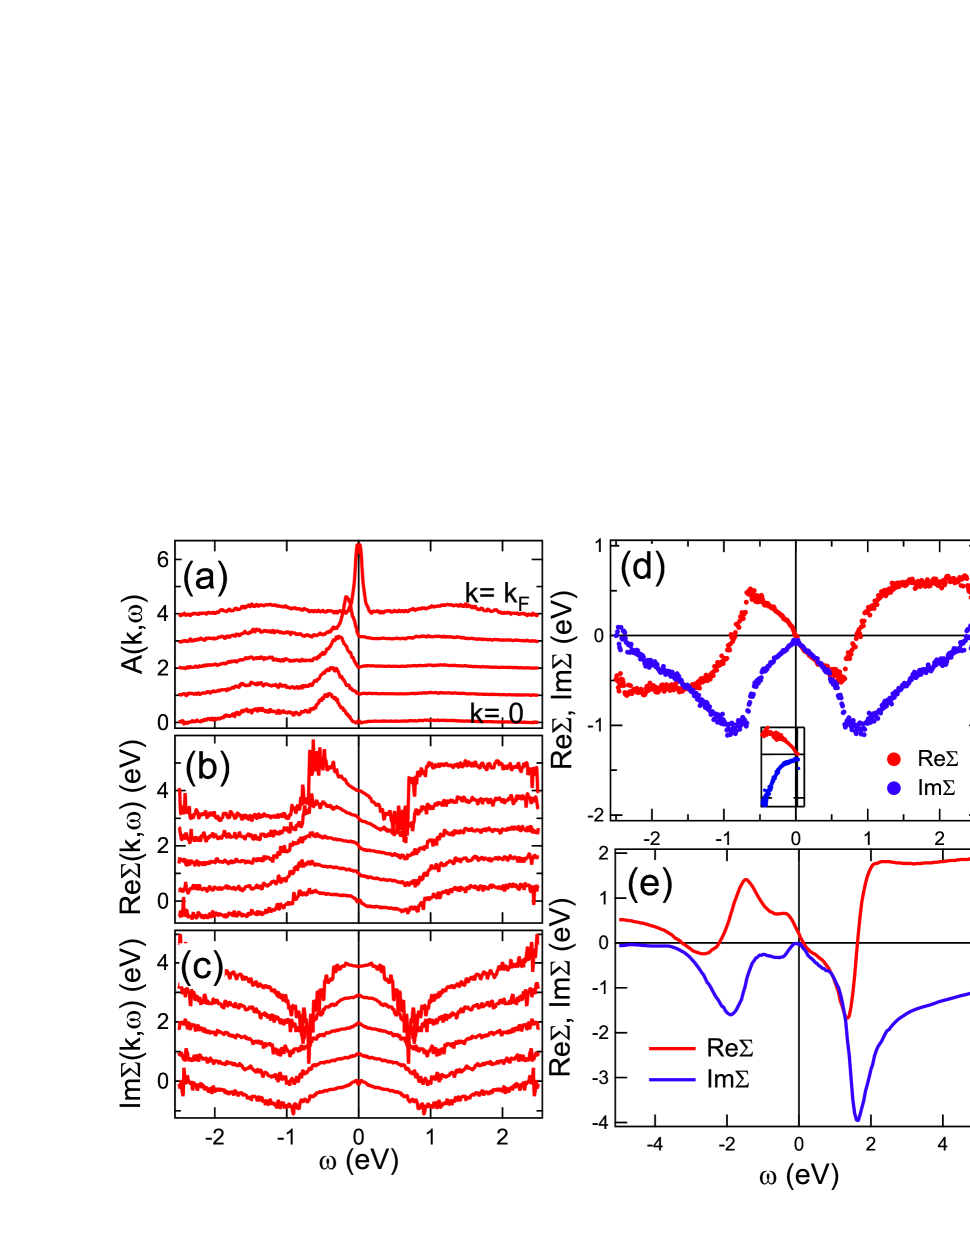
The energy range of and studied by the above method is limited to 0.5 eV below , the energy range of the coherent part, while the behavior of the self-energy over a wider energy range is necessary to understand the role of electron correlation or the incoherent part, too. Therefore, we deduce the self-energy in a wider energy range using the Kramers-Kronig (KK) relation as follows. By performing the KK transformation of the spectral function , one can obtain and consequently, and hence . However, the ARPES intensity only gives bellow . Therefore, in the present analysis, several assumptions have been made to deduce the self-energy. First, we assume electron-hole symmetry for the self-energy, which can be justified near : and . To obtain the self-energy self-consistently under this assumption, we use the experimental ARPES intensity and construct the initial function for as , . Here, () for is assumed to be much smaller than those for because the band dispersion is below the . By KK-transforming , and are obtained. In order to fulfill the electron-hole symmetry, the for is set equal to the complex conjugate of - for . Then, can be renewed by using the new . This process is repeated iteratively until and are converged. Note that the converged is nearly identical to for , indicating that the rather drastic assumptions were reasonably realistic and the resulting self-energy is a good approximation for the true self-energy in the wide energy range of a few eV.
The input is taken from cut B in Fig. 1 and the integrated background and the tail of the O 2 band have been subtracted. Thus obtained for is shown in Fig. 3(a). Panels (b) and (c) show and , respectively, derived from in panel (a). The deduced s for each momentum show line shapes, but there is a weak momentum dependence. Particularly, the absolute value of the for is larger than those for other momenta. Assuming that the momentum dependence of is symmetric with respect to , the average of the self-energy over the Brillouin zone has been obtained as shown in Fig. 3(d). The low energy part of the iteratively deduced self-energy qualitatively agrees with the self-energy deduced from the band dispersion as shown in the inset of Fig. 3(d).
The non-interacting band dispersion is related to through . Figure 3(f) demonstrates good agreement between the experimentally deduced and the band dispersion predicted by the band-structure calculation Pavarini et al. (2004). Interestingly, this analysis demonstrates that the non-interacting band can be extracted from experimental data which are influenced by electron correlation. One can therefore conclude that it is self-consistent to use the band-structure calculation for in the present analysis. In Figs. 3(g) and 3(h), we compare the ARPES intensity plot and the simulated intensity distribution in - space. Here, we have calculated using the momentum-averaged [Fig.3(d)] and the result of the band-structure calculation Pavarini et al. (2004). The QP dispersions and the incoherent part shown in Fig. 3(g) are successfully reproduced by the simulation as shown in Fig. 3(h), indicating the self-consistency of the deduced self-energy.
The and iteratively deduced from the experiment exhibit the characteristic behaviors predicted by the DMFT study of the Hubbard model Byczuk et al. (2007). For example, shows a maximum at -0.7 eV where the EDC shows an intensity minimum. In Fig. 3 (d) and (e), we compare the experimental self-energy and the self-energy calculated for SVO by the LDA + DMFT method Nekrasov et al. (2006). The experimental self-energy shows remarkably similar behavior to that of the LDA + DMFT, although both the vertical and horizontal axes are different by a factor of two [see panels (d) and (e)].
As for the “high energy kink”, while the theory predicts a pronounced feature 0.3 eV below , the same energy region as the present experiment although the experimental kink is less pronounced. The kink which we observed at 60 meV (Fig. 2) is not reproduced by the calculation because electron-phonon coupling is not included in the theoretical model. As for the incoherent part, while the peak energy of the LDA + DMFT calculation is 2.1 eV below Nekrasov et al. (2006), that in the present result is 1.5 eV below it, suggesting that electron correlation is overestimated in the calculation. On the other hand, both the QP band in experiment and that from the calculation show a renormalization factor of 2 relative to the LDA band dispersion. This is because the slope of near which is nearly the same between the experimental and the theoretical self-energies as shown in Figs. 3(d) and (e). Therefore, in order to achieve a consistent picture of the correlated electronic structure, further development of the theoretical approaches and the extension of the experimental approach to other correlated systems have to be made in future studies.
In conclusion, we have performed a detailed ARPES study of in-situ prepared SVO thin films and revealed self-energy effects on the QPs as well as the incoherent structure. A low energy kink was observed at the binding energy 60 meV as in the case of the high- cuprate superconductors, and is attributed to electron-phonon coupling. We have obtained the self-energy in a wide energy range by applying the KK relation to the experimental spectral function. The self-energy shows a large energy scale of 0.7 eV reflecting electron-electron interaction and giving rise to the broad “high-energy kink” 0.3 eV below as well as the incoherent peak 1.5 eV below . The present result provides a self-consistent procedure to experimentally deduce the self-energy in correlated electron systems and this procedure would be useful for future studies of electron correlation effects.
The authors would like to thank A. Georges and S. Biermann for discussion and K. Ono, J. Adachi and M. Kubota for their support in the experiment at KEK-PF. This work was supported by a Grant-in-Aid for Scientific Research (S)(22224005), a Grant-in-Aid for Young Scientist (B) (22740221), a Grant-in-Aid for Scientific Research on Innovative Area ”Materials Design through Computics: Complex Correlation and Non-Equilibrium Dynamics” and an Indo-Japan Joint Research Project “Nobel Magnetic Oxide Nano-Materials Investigated by Spectroscopy and ab-initio Theories” from JSPS. The work in Kolkata was supported by DST, India. The experiments were done under the approval of Photon Factory Program Advisory Committee (Proposals No. 2007G597 and No. 2008S2-003) at the Institute of Material Structure Science, KEK.
References
- Lanzara et al. (2001) A. Lanzara, P. V. Bogdanov, X. J. Zhou, S. A. Kellar, D. L. Feng, E. D. Lu, T. Yoshida, H. Eisaki, A. Fujimori, K. Kishio, J.-I. Shimoyama, T. Noda, S. Uchida, Z. Hussain, and Z.-X. Shen, Nature 412, 510 (2001).
- Graf et al. (2007) J. Graf, G.-H. Gweon, K. McElroy, S. Zhou, C. Jozwiak, E. Rotenberg, A. Bill, T. Sasagawa, H. Eisaki, S. Uchida, H. Takagi, D.-H. Lee, and A. Lanzara, Phys. Rev. Lett. 98, 067004 (2007).
- Meevasana et al. (2007) W. Meevasana, X. J. Zhou, S. Sahrakorpi, W. S. Lee, W. L. Yang, K. Tanaka, N. Mannella, T. Yoshida, D. H. Lu, Y. L. Chen, R. H. He, H. Lin, S. Komiya, Y. Ando, F. Zhou, W. X. Ti, J. W. Xiong, Z. X. Zhao, T. Sasagawa, T. Kakeshita, K. Fujita, S. Uchida, H. Eisaki, A. Fujimori, Z. Hussain, R. S. Markiewicz, A. Bansil, N. Nagaosa, J. Zaanen, T. P. Devereaux, and Z.-X. Shen, Phys. Rev. B 75, 174506 (2007).
- Johnson et al. (2001) P. D. Johnson, T. Valla, A. V. Fedorov, Z. Yusof, B. O. Wells, Q. Li, A. R. Moodenbaugh, G. D. Gu, N. Koshizuka, C. Kendziora, S. Jian, and D. G. Hinks, Phys. Rev. Lett. 87, 177007 (2001).
- Macridin et al. (2007) A. Macridin, M. Jarrell, T. Maier, and D. J. Scalapino, Phys. Rev. Lett. 99, 237001 (2007).
- Zhu et al. (2008) L. Zhu, V. Aji, A. Shekhter, and C. M. Varma, Phys. Rev. Lett. 100, 057001 (2008).
- Byczuk et al. (2007) K. Byczuk, M. Kollar, K. Held, Y.-F. Yang, I. A. Nekrasov, T. Pruschke, and D. Vollhardt, Nature Physics 3, 168 (2007).
- Georges et al. (1996) A. Georges, G. Kotliar, W. Krauth, and M. J. Rozenberg, Rev. Mod. Phys. 68, 13 (1996).
- Nekrasov et al. (2005) I. A. Nekrasov, G. Keller, D. E. Kondakov, A. V. Kozhevnikov, T. Pruschke, K. Held, D. Vollhardt, and V. I. Anisimov, Phys. Rev. B 72, 155106 (2005).
- Imada et al. (1998) M. Imada, A. Fujimori, and Y. Tokura, Rev. Mod. Phys. 70, 1039 (1998).
- Fujimori et al. (1992) A. Fujimori, I. Hase, H. Namatame, Y. Fujishima, Y. Tokura, H. Eisaki, S. Uchida, K. Takegahara, and F. M. F. de Groot, Phys. Rev. Lett. 69, 1796 (1992).
- Inoue et al. (1998) I. H. Inoue, O. Goto, H. Makino, N. E. Hussey, and M. Ishikawa, Phys. Rev. B 58, 4372 (1998).
- Inoue et al. (1995) I. H. Inoue, I. Hase, Y. Aiura, A. Fujimori, Y. Haruyama, T. Maruyama, and Y. Nishihara, Phys. Rev. Lett. 74, 2539 (1995).
- Sekiyama et al. (2004) A. Sekiyama, H. Fujiwara, S. Imada, S. Suga, H. Eisaki, S. I. Uchida, K. Takegahara, H. Harima, Y. Saitoh, I. A. Nekrasov, G. Keller, D. E. Kondakov, A. V. Kozhevnikov, T. Pruschke, K. Held, D. Vollhardt, and V. I. Anisimov, Phys. Rev. Lett. 93, 156402 (2004).
- Eguchi et al. (2006) R. Eguchi, T. Kiss, S. Tsuda, T. Shimojima, T. Mizokami, T. Yokoya, A. Chainani, S. Shin, I. H. Inoue, T. Togashi, S. Watanabe, C. Q. Zhang, C. T. Chen, M. Arita, K. Shimada, H. Namatame, and M. Taniguchi, Phys. Rev. Lett. 96, 076402 (2006).
- Maiti et al. (2001) K. Maiti, D. D. Sarma, M. J. Rozenberg, I. H. Inoue, H. Makino, O. Goto, M. Pedio, and R. Cimino, Europhys. Lett. 55, 246 (2001).
- Yoshida et al. (2005) T. Yoshida, K. Tanaka, H. Yagi, A. Ino, H. Eisaki, A. Fujimori, and Z.-X. Shen, Phys. Rev. Lett. 95, 146404 (2005).
- Yoshida et al. (2010) T. Yoshida, M. Hashimoto, T. Takizawa, A. Fujimori, M. Kubota, K. Ono, and H. Eisaki, Phys. Rev. B 82, 085119 (2010).
- Takizawa et al. (2009) M. Takizawa, M. Minohara, H. Kumigashira, D. Toyota, M. Oshima, H. Wadati, T. Yoshida, A. Fujimori, M. Lippmaa, M. Kawasaki, H. Koinuma, G. Sordi, and M. Rozenberg, Phys. Rev. B 80, 235104 (2009).
- Han et al. (2007) J. Han, F. Wan, Z. Zhu, and W. Zhang, Appl. Phys. Lett. 90, 031104 (2007).
- Nekrasov et al. (2006) I. A. Nekrasov, K. Held, G. Keller, D. E. Kondakov, T. Pruschke, M. Kollar, O. K. Andersen, V. I. Anisimov, and D. Vollhardt, Phys. Rev. B 73, 155112 (2006).
- Pavarini et al. (2004) E. Pavarini, S. Biermann, A. Poteryaev, A. I. Lichtenstein, A. Georges, and O. K. Andersen, Phys. Rev. Lett. 92, 176403 (2004).