Outliers in the 0Z Survey
Abstract
We have now completed detailed abundance analyses of more than 100 stars selected as candidate extremely metal-poor stars with [Fe/H] dex. Of these 18 are below dex on the scale of the First Stars VLT project led by Cayrel, and 57 are below dex on that scale. Ignoring enhancement of carbon which ranges up to very large values, and two C-rich stars with very high N as well, there are 0 to 3 high or low strong outliers for each abundance ratio tested from Mg to Ni. The outliers have been checked and they are real. Ignoring the outliers, the dispersions are in most cases approximately consistent with the uncertainties, except those for [Sr/Fe] and [Ba/Fe], which are much larger. Approximately 6% of the sample are strong outliers in one or more elements between Mg and Ni. This rises to 15% if minor outliers for these elements and strong outliers for Sr and Ba are included. There are 6 stars with extremely low [Sr/Fe and [Ba/Fe], including one which has lower [Ba/H] than Draco 119, the star found by Fulbright, Rich & Castro to have the lowest such ratio known previously. There is one extreme -process star.
1 Outliers in Abundance Ratio Trends
Extremely metal poor (EMP) stars were presumably among the first stars formed in the Galaxy, and hence represent in effect a local high-redshift population. Such stars provide important clues to the chemical history of our Galaxy, the role and type of early SN, the mode of star formation in the proto-Milky Way, and the formation of the Galactic halo. Beers & Christlieb (2005) compiled the small sample of EMP stars known as of 2005. The goal of our 0Z Project is to increase this sample substantially.
Our sample selection is based on mining the database of the Hamburg/ESO Survey (Wisotzki et al, 2000) for candidate EMP stars with [Fe/H] dex (Christlieb, 2003). Our abundance determination procedures are described in Cohen et al (2004). The determination of stellar parameters, measurement of equivalent widths, and detailed abundance analyses were all carried out by J. Cohen.
Our data in general follow the well established trends from numerous studies of Galactic halo stars between abundance ratios [X/Fe] and overall metallicity as measured by [Fe/H] (see e.g. Cayrel et al, 2004; Cohen et al, 2004). The interesting question is whether in the low metallicity regime studied here we can detect the effect of only a small number of SN contributing to a star’s chemical inventory or inhomogeneous mixing within the ISM at these early stages of formation of the Galaxy. Thus the size of the scatter around these trends and whether there are major outliers is of great interest.
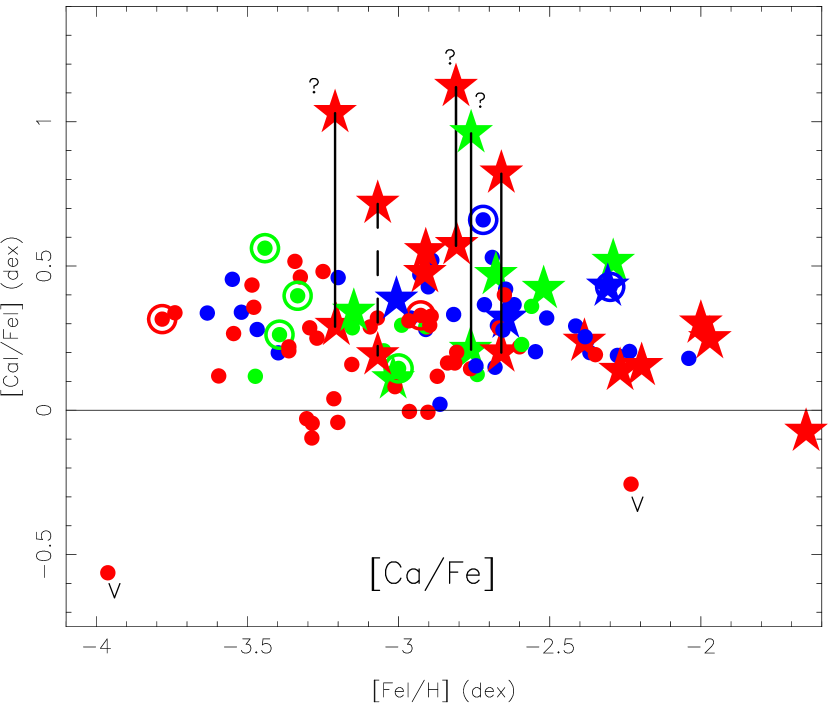
After all the abundance analyses were completed, we looked for strong outliers, either high or low, in plots of [X/Fe] vs [Fe/H]. We checked these in detail. The Ca abundance turned out to be problematical in those very C-rich stars whose spectra were obtained prior to HIRES detector upgrade in mid-2004 and thus included only a limited wavelength range. In an effort to derive Ca abundances from these early HIRES spectra, we ended up using lines which were crowded/blended, presumably by molecular features. This was only realized fairly recently when we obtained additional C-star HIRES spectra extending out to 8000 Å which covered key isolated Ca I lines in the 6160 Å region. We found much lower Ca abundances from the additional Ca lines in these carbon stars. Our earlier claims in Cohen et al (2006) of high Ca/Fe for some C-rich stars are not correct.
These abundance analyses were carried out over a period of a decade, and some updates were made in J. Cohen’s master list of adopted values during that period. The next step, completed in Dec 2011 after the conference, was to homogenize the values.
2 Linear Fits to Abundance Ratios
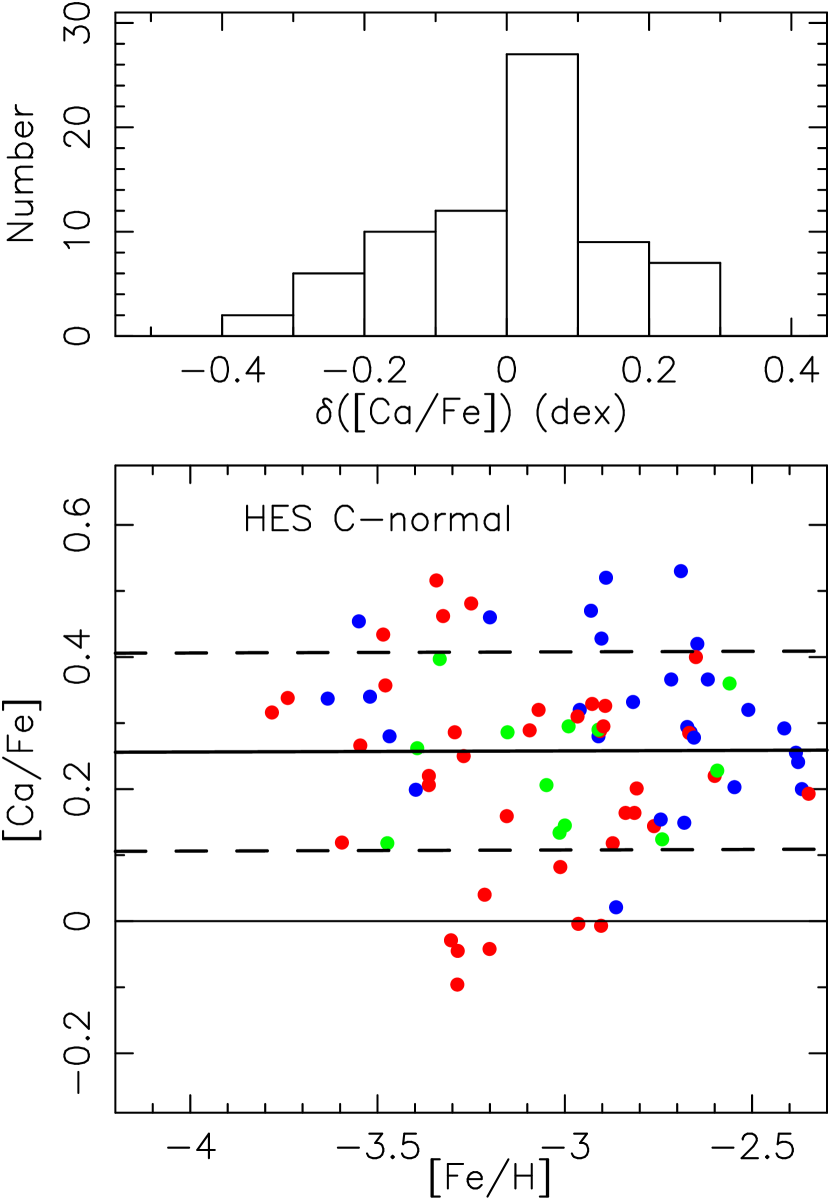
Fig. 1 shows [Ca/Fe] vs [Fe/H] for our sample. Linear fits to the abundance ratios vs [Fe/H] where there is adequate data for the species X were calculated, excluding C-rich stars and a small number of strong outliers. An example of these fits is shown for Ca in Fig 2, where in the lower panel the included stars are shown together with the fit (thick solid line) and the fit 0.15 dex (dashed lines). Note that the fit for [Ca/Fe] vs [Fe/H] is constant, [Ca/Fe] = 0.26 dex. In the upper panel the histogram of deviations from the linear fit is shown. Although a number of very deviant low outliers were excluded, an assymetric distribution of ([Ca/Fe]) still remains, suggesting the presence of a small tail of stars with low [Ca/Fe], though not so extreme that the stars were rejected as strong outliers. This is also apparent in the lower panel, where there are four stars with [Ca/Fe] ; these values were not low enough for them to be rejected as strong outliers. Current work focuses on determining whether the dispersion about these fits is larger than the expected uncertainties.
There are six stars which are very deviant low outliers in [Ba/Fe]. One of these has [Ba/H] below that of Draco 119, the star with the lowest Ba abundance previously known (Fulbright, Rich & Castro, 2004).
References
- Beers & Christlieb (2005) Beers, T. C. & Christlieb, N., 2005, ARA&A, 43, 531
- Cayrel et al (2004) Cayrel, R. et al, 2004, A&A, 416, 1117
- Christlieb (2003) Christlieb, N., 2003, Rev. Mod. Astron., 16, 191
- Cohen et al (2004) Cohen, J. G.,et al, 2004, ApJ, 612, 1107
- Cohen et al (2006) Cohen, J., McWilliam, A., Shectman, S., Thompson, I., Christlieb, N., Ramírez, S., Swenson, A. & Zickgraf, F. J., 2006, AJ, 132, 137
- Fulbright, Rich & Castro (2004) Fulbright, J., Rich, R. M. & Castro, S., 2004, ApJ, 612, 447
- Wisotzki et al (2000) Wisotzki, L., Christlieb, N., Bade, N., Beckmann, V., Köhler, T., Vanelle, C. & Reimers, D., 2000, A&A, 358, 77