Broadband study of GRB 091127: a sub-energetic burst at higher redshift?
Abstract
GRB 091127 is a bright gamma-ray burst (GRB) detected by Swift at a redshift =0.49 and associated with SN 2009nz. We present the broadband analysis of the GRB prompt and afterglow emission and study its high-energy properties in the context of the GRB/SN association. While the high luminosity of the prompt emission and standard afterglow behavior are typical of cosmological long GRBs, its low energy release (31049 erg), soft spectrum and unusual spectral lag connect this GRB to the class of sub-energetic bursts. We discuss the suppression of high-energy emission in this burst, and investigate whether this behavior could be connected with the sub-energetic nature of the explosion.
Subject headings:
gamma-ray bursts: individual (GRB 091127)1. Introduction
It is well established that (most) long duration GRBs are linked to the gravitational collapse of massive stars (Woosley & Bloom, 2006). Such a connection is supported by several lines of evidence (Hjorth & Bloom, 2011, and references therein). In a few remarkable cases the spectroscopic identification of a broad line Type Ic SN, co-spatial and coeval with the GRB, provided a direct proof of the physical association between the two phenomena.
With the exception of GRB 030329, whose properties are roughly similar to typical long GRBs (Berger et al., 2003), GRBs with spectroscopically confirmed SNe show a peculiar behavior, both in their prompt and afterglow emission phases (Kaneko et al., 2007; Starling et al., 2011). These bursts are characterized by a relatively softer spectrum (120 keV), and a lower energy output (Eγ,iso1048-1050 erg) than standard GRBs. They do not strictly follow the lag-luminosity relation (Norris, 2002), whereas they generally agree with the Amati relation (Amati et al., 2007), but with GRB 980425 being a notable outlier. Sub-energetic nearby bursts tend to show a faint afterglow emission, both in X-rays and in the optical band. Late time radio monitoring of their afterglows showed evidence of a quasi-spherical and only mildly relativistic ( 2) outflow (Soderberg et al., 2006), very different from the highly relativistic and collimated jets observed in long GRBs (Bloom et al., 2003; Molinari et al., 2007; Cenko et al., 2010). For these reasons it has been speculated that sub-energetic events belong to an intrinsically distinct population of bursts which dominate the local () rate of observed events (Liang et al., 2007; Chapman et al., 2007).
Whereas the case for spectroscopically confirmed SNe remains confined to nearby GRBs, at higher redshifts () the emergence of the associated SN is pinpointed by a late-time optical rebrightening or “bump” in the afterglow light curves (Bloom et al., 1999; Zeh et al., 2004; Tanvir et al., 2010). Though alternative explanations for such a feature are plausible (Esin & Blandford, 2000; Waxman & Draine, 2000), a spectroscopic analysis of some of these SN bumps supports their similarity with bright Type Ic SNe (e.g. Della Valle et al., 2006; Sparre et al., 2011). This is the case of GRB 091127, detected by the Swift satellite (Gehrels et al., 2004) at a redshift of 0.49, and associated with SN2009nz. Cobb et al. (2010) identified in the GRB afterglow a late-time optical rebrightening, peaking at a magnitude of = 22.30.2 mag at 22 d after the burst, and attributed it to the SN light. The photometric properties of SN2009nz resemble SN1998bw (Galama et al., 1998), though displaying a faster temporal evolution and a slightly dimmer peak magnitude. More recently, the spectroscopic analysis presented by Berger et al. (2011) uncovered the typical undulations of broad line Type Ic SNe associated with nearby GRBs, thus confirming the SN origin of the photometric bump. Berger et al. (2011) concluded that the explosion properties of SN2009nz (EK21051 erg, Mej1.4 M⊙, and MNi0.35 M⊙) are remarkably similar to SN2006aj (Pian et al., 2006), associated with GRB 060218. GRB 091127 therefore represents one of the best cases linking long GRBs and SNe at redshifts 0.3.
While previous works mainly focused on the properties of SN2009nz and its environment (Cobb et al., 2010; Vergani et al., 2011), in this paper we present a broadband analysis of the GRB prompt and afterglow emission and study the high-energy properties of the explosion in the context of GRB/SN associations. Being a bright and relatively nearby burst, GRB 091127 has a rich multi-wavelength coverage up to very late times, which allows us to study in detail its spectral and temporal evolution (see also Filgas et al., 2011) and compare it to other well-known cases of GRBs/SNe.
The paper is organized as follows:
our observations are detailed in 2.
In 3 we present a multi-wavelength timing and spectral analysis
of both the prompt and the afterglow emission;
our results are presented in § 4
and discussed in 5.
Finally, in 6 we summarize our findings and conclusions.
Throughout the paper, times are given relative
to the Swift trigger time T0, t=T-T0,
and the convention
has been followed, where the energy index is related to the
photon index = .
The phenomenology of the burst is presented in the observer’s time
frame. Unless otherwise stated,
all the quoted errors are given at 90% confidence level for one interesting
parameter (Lampton et al., 1976).
2. Observations and Data Reduction
GRB 091127 triggered the Swift Burst Alert Telescope (BAT; Barthelmy et al. 2005) at 23:25:45 UT on 2009 November 27 (Troja et al., 2009). It was also observed by Konus-Wind, Suzaku Wide-band All-sky Monitor (WAM), and the Fermi Gamma-Ray Burst Monitor (GBM). The burst was within the field of view of the Fermi Large Area Telescope (LAT; Atwood et al. 2009), at an angle of 25∘ from the boresight.
The 2-m Liverpool Telescope (LT) responded robotically to the Swift alert and began observing at 23:28:06 UT, 141 s after the BAT trigger. The detection mode of the automatic LT GRB pipeline (Guidorzi et al., 2006) identified a bright optical afterglow ( mag) at , (J2000) (uncertainty of ; Smith et al. 2009). Observations were obtained with filters until hours post burst. The afterglow was monitored with both the Faulkes Telescope South (FTS) and LT up to 6 days post-burst within the filters. Magnitudes of field stars in were calibrated using Landolt standard stars (Landolt, 1992) obtained during following photometric nights. SDSS magnitudes of the same field stars were obtained using the transformations by Jordi et al. (2006). Early time observations were also obtained using SkycamZ, mounted on the LT tube. Observations are filter-less (white light) to maximize the throughput of the optics. The data were dark and bias subtracted in the usual fashion and flat fielded using a stack of twilight exposures. Standard aperture photometry was carried out using two local reference stars, and calibrated by comparison with R band frames of the same field.
Due to an Earth limb constraint, Swift did not immediately slew to the burst location and follow-up observations with its two narrow field instruments, the X-Ray Telescope (XRT; Burrows et al., 2005) and the Ultra-Violet Optical Telescope (UVOT; Roming et al., 2005), began 53 min after the trigger. As the X-ray afterglow was still bright (10 cts s-1), XRT started collecting data in Windowed Timing (WT) mode, and automatically switched to Photon Counting (PC) mode when the source decreased to 2 cts s-1. Follow-up observations monitored the X-ray afterglow for 36 d for a total net exposure of 760 s in WT mode and 470 ks in PC mode. The optical afterglow was detected by UVOT in the White, , , , and filters at a position consistent with the LT localization. The detection in the UV filters is consistent with the low redshift =0.49 of this burst. Swift/XRT and UVOT data were reduced using the HEASOFT111http://heasarc.gsfc.nasa.gov/docs/software/lheasoft/ (v6.11) and Swift software (v3.8) tools and latest calibration products. We refer the reader to Evans et al. (2007) for further details on the XRT data reduction and analysis. The UVOT photometry was done following the methods described in Breeveld et al. (2010) with adjustments to compensate for the contamination of a nearby star.
In order to monitor the late time X-ray afterglow,
two Target of Opportunity observations were performed
by the Chandra X-Ray Observatory
at t=98 d for a total exposure of 38 ks and t=188 d
for a total exposure of 80 ks.
Chandra data were reduced
using version 4.2 of the CIAO software. Source events were extracted from a 2 pixel radius
region around the GRB position, while the background
was estimated from a source-free area using a 20 pixel radius region.
3. Data analysis
3.1. Gamma-ray data
3.1.1 Temporal analysis
Figure 1 presents the prompt emission light curves with a 128 ms time resolution and in four different energy bands. The burst duration, defined as the interval containing 90% of the total observed fluence, is (15-350 keV)=7.10.2 s. The burst temporal profile is characterized by two main peaks, at t0 s and t1.1 s, respectively. They are clearly detected up to 600 keV and display a soft-to-hard spectral evolution. A period of faint, spectrally soft emission lasting 8 s, follows. On top of it a third peak at t7 s is visible at energies below 50 keV.
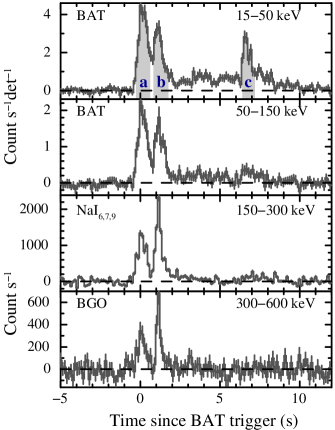
Spectral lags were calculated by cross-correlating the light curves in the standard BAT channels: 1 (15-25 keV), 2 (25-50 keV), 3 (50-100 keV), 4 (100-350 keV). In order to increase the signal-to-noise in the higher energy channels, the analysis was performed on non mask-weighted lightcurves, each with a 8 ms time resolution. We derived 2.2 ms and 9.2 ms, where the quoted uncertainties (at a 1 confidence level) were evaluated by simulations. Lag analysis reveals a significant difference between the two main -ray peaks ( and in Fig. 1). The former shows positive lags, 36 ms and 16 ms, while the latter has negligible or negative lags, 2 ms and 14 ms.
3.1.2 Search for high-energy -ray emission
The Fermi/LAT data were searched for emission during the prompt -ray phase and over longer timescales (up to 10 ks). The searches were performed by means of an unbinned likelihood analysis (Abdo et al., 2009). We used the Pass7V6 Transient class events with a reconstructed energy above 100 MeV. We selected events within 12 degrees around the best burst position (see §2), and applied a cut on zenith angle at 105∘ in order to limit the contamination from the bright Earth’s limb. For the Transient data class the dominant background component is the isotropic background due to residual charged particles misclassified as -rays. We modeled it by using the tool developed by the LAT collaboration that can predict the hadronic cosmic ray and -ray components of the background with an accuracy of 10-15% (Abdo et al., 2009). We also added the template gal_2yearp7v6_v0.fits222 Available at the Fermi Science Support Center web site http://fermi.gsfc.nasa.gov/ssc/data/access/lat/BackgroundModels.html describing the Galactic diffuse emission due to the interaction of cosmic rays with the gas and the interstellar radiation field.
No significant excess above background was found. Following the procedure described in Abdo et al. (2009) and by fixing the photon index to 2.25, we derived a 95% upper limit of 2.810-8 erg cm-2 s-1 in the 100 MeV-1 GeV energy range and of 1.610-8 erg cm-2 s-1 in the 1 GeV-10 GeV energy range during the prompt emission interval (-0.3 st8.2 s).
3.1.3 Spectral analysis
We performed a time-averaged and a time-resolved spectral analysis, selecting the time intervals in correspondence of the three main pulses as shown in Figure 1 (top panel). The spectral fits were performed in the 15-150 keV energy band for BAT, 20 keV-10 MeV for Konus-Wind, and 120 keV-3 MeV for Suzaku-WAM. Following Sakamoto et al. (2010) we added a 5% systematic error in the WAM spectra below 400 keV. The intercalibration between BAT, Konus-Wind and Suzaku-WAM was extensively studied by Sakamoto et al. (2010), showing an overall agreement in the effective area correction (20%) between the three instruments. GBM data were fit in the 8-860 keV band for the NaI detectors, and in the 200 keV-40 MeV for the BGO detector. Given the brightness of this burst we added a 5% systematic error to the GBM data, needed to improve the fit acceptance of the time-averaged analysis. A cross-calibration study has not been performed with the Fermi data yet. Previous works (e.g. Page et al., 2009) report a typical effective area correction factor of 1.23 compared to a value of unity for BAT, and in our analysis we found consistent values.
The best fit spectral parameters were estimated using the maximum likelihood method and, when necessary, by applying different statistics to the data. BAT mask-weighted spectra have Gaussian distributed uncertainties, and they require the statistics to be applied. LAT spectra are instead characterized by low counts, and they can only be modeled using the Poisson distribution. In order to properly account for the Poissonian nature of the source counts and for the Gaussian uncertainties associated to the LAT background model (Abdo et al., 2009), we used the profile likelihood statistic as implemented in the option PGSTAT of XSPEC (Arnaud et al., 2011). Table 1 reports the spectral fit results for the time-averaged analysis. Different spectral models, usually adopted to describe the GRB prompt emission spectrum, were fit to the data: a power-law (PL), a power-law with a high-energy cut-off (CPL; ), a Band model (Band et al., 1993), and a Band model with a high energy cut-off (Band+Cut). We also included the log-parabolic function (LOGP; ) suggested by Massaro et al. (2010). The last column of Table 1 reports the fit statistics (STAT) and degrees of freedom (d.o.f.) for each model. In general STAT=, when LAT data were included in the fit STAT=+PGSTAT.
| Detector | Model | Epk (keV) | Ecut (keV) | STAT/d.o.f | ||
|---|---|---|---|---|---|---|
| BAT | PL | 2.170.07 | – | – | – | 52/57 (0.91) |
| KW | PL | 2.190.04 | – | – | – | 74/59 (1.26) |
| KW | CPL | 2.000.10 | – | – | 510 | 57/58 (0.98) |
| WAM | PL | 2.35 | – | – | – | 23/25 (0.90) |
| WAM | CPL | 1.90.5 | – | – | 400 | 20/24 (0.85) |
| GBM | LOGP | 0.730.14 | 0.370.04 | – | – | 465/396 (1.18) |
| GBM | Band | 1.200.16 | 2.230.04 | 395 | – | 457/395 (1.16) |
| GBM | Band+Cut | 0.3 | 1.940.08 | 25 | 500 | 448/394 (1.14) |
| GBM+LAT | LOGP | 0.730.14 | 0.370.04 | – | – | 468/398 (1.18) |
| GBM+LAT | Band | 1.340.16 | 2.320.06 | 455 | – | 485/397 (1.21) |
| GBM+LAT | Band+Cut | 0.6 | 1.96 | 26 | 530 | 450/396 (1.14) |
| JOINT | LOGP | 0.81 | 0.350.04 | – | – | 632/544 (1.16) |
| JOINT | Band | 1.370.12 | 2.310.05 | 454 | – | 640/543 (1.18) |
| JOINT | Band+Cut | 1.06 | 2.07 | 36 | 800 | 602/542 (1.11) |
| Detector | Model | Epk (keV) | Ecut (keV) | STAT/d.o.f | ||
| Time interval a: from T00.3 s to T0+0.7 s | ||||||
| BAT | PL | 1.910.10 | – | – | – | 59/57 (1.03) |
| WAM | PL | 2.42 | – | – | – | 39/34 (1.15) |
| WAM | CPL | 1.890.5 | – | – | 600 | 33/33 (1.00) |
| GBM | LOGP | 0.017 | 0.540.02 | – | – | 313/270 (1.16) |
| GBM | Band | 0.540.16 | 2.270.07 | 565 | – | 257/269 (0.95) |
| GBM | Band+Cut | 0.4 | 1.970.17 | 546 | 600 | 247/268 (0.92) |
| GBM+LAT | LOGP | 0.019 | 0.550.02 | – | – | 314/272 (1.15) |
| GBM+LAT | Band | 0.600.15 | 2.320.06 | 595 | – | 266/271 (0.98) |
| GBM+LAT | Band+Cut | 0.4 | 1.970.17 | 546 | 600 | 248/270 (0.92) |
| JOINT | LOGP | 0.021 | 0.540.02 | – | – | 413/365 (1.13) |
| JOINT | Band | 0.630.13 | 2.340.06 | 595 | – | 369/364 (1.01) |
| JOINT | Band+Cut | 0.41 | 2.020.11 | 535 | 700 | 344/363 (0.95) |
| Time interval b: from T0+0.8 s to T0+1.7 s | ||||||
| BAT | PL | 1.780.12 | – | – | – | 52/57 (0.92) |
| WAM | PL | 2.380.11 | – | – | – | 34/34 (1.00) |
| WAM | CPL | 1.8 | – | – | 1000 | 28/33 (0.87) |
| GBM | LOGP | 0.350.16 | 0.380.05 | – | – | 263/270 (0.97) |
| GBM | Band | 1.22 | 2.23 | 14030 | – | 257/269 (0.95) |
| GBM | Band+Cut | 1.22 | 2.13 | 14030 | 900 | 257/268 (0.96) |
| GBM+LAT | LOGP | 0.330.15 | 0.370.05 | – | – | 263/272 (0.97) |
| GBM+LAT | Band | 1.310.06 | 2.6 | 17030 | – | 256/271 (0.94) |
| GBM+LAT | Band+Cut | 1.300.07 | 2.520.17 | 17030 | 700 | 252/270 (0.93) |
| JOINT | LOGP | 0.29 | 0.380.04 | – | – | 366/364 (1.00) |
| JOINT | Band | 1.320.06 | 2.51 | 170 | – | 361/363 (0.99) |
| JOINT | Band+Cut | 1.29 | 2.340.12 | 160 | 1000 | 356/362 (0.98) |
Additional models, not reported in Table 1, were tested. A single-temperature black body plus a power-law yields a poor fit (STAT/d.o.f=905/574), the addition of a high-energy cut-off significantly improves the fit (STAT/d.o.f=675/573), but the model is not statistically preferred to the standard Band function with a high energy cut-off (STAT/d.o.f=652/573). A multicolor black body (Ryde et al., 2010) gives similar results.
Table 2 reports the results of the time-resolved spectral analysis for both intervals and . As found for the time-integrated spectrum, alternative models do not provide an improvement in the fit statistics and are not reported in the table.
The spectrum of the third peak (interval in Fig. 1) is well described by a power law of photon index =2.780.18. The average observed flux during this interval is 810-7 ergs cm-2 s-1 in the 15-50 keV band.
3.2. X-ray data
The XRT light curve is well described (/d.o.f.=376/364) by a power law decay with slope =1.030.04 steepening to =1.550.03 at =32 ks. The two Chandra detections lie slightly above the extrapolation of this model, but are consistent with it within 3 . This constrains the time of any late-time jet-break in the X-ray light curve to t115 d. This time was determined by forcing in the fit an additional break with =1, and by varying the break time until a =2.706 was reached.
During our observations a slight soft-to-hard spectral evolution is visible over the first few hours. We performed time-resolved spectral fits on seven consecutive time intervals, selected according to the light curve phases and to have 1000 net counts each. The X-ray spectra were modeled with an absorbed power law. We derived an intrinsic NH=91020 cm-2 at =0.49, in excess of the Galactic value of 2.81020 cm-2 (Kalberla et al., 2005). The resulting photon indices , ranging from 2.020.10 to 1.820.09, are consistent within the uncertainties, however a systematic trend of a slowly decreasing X is evident. The time-averaged photon index is =1.880.08.
Because of the low number of events in the Chandra spectrum (67 net counts) we used the Cash statistics (Cash, 1979) and fit it with an absorbed power law by fixing the absorption components to the values quoted above. The resulting photon index is =1.60.3, from which we calculate an energy conversion factor of 1.110-11 ergs cm-2 count-1.
3.3. Optical data
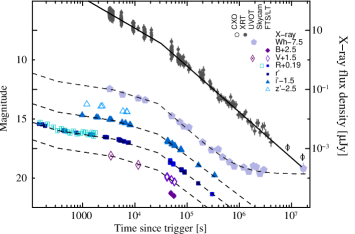
Figure 2 shows the X-ray afterglow light curve, reporting the XRT (filled circles) and Chandra (open circles) data, and the optical afterglow light curves, including data from UVOT, LT, FTS, and SkycamZ. The best fit models are also shown (X-ray: solid line; optical: dashed lines).
The UVOT/White light curve is well described by a broken power law plus a constant that accounts for the host galaxy emission. The afterglow initially decays with a slope of 0.560.04, steepening to 1.570.05 after 29 ks. We estimate a host galaxy contribution of 23.40.15 mag.
A significant afterglow color evolution (0.25 mag) over the course of the first night was reported by Haislip et al. (2009). In the fit of the multicolor light curves we initially allowed for frequency-dependent slopes and/or temporal breaks, but the sparse sampling in the B, V, and z′ filters does not allow us to detect any color variation. As we found consistent results between the different filters, we performed a joint fit of the BVRr′i′z′ light curves by leaving the normalizations free to vary and tying the other model parameters. The best fit model requires three temporal breaks (/d.o.f.=53/70). The model parameters are: =0.580.12, =330 s, =0.270.01, =4.1 ks, =0.550.10, =28 ks, =1.340.04. Contamination from the SN-bump and the host galaxy light, not detected in the early-time LT exposures, may explain the shallower temporal index at late times. By including in the fit a constant component with magnitude I=22.540.10 to account for the host emission and a SN-like bump, based on the observation of Cobb et al. (2010), the afterglow slope steepens to =1.640.06.
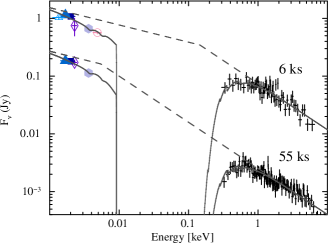
3.4. Spectral energy distribution
An optical-to-X-ray spectral energy distribution (SED) was produced at two different times, 6 ks and 55 ks, selected because of the good color information and in order to study the spectral evolution across the achromatic temporal break at 30 ks. Two X-ray spectra were produced, the former in the pre-break interval 9-20 ks, the latter in the post-break interval 50-1000 ks, and scaled to match the observed count-rate at each time of interest. The two SEDs were jointly fit in count space (Starling et al., 2007) either with a power law or a broken power law continuum. In the latter case the two spectral slopes were tied so to obey the standard afterglow closure relations. Two dust and gas components, modeling the Galactic and intrinsic host extinction and absorption, were also included in the fit. We assumed a Solar metallicity for the absorption components and constrained them to the values derived from the XRT spectral fits. We tested three canonical laws – Milky Way (MW), Small Magellanic Cloud (SMC), and Large Magellanic Cloud (LMC) – for the host galaxy extinction by using the parameterization of Pei (1992).
The resulting fit is shown in Figure 3. Both SEDs are well described (=146 for 168 d.o.f.) by a broken power law with indices =0.300, =+0.5=0.800 and a decreasing break energy of =0.150.03 keV at 6 ks and =6 eV at 55 ks. A LMC-type extinction with =0.0360.015 mag is only slightly preferred (2) to a MW-type or a SMC-type law.
4. Results
4.1. Prompt emission properties
4.1.1 Spectral lags
A common property of long GRBs is that soft energy photons are delayed with respect to the higher energy ones. The measurement of such lags is a valuable tool in the study of GRBs and their classification (e.g. Gehrels et al., 2006). Systematic studies of BATSE and Swift bursts show that long GRBs predominantly have large, positive lags, ranging from 25 ms to 200 s (Norris, 2002; Norris et al., 2005; Ukwatta et al., 2010), while negligible lags are characteristic of short-duration bursts (Norris & Bonnell, 2006; Gehrels et al., 2006) and high-luminosity long GRBs (Norris, 2002).
The prompt emission of GRB 091127 seems not to fit in this classification scheme. We measured a small spectral lag of 2.2 ms, consistent with zero, in the BAT channels 3-1, and a negative lag of 9.2 ms in the BAT channels 4-2. The burst position in the lag-luminosity plane is shown in Figure 4, where we also report data for short and long GRBs from the literature (Gehrels et al., 2006; McBreen et al., 2008). Having a negligible lag and only a moderate isotropic peak luminosity (51051 ergs s-1), GRB 091127 does not follow the trend of cosmological long GRBs, analogously to under-luminous bursts such as GRB 980425. Nearby sub-energetic bursts (with or without an associated SN) are outliers of the lag-luminosity relation (thick dashed line). The inclusion of GRB 091127 suggests that instead of simply being outliers, there might be a population of bursts following a distinct trend (thin dashed line). While a larger sample of nearby bursts is needed to test this hypothesis, an immediate result coming from Figure 4 is that GRB 091127, which is securely associated with a massive star progenitor, intercepts the bright end of the short GRB population, showing that the scatter of long GRBs in the lag-luminosity plane is larger than previously thought.
In the case of GRB 091127, thanks to the GRB low redshift and low intrinsic extinction, the associated SN was easily revealed by ground-based follow-up observations (Cobb et al., 2010; Berger et al., 2011), nailing down the nature of the GRB progenitor. However, had the same GRB occured at a higher redshift, its classification would mostly rely on its high-energy properties. At the faint soft emission would be under the BAT detection threshold, and the GRB would appear as a zero lag, intrinsically short (2 s) burst, similar to GRB 080913 and GRB 090423 for which a merger-type progenitor was also considered (e.g. Zhang et al., 2009). It is also possible that some of the higher redshift short-duration bursts arise from massive star collapses (e.g. Virgili et al., 2011).
4.1.2 Softening of the high-energy spectrum
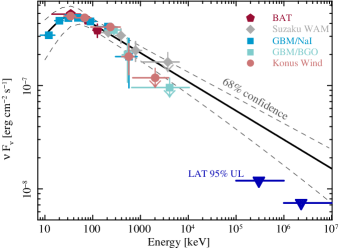
Fitting results are listed in Table 1 for the time-averaged spectrum and in Tab. 2 for the time-resolved analysis. By describing the time-integrated spectrum with the canonical Band function we obtained typical parameters: 1.3, 2.3 and a soft peak energy of 45 keV. However by extrapolating the best fit Band model to the LAT energy range, the predicted flux in the 100 MeV – 1 GeV energy band is 10-7 ergs cm-2 s-1, well above the 95% upper limit derived in § 3.1.2. This is shown in Figure 5, where we report the observed data with their best fit Band model extrapolated to the LAT energy range.
The joint fits reported in Table 1 confirm that Fermi/LAT observations are not consistent with the extension of a Band function from low to high energies, but require a steepening of the spectrum at energies below 100 MeV. The inclusion of a high-energy spectral break, that we modelled as an exponential cut-off, improves the fit (-STAT38 for one additional degree of freedom). Such a break is particularly evident in the Konus-Wind and in the GBM spectra, and we note that the two fits yield consistent values of the cut-off energy and an improvement in the fit statistic of =14 and =9 respectively. The quality of the data does not allow us to constrain the spectral index above the break energy and distinguish between a steepening of the power-law decay or an exponential cut-off. By modeling the high-energy data with a simple power-law we derive a photon index of 3.6, and set an upper limit 2.6 (90% confidence level). The significance of the high-energy break was tested by simulating 10,000 spectra with a simple Band shape. We jointly fit each set of spectra with a Band function (our null model) and a Band function with an exponential cut-off (the alternative model). The fractional number of simulations in which -STAT38 gives the chance probability that a high-energy spectral break improves the fit. None of the simulations showed a variation of the statistics as high as the one observed, confirming that the presence of a spectral break is statistically preferred at a 99.99% level.
The log-parabolic model of Massaro et al. (2010) also provides a better fit than the standard Band function (STAT/d.o.f=679/575 vs. 690/574), and naturally accounts for the observed suppression of the high-energy emission.
A time-resolved spectral analysis temporally localizes the spectral break during the first -ray peak (interval ). In this case the presence of a cut-off at energies 500-1000 keV decreases the fit statistics of -STAT=25. The lower significance with respect to the time-averaged analysis is likely due to the lack of Konus-Wind data in this fit, however the observed break is evident both in the WAM and in the GBM spectra at a folding energy Ecut consistent between the different instruments. According to this model, the observed fluence during the first peak is (4.30.6)10-6 erg cm-2 in the 8-1000 keV energy band. At a redshift =0.49 this corresponds to an isotropic equivalent energy =(3.50.5)1051 erg in the 1-10,000 keV rest-frame energy band. In this time interval the derived value of the low-energy index is =0.41, which is harder but marginally consistent with the limit of 2/3 imposed by the optically thin synchrotron emission. The presence of a thermal component is sometimes invoked to explain the hardest low-energy spectral indices (e.g. Ghirlanda et al., 2003). As already noted in § 3.1, we tested this hypothesis and found that in no case does the inclusion of a black-body (single or multi-temperature) yield a significant improvement in the fit statistics, although such a component is not inconsistent with the data.
The spectrum of the second peak (interval ) can be well described by a Band function. The inclusion of the LAT data yields a steeper high-energy spectral slope than the one derived from the GBM only fit, and the addition of a high-energy break is not required by the data. According to this model, the observed fluence during this interval is (4.50.2)10-6 erg cm-2 in the 8-1000 keV energy band, corresponding to an isotropic equivalent energy =(4.30.3)1051 erg in the 1-10,000 keV rest-frame energy band.
4.2. Afterglow properties
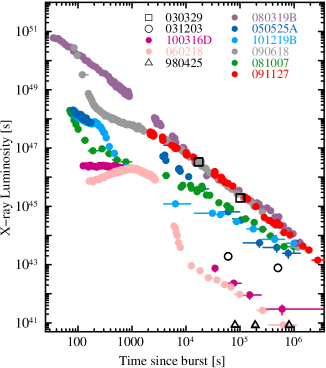
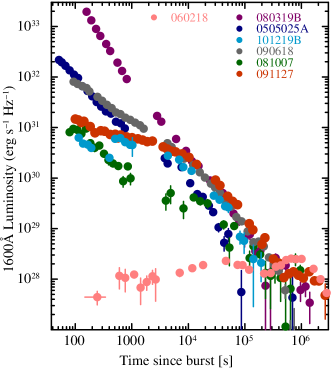
In Figure 6 we compare the afterglow of GRB 091127 to the sample of Swift GRBs with bona fide SN associations (Hjorth & Bloom, 2011). The observed XRT and UVOT light curves were corrected for redshift and absorption effects, and shifted to a common rest-frame energy band of 0.3-10 keV (XRT) and a rest-frame wavelength of 1600 Å (UVOT; Oates et al. 2009). From an afterglow perspective, GRB 091127 resembles the behavior of typical long GRBs, dominated by the bright emission from the external forward shock, rather than the unusual evolution of nearby GRBs. The isotropic X-ray luminosity at t=11 hr is 21045 erg s-1, very similar to GRB 030329, and a factor of 103 brighter than GRB 031203 and other GRBs/SNe. The UV/optical afterglows appear instead to decay more rapidly and to cluster at late times, but this could be the result of an observational bias, as the chance of discovering a supernova is higher if the optical afterglow is faint.
If the afterglow emission of GRB 091127 is mainly synchrotron radiation from the external forward shock, its broadband behavior has to obey the fireball model closure relations (e.g. Zhang & Mészáros, 2004). We found that the GRB afterglow is roughly consistent with a model of a narrow jet expanding into a homogeneous surrounding medium. Our results agree well with previous studies (Vergani et al., 2011; Filgas et al., 2011). The fireball model describes the emission from a population of accelerated electrons with energy distribution . From the afterglow spectral properties we derive an electron index =1.60, which is at the lower end of the distribution but not uncommon (Panaitescu & Kumar, 2002). An achromatic break is detected at 8 hr, after which the X-ray and optical light curves decay with a similar slope of 1.6. This behavior is suggestive of an early jet-break. The presence of a jet-break at early times is also supported by our Chandra observations, which do not show evidence of a steepening in the X-ray light curve several months after the burst. We found that any possible late time jet-break is constrained to t115 d, which, for typical parameters, would imply an unusually large opening angle 30∘. Instead the two Chandra points hint at a shallower decline, as expected for example in the transition to the non-relativistic phase (Piro et al., 2001).
The SED analysis (§ 3.4) shows that optical and X-ray data belong to
different branches of the synchrotron spectrum, since
the cooling frequency lies between the two energy bands.
The observed break at 30 ks is therefore not connected to spectral variations
or changes in the ambient density.
Figure 3 shows that at 6 ks the lowest optical flux produced
by the X-ray source (with just below X-rays) would be only a factor 2
lower than measured, thus the reverse shock contribution to the total optical flux
(Kobayashi, 2000) is negligible and optical and X-ray
emission mainly arise from the
same source (external forward shock).
In this framework, the evolution of the cooling frequency
is tied to the observed X-ray and optical decays by
the following relation (Panaitescu et al., 2006):
| (1) |
This is consistent with our spectral fits, which measure a cooling frequency that is rapidly moving downwards in energy as , as independently found in Filgas et al. (2011). For constant microphysical parameters, a decreasing suggests an ISM environment rather than a wind-like density profile, where the cooling frequency is expected to increase with time. In a uniform density medium, the cooling break evolves as for a spherical expansion, and as in the jet spreading phase (Panaitescu & Kumar, 2002, 2004). For constant microphysical parameters and no energy injection into the blastwave, the expected decay is shallower than the observed one. This shows that the simplest version of the fireball model can not account for the overall afterglow behavior, and, as we will discuss in Sect. 5.2, some modifications (e.g. energy injection or evolving microphyscal parameters) are required.
5. Discussion
5.1. Origin of the high-energy spectral break
The most recent Fermi observations of GRBs suggested that the prompt -ray emission can be satisfactorily described by a smoothly broken power law, the Band function, extending to the GeV energies, often accompanied by an additional non-thermal component modeled as a power law (Zhang et al., 2011). In this burst we found that a standard Band function, though providing an adequate description of the spectrum in the keV energy range, is in contrast with the simultaneous Fermi/LAT observations as it overpredicts the observed emission above 100 MeV (see Fig. 5). The spectral fits presented in Table 1 and Table 2 detect the presence of a spectral softening at 0.5-1 MeV in the time-integrated spectrum and during the first peak of emission. This disfavors spectral evolution as the origin of the observed feature.
A steepening of the high-energy spectral slope could be caused by several factors such as absorption from the extragalactic background light (EBL), attenuation via pair production () or an intrinsic break in the energy distribution of the emitting electrons. Based on the low redshift of this burst (=0.49) and the low energy of the observed break, EBL absorption can be excluded (see e.g. Finke et al., 2010). Below we consider in turn the other possibilities.
Optical depth effects –
The lack of high-energy photons in bright bursts such as GRB 091127
could be an indication of a pair opacity break (Beniamini et al., 2011),
and therefore used to constrain the outflow Lorentz factor (Lithwick & Sari, 2001).
In order to be self-consistent these calculations rely on the fundamental
assumption that the observed sub-MeV spectrum extrapolates to GeV energies.
Following this line of argument, we can set a first upper limit on the
bulk Lorentz factor in GRB 091127 just by considering its non-detection by LAT.
We use here the Band function parameters and impose 100 MeV:
| (2) |
where =2.28 is the high-energy spectral slope and 0.1 ph cm-2 s-1 keV-1 the observed flux density at 100 keV, both derived from the spectral fit in Tab. 1. The variability timescale was set to tv0.3 s, the minimum value observed in the -ray lightcurve. In deriving Eq. 2 we approximated the spectral shape with a simple power-law, . Given that for =100 MeV the typical energy of the target photons is 1 MeV , the effects of low-energy spectral curvature (Baring & Harding, 1998) can be considered negligible and a simple power-law decay is a valid approximation.
The upper limit derived in Eq. 2 is based on the simple formulation given in Lithwick & Sari (2001), where spatial and temporal dependencies are averaged out. More realistic calculations taking into account the progressive buildup of the radiation field further decrease the above value by a factor of 2-3 (Hascoët et al., 2011), that is 50. This is significantly lower than the values estimated for cosmological GRBs (Molinari et al., 2007; Liang et al., 2010), though similar to the Lorentz factor inferred for X-ray flares (Abdo et al., 2011). If we now take into account the observed steepening at 1 MeV as it originates from an increase in the optical depth, by setting we get 2. Such a low Lorentz factor, though atypical for classical GRBs, is not unprecedented (Soderberg et al., 2006). A weakly relativistic outflow could therefore account for the lack of high-energy photons, and the observed soft spectrum, but not for the bright afterglow detected a few minutes after the burst.
An independent estimate of the bulk Lorentz factor can be derived from afterglow observations. The duration of the GRB being rather short, we consider the thin shell case (Kobayashi et al., 1999). Since the afterglow is already fading in our first observation we can assume that the onset happened at 140 (1+)-1 100 s, and set a lower limit to the outflow Lorentz factor (Piran, 1999):
| (3) |
where Eγ=1052 Eγ,52 erg is the isotropic-equivalent energy, = 0.2 is the radiative efficiency and 1 cm-3 is the medium density (Bloom et al., 2003). By using the empirical relation suggested by Liang et al. (2010), we infer a similar high value of 200.
The limits derived from the prompt and afterglow emission properties are inconsistent: the former suggest a mildly relativistic outflow (, or even 2), the latter a highly relativistic jet (). A possibility that would reconcile the two sets of limits is that the first spectrally softer pulse, during which we detect the significant presence of a spectral break, is instead the GRB precursor originating at 1011 cm, e.g. from the jet cocoon emerging from the progenitor star (Lazzati & Begelman, 2005). A different physical origin could also explain the different lags between the two main -ray events and the unusual lag evolution: while spectral lags in GRB pulses generally tend to increase with time (Hakkila et al., 2008), it has been found that precursors have larger lags than the following -ray emission (Page et al., 2007). Precursors, however, carry only a small fraction of the total energy release (Morsony et al., 2007), while the first peak encloses 50% of the observed -ray fluence.
We therefore are led to consider that our assumption of
a pair opacity break is not valid, that is:
1) the inconsistency between Eq. 2 and Eq. 3
implies that the Band-type spectrum does not extend
to GeV energies, but a spectral break
(not related to optical depth effects)
below 100 MeV is required by the data;
2) we identify this break with the steepening at 0.7 MeV,
which is therefore an intrinsic feature
of the GRB spectrum.
Breaks in GRB spectra – We discuss here the standard scenario, in which internal shocks within the expanding outflow accelerate the ambient electrons to relativistic energies with a power-law distribution . The GRB prompt emission originates as synchrotron radiation from the shock-accelerated electrons. The small ratio between the GeV and keV fluences of this burst, , disfavors Synchrotron Self Compton as the main radiation mechanism (Piran et al., 2009; Beniamini et al., 2011).
The observed spectrum of the first -ray peak, is roughly in agreement with a fast cooling synchrotron spectrum: the low-energy slope 0.4 is marginally consistent with the maximum slope of 2/3 allowed for , while the high-energy slope 2 suggests that for 50 keV we are already above the injection frequency . It follows that , that is the effects of adiabatic and radiative cooling are comparable (marginal fast cooling; Daigne et al. 2011). In the extreme case 10, synthetic spectra resemble the observed spectral shape: a hard low-energy tail followed by a smooth, flat transition (10 ) to the final decay. The observed steepening at 0.7 MeV from 2 to 2.6 corresponds to this transition, and implies . However when the slow cooling contribution is significant, the radiative efficiency decreases markedly (Daigne et al., 2011), and it is hard to account for the high luminosity and variability of the prompt emission. If we consider the more efficient case of 1, then the spectral break has to be ascribed to a different mechanism.
A spectral cut-off is expected at , where is the maximum Lorentz factor of the shocked electrons. Such a break occurs at energies 200 MeV (Bošnjak et al., 2009), and it is unlikely at the origin of the MeV break. An alternative explanation is an intrinsic curvature in the energy distribution of the radiating electrons (Massaro et al., 2010), arising if the higher energy electrons are accelerated less efficiently than those with lower energy.
5.2. Jet collimation and energetics
From our broadband spectral fits of the prompt emission we derived an isotropic equivalent energy (1.10.2)1052 erg, which is in the typical range of long GRBs (Bloom et al., 2003). The afterglow properties show evidence of a tightly collimated outflow, indicating that the true energy release is significantly lower. The achromatic nature of the break at 30 ks and the subsequent afterglow fast decay are typical signatures of a jet-break, and we first consider this hypothesis. In this scenario the jet opening angle is:
| (4) |
and the collimation-corrected energy is Eγ,j=(3.00.8)1049 erg, at least an order of magnitude lower than typical long GRBs (Cenko et al., 2010). However, as noted in § 4.2, this simple fireball scenario fails to reproduce two main features: 1) the rapid temporal evolution of the cooling frequency; 2) the observed pre-break flux decay rates ( = 1.030.04, = 0.560.04), which are not compatible with the model expectations (0.7, 0.45 for a spreading jet; 0.8 for a non-spreading jet; Panaitescu & Kumar 2004). In order to reconcile the observed afterglow behavior with the theoretical expectations one needs to invoke either a continual energy injection and/or evolving microphysical parameters. The former scenario would require an extreme injection episode, the jet energy increasing by a factor of 100 in the first 8 hours. Furthermore, there is no apparent reason for the injection to end at the time of the jet-break, leading to an even larger shock energy carried by the slower ejecta. The alternative possibility of a growing magnetic energy fraction is discussed by Filgas et al. (2011).
We found instead that a narrow confined jet, whose boundary is visible from the first afterglow measurement (i.e. ), and a prolonged energy injection, lasting until 30 ks, provide a consistent description of the afterglow temporal and spectral properties and ease the energetic burden without requiring any variation of the shock microphysical parameters. For an ISM-like circumburst medium (§ 4.2), the flux decay indices are given by (Panaitescu & Kumar, 2004):
| (5) | |||||
| (6) |
where is the power-law evolution of the forward-shock energy . The above set of equations overconstrain the parameter, thus providing a consistency check of the solution. By substituting in Eq. 5 and 6 the observed pre-break temporal slopes and the value of 1.6 from the broadband spectral fit, we derive =0.480.06 and =0.390.06, respectively. Departures of the energy injection from a pure power law can explain the optical plateau at t5 ks, while the cessation of energy injection at 30 ks yields the observed achromatic break. According to this model, by imposing s in our Eq. 4 we derive 0.6 (/1 cm-3)1/8 deg, and 61047 (/1 cm-3)1/4 erg. By using 0.45, the blastwave kinetic energy can be constrained to 31050 erg, most of which comes from the slower ejecta that are gradually replenishing the forward shock energy.
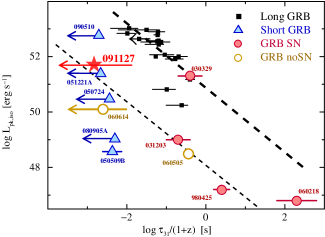
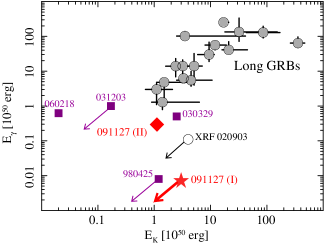
From our analysis the following features clearly emerge: GRB 091127 is characterized by a highly collimated outflow (4∘), a low prompt -ray energy ( 31049 erg), and a total relativistic energy yield of 31050 erg, at the lower end of the long GRBs distribution. In Figure 7 we compare the burst energetics with the sample of long GRBs. Independently from the afterglow model adopted (I, narrow jet + energy injection: star; II, evolving : diamond), the burst location in the lower left corner shows that GRB 091127 more closely resembles the class of X-ray Flashes (XRFs) and GRBs/SNe rather than typical GRBs. This is also consistent with its rather soft spectrum and unusual lags.
6. Summary and Conclusion
We presented a broadband analysis of the prompt and afterglow emission of GRB 091127, securely associated with SN2009nz. Two main features emerged from our study of the prompt emission: 1) the burst is characterized by small, negligible spectral lags; 2) the high energy (100 MeV) emission is significantly suppressed. The GRB has a long duration (7 s), and a relatively soft spectrum (45 keV). However having negligible spectral lags and only a moderate luminosity, the burst does not fit the lag-luminosity relation followed by cosmological long GRBs, but lies in the region of short duration bursts. While the association with SN2009nz leaves no doubts about the origin of the GRB progenitor, the atypical lag behavior adds additional uncertainty in the classification of GRBs based solely on their high-energy properties. It also links GRB 091127 to nearby sub-energetic bursts, such as GRB 980425, which are also outliers of the lag-luminosity relation.
By modeling the GRB prompt emission with the standard Band function, we found that such a model significantly overpredicts the observed flux at higher (100 MeV) energies. Consistently, our spectral fits show evidence of a spectral curvature at energies 1 MeV. If due to opacity effects, the suppression of high energy emission would suggest a low outflow Lorentz factor ( 50, or even 2), as measured in nearby sub-energetic GRBs. However, this interpretation is not consistent with our early-time detection of a bright fading afterglow, which suggests 100. We therefore conclude that the high-energy break is an intrinsic property of the GRB spectrum.
The multi-wavelength afterglow emission is characterized by an achromatic break at 8 hr after the burst, and by a rapidly decaying cooling frequency, t-1.5±0.5. We considered two scenarios to interpret these features within the standard fireball model. The former interprets the achromatic break as a jet-break, from which we derive a jet opening angle 4 deg, and a collimation-corrected energy 31049 erg. This model needs to let the microphysical parameters vary with time in order to reproduce the observed temporal decays and the rapidly decreasing . The latter scenario instead interprets the achromatic break as the end of a prolonged energy injection episode, the jet-break happening before the start of our observations (t140 s). According to this model, we derive a jet opening angle 0.6 deg, and a collimation-corrected energy 61047 erg. This GRB therefore presents hybrid properties: a high luminosity -ray emission powered by narrowly collimated and highly relativistic outflow as typical of long GRBs; its low-energy output, rather soft spectrum and location in the lag-luminosity plan more closely resembles the class of XRFs and GRBs/SNe.
References
- Abdo et al. (2011) Abdo, A. A., Ackermann, M., Ajello, M., et al. 2011, ApJ, 734, L27+
- Abdo et al. (2009) Abdo, A. A., Ackermann, M., Asano, K., et al. 2009, ApJ, 707, 580
- Amati et al. (2007) Amati, L., Della Valle, M., Frontera, F., et al. 2007, A&A, 463, 913
- Arnaud et al. (2011) Arnaud, K., Smith, R., & Siemiginowska, A. 2011, Cambridge Observing Handbooks for Research Astronomers, 7, ISBN:9780521883733
- Atwood et al. (2009) Atwood, W. B., Abdo, A. A., Ackermann, M., et al. 2009, ApJ, 697, 1071
- Band et al. (1993) Band, D., Matteson, J., Ford, L., et al. 1993, ApJ, 413, 281
- Baring & Harding (1998) Baring, M. G. & Harding, A. K. 1998, Advances in Space Research, 22, 1115
- Barthelmy et al. (2005) Barthelmy, S. D., Barbier, L. M., Cummings, J. R., et al. 2005, Space Science Reviews, 120, 143
- Beniamini et al. (2011) Beniamini, P., Guetta, D., Nakar, E., & Piran, T. 2011, MNRAS, 416, 3089
- Berger et al. (2011) Berger, E., Chornock, R., Holmes, T. R., et al. 2011, ApJ, 743, 204
- Berger et al. (2003) Berger, E., Kulkarni, S. R., Pooley, G., et al. 2003, Nature, 426, 154
- Bloom et al. (2003) Bloom, J. S., Frail, D. A., & Kulkarni, S. R. 2003, ApJ, 594, 674
- Bloom et al. (1999) Bloom, J. S., Kulkarni, S. R., Djorgovski, S. G., et al. 1999, Nature, 401, 453
- Bošnjak et al. (2009) Bošnjak, Ž., Daigne, F., & Dubus, G. 2009, A&A, 498, 677
- Breeveld et al. (2010) Breeveld, A. A., Curran, P. A., Hoversten, E. A., et al. 2010, MNRAS, 406, 1687
- Burrows et al. (2005) Burrows, D. N., Hill, J. E., Nousek, J. A., et al. 2005, Space Science Reviews, 120, 165
- Cash (1979) Cash, W. 1979, ApJ, 228, 939
- Cenko et al. (2010) Cenko, S. B., Frail, D. A., Harrison, F. A., et al. 2010, ApJ, 711, 641
- Chapman et al. (2007) Chapman, R., Tanvir, N. R., Priddey, R. S., & Levan, A. J. 2007, MNRAS, 382, L21
- Cobb et al. (2010) Cobb, B. E., Bloom, J. S., Perley, D. A., et al. 2010, ApJ, 718, L150
- Daigne et al. (2011) Daigne, F., Bošnjak, Ž., & Dubus, G. 2011, A&A, 526, A110+
- Della Valle et al. (2006) Della Valle, M., Malesani, D., Bloom, J. S., et al. 2006, ApJ, 642, L103
- Esin & Blandford (2000) Esin, A. A. & Blandford, R. 2000, ApJ, 534, L151
- Evans et al. (2007) Evans, P. A., Beardmore, A. P., Page, K. L., et al. 2007, A&A, 469, 379
- Filgas et al. (2011) Filgas, R., Greiner, J., Schady, P., et al. 2011, A&A, 535, A57
- Finke et al. (2010) Finke, J. D., Razzaque, S., & Dermer, C. D. 2010, ApJ, 712, 238
- Galama et al. (1998) Galama, T. J., Vreeswijk, P. M., van Paradijs, J., et al. 1998, Nature, 395, 670
- Gehrels et al. (2004) Gehrels, N., Chincarini, G., Giommi, P., et al. 2004, ApJ, 611, 1005
- Gehrels et al. (2006) Gehrels, N., Norris, J. P., Barthelmy, S. D., et al. 2006, Nature, 444, 1044
- Ghirlanda et al. (2003) Ghirlanda, G., Celotti, A., & Ghisellini, G. 2003, A&A, 406, 879
- Guidorzi et al. (2006) Guidorzi, C., Monfardini, A., Gomboc, A., et al. 2006, PASP, 118, 288
- Hakkila et al. (2008) Hakkila, J., Giblin, T. W., Norris, J. P., Fragile, P. C., & Bonnell, J. T. 2008, ApJ, 677, L81
- Hascoët et al. (2011) Hascoët, R., Daigne, F., Mochkovitch, R., & Vennin, V. 2011, arXiv:1110.6313
- Hjorth & Bloom (2011) Hjorth, J. & Bloom, J. S. 2011, arXiv:1104.2274
- Jordi et al. (2006) Jordi, K., Grebel, E. K., & Ammon, K. 2006, A&A, 460, 339
- Kalberla et al. (2005) Kalberla, P. M. W., Burton, W. B., Hartmann, D., et al. 2005, A&A, 440, 775
- Kaneko et al. (2007) Kaneko, Y., Ramirez-Ruiz, E., Granot, J., et al. 2007, ApJ, 654, 385
- Kobayashi (2000) Kobayashi, S. 2000, ApJ, 545, 807
- Kobayashi et al. (1999) Kobayashi, S., Piran, T., & Sari, R. 1999, ApJ, 513, 669
- Lampton et al. (1976) Lampton, M., Margon, B., & Bowyer, S. 1976, ApJ, 208, 177
- Landolt (1992) Landolt, A. U. 1992, AJ, 104, 340
- Lazzati & Begelman (2005) Lazzati, D. & Begelman, M. C. 2005, ApJ, 629, 903
- Liang et al. (2010) Liang, E., Yi, S., Zhang, J., et al. 2010, ApJ, 725, 2209
- Liang et al. (2007) Liang, E., Zhang, B., Virgili, F., & Dai, Z. G. 2007, ApJ, 662, 1111
- Lithwick & Sari (2001) Lithwick, Y. & Sari, R. 2001, ApJ, 555, 540
- Massaro et al. (2010) Massaro, F., Grindlay, J. E., & Paggi, A. 2010, ApJ, 714, L299
- McBreen et al. (2008) McBreen, S., Foley, S., Watson, D., et al. 2008, ApJ, 677, L85
- Molinari et al. (2007) Molinari, E., Vergani, S. D., Malesani, D., et al. 2007, A&A, 469, L13
- Morsony et al. (2007) Morsony, B. J., Lazzati, D., & Begelman, M. C. 2007, ApJ, 665, 569
- Norris (2002) Norris, J. P. 2002, ApJ, 579, 386
- Norris & Bonnell (2006) Norris, J. P. & Bonnell, J. T. 2006, ApJ, 643, 266
- Norris et al. (2005) Norris, J. P., Bonnell, J. T., Kazanas, D., et al. 2005, ApJ, 627, 324
- Oates et al. (2009) Oates, S. R., Page, M. J., Schady, P., et al. 2009, MNRAS, 395, 490
- Page et al. (2009) Page, K. L., Willingale, R., Bissaldi, E., et al. 2009, MNRAS, 400, 134
- Page et al. (2007) Page, K. L., Willingale, R., Osborne, J. P., et al. 2007, ApJ, 663, 1125
- Panaitescu & Kumar (2002) Panaitescu, A. & Kumar, P. 2002, ApJ, 571, 779
- Panaitescu & Kumar (2004) Panaitescu, A. & Kumar, P. 2004, MNRAS, 350, 213
- Panaitescu et al. (2006) Panaitescu, A., Mészáros, P., Burrows, D., et al. 2006, MNRAS, 369, 2059
- Pei (1992) Pei, Y. C. 1992, ApJ, 395, 130
- Pian et al. (2006) Pian, E., Mazzali, P. A., Masetti, N., et al. 2006, Nature, 442, 1011
- Piran (1999) Piran, T. 1999, Phys. Rep., 314, 575
- Piran et al. (2009) Piran, T., Sari, R., & Zou, Y.-C. 2009, MNRAS, 393, 1107
- Piro et al. (2001) Piro, L., Garmire, G., Garcia, M. R., et al. 2001, ApJ, 558, 442
- Roming et al. (2005) Roming, P. W. A., Kennedy, T. E., Mason, K. O., et al. 2005, Space Science Reviews, 120, 95
- Ryde et al. (2010) Ryde, F., Axelsson, M., Zhang, B. B., et al. 2010, ApJ, 709, L172
- Smith et al. (2009) Smith, R. J., Kobayashi, S., Guidorzi, C., & Mundell, C. G. 2009, GRB Coordinates Network, 10192, 192, 1
- Soderberg et al. (2004) Soderberg, A. M., Kulkarni, S. R., Berger, E., et al. 2004, Nature, 430, 648
- Soderberg et al. (2006) Soderberg, A. M., Kulkarni, S. R., Nakar, E., et al. 2006, Nature, 442, 1014
- Sparre et al. (2011) Sparre, M., Sollerman, J., Fynbo, J. P. U., et al. 2011, ApJ, 735, L24+
- Starling et al. (2011) Starling, R. L. C., Evans, P. A., Read, A. M., et al. 2011, MNRAS, 412, 1853
- Starling et al. (2007) Starling, R. L. C., Wijers, R. A. M. J., Wiersema, K., et al. 2007, ApJ, 661, 787
- Tanvir et al. (2010) Tanvir, N. R., Rol, E., Levan, A. J., et al. 2010, ApJ, 725, 625
- Troja et al. (2009) Troja, E., Barthelmy, S. D., Baumgartner, W. H., et al. 2009, GRB Coordinates Network, 10191, 191, 1
- Ukwatta et al. (2010) Ukwatta, T. N., Stamatikos, M., Dhuga, K. S., et al. 2010, ApJ, 711, 1073
- Vergani et al. (2011) Vergani, S. D., Flores, H., Covino, S., et al. 2011, A&A, 535, A127
- Virgili et al. (2011) Virgili, F. J., Zhang, B., O’Brien, P., & Troja, E. 2011, ApJ, 727, 109
- Waxman & Draine (2000) Waxman, E. & Draine, B. T. 2000, ApJ, 537, 796
- Woosley & Bloom (2006) Woosley, S. E. & Bloom, J. S. 2006, ARA&A, 44, 507
- Zeh et al. (2004) Zeh, A., Klose, S., & Hartmann, D. H. 2004, ApJ, 609, 952
- Zhang & Mészáros (2004) Zhang, B. & Mészáros, P. 2004, International Journal of Modern Physics A, 19, 2385
- Zhang et al. (2011) Zhang, B., Zhang, B., Liang, E., et al. 2011, ApJ, 730, 141
- Zhang et al. (2009) Zhang, B., Zhang, B.-B., Virgili, F. J., et al. 2009, ApJ, 703, 1696