Photoluminescence spectroscopy of pure pentacene, perfluoropentacene and mixed thin films
Abstract
We report detailed temperature dependent photoluminescence (PL) spectra of pentacene (PEN), perfluoropentacene (PFP), and PEN:PFP mixed thin films grown on SiO2. PEN and PFP are particularly suitable for this study, since they are structurally compatible for good intermixing and form a model donor/acceptor system. The PL spectra of PEN are discussed in the context of existing literature and compared to the new findings for PFP. We analyze the optical transitions observed in the spectra of PEN and PFP using time-dependent density functional theory (TD-DFT) calculations. Importantly, for the mixed PEN:PFP film we observe an optical transition in PL at 1.4 eV providing evidence for coupling effects in the blend. We discuss a possible charge-transfer (CT) and provide a tentative scheme of the optical transitions in the blended films.
I Introduction
There has been growing interest in organic semiconducting materials in the last decade. A major driving force behind this is obviously their potential for electronic and optoelectronic applications, many of which actually involve several organic components, frequently as donor/acceptor systems. Brütting (2005); Wagner et al. (2010); Salaneck et al. (2001); Witte and Wöll (2004); Koch (2007) The coupling between these compounds including the energy level alignment and possible charge transfer (CT) states are not well understood, but they are crucially important, since they determine to a large extent the resulting electronic and optical properties including absorption and emission cross sections. One of the fundamental properties is photoluminescence (PL), which is also an important way of testing the interactions and the effective energy levels Salzmann et al. (2008a); Aoki-Matsumoto et al. (2001); He et al. (2005a); Park et al. (2002). In order to maximize the potential for coupling effects, good intermixing of the respective two compounds is desirable, for which structural compatibility is beneficial. Pentacene (PEN, C22H14) and perfluoropentacene (PFP, C22F14) Sakamoto et al. (2006); Fujii et al. (2009); Inoue et al. (2005); Hinderhofer et al. (2007); Broch et al. (2011); Salzmann et al. (2008a); Medina et al. (2007); Koch et al. (2008) are promising candidates for a model system, since on the one hand they exhibit obviously different electron affinities and may thus act as a donor/acceptor pair, and on the other hand they are expected to be structurally compatible due their similar molecular geometry. Moreover, they exhibit high charge carrier mobilities and have already been tested in device structures. Anthony (2008); Inoue et al. (2005); Hinderhofer et al. (2007) In fact, detailed X-ray experiments on PEN:PFP mixed thin films Salzmann et al. (2008b); Hinderhofer et al. (2011) have shown good intermixing of the molecules promoting the probability of molecular interaction between PEN and PFP. While an equimolar mixed thin film leads to PEN:PFP intermixed phases, non-1:1 mixing ratios result in phase separation between homogeneously blended and pure phases. Hinderhofer et al. (2011) In this study, using temperature dependent PL spectroscopy on PEN:PFP mixed films, we find evidence for coupling between PEN and PFP. In particular, we discover a new optical transition in PL at 1.4 eV that is related to an absorption band at 1.6 eV Broch et al. (2011).
II Experimental
Pure PEN (Sigma Aldrich, 99.9 % purity) and PFP (Kanto Denka Kogyo Co., 99 % purity) as well as coevaporated blended thin films with mixing ratio 4:1, 1:1, and 1:2 (PEN:PFP) were grown on oxidized silicon wafers using organic molecular beam deposition Witte and Wöll (2004); Schreiber (2004) techniques. Thin films were grown under ultra high vacuum (UHV) conditions with a thickness of roughly 20 nm on substrates kept at 325 K. In this regime PEN thin films nucleate in the ’thin film phase’ Mattheus et al. (2003), whereas for PFP so far only one phase has been reported Sakamoto et al. (2006). Further details on the growth and structure, including X-ray diffraction data can be found in Ref. 19. In addition, X-ray data of the blended PEN:PFP films shown in the supplementary material are essentially identical to the ones presented in Ref. 19 and hence demonstrate good intermixing. The mixing ratio of the blends was determined by X-ray photoelectron spectroscopy on similar samples. Broch et al. (2011)
Low temperature photoluminescence spectra were acquired using a Horiba Jobin Yvon LabRam HR 800 spectrometer with a CCD-1024256-FIVS-3S9. The samples were mounted on a KONTI cryostat and cooled down by liquid nitrogen/helium under high vacuum (HV) conditions. Measurements were performed during warm up. The average time interval between consecutive spectra in a series was more than one hour.
Excitation was performed using an Ar+-laser with lines at 488 nm (2.54 eV) and 514 nm (2.41 eV). Spectra obtained at the different excitation energies yield essentially identical shapes. While the more intense line at 2.41 eV leads to a higher quantum yield of the spectra, the line at 2.54 eV covers a broader spectral range. Thus, we present temperature dependent PL of the pure samples excited at 488 nm, since features above 2 eV for PEN become more detailed. For the PL of the mixtures, which is rather redshifted with respect to the PL of the pure samples, we make use of the more intense line at 514 nm. The diameter of the laser spot on the sample was approximately 1 m, hence the spectra represent an average over phase separated PEN, PFP, and mixed islands as they occur for non-1:1 mixing ratios Hinderhofer et al. (2011).
The luminescence spectra were corrected for instrumental sensitivity. Normalization was performed with respect to the dominant Raman peak of the Si-substrate at 520 cm-1. In order to avoid photo-oxidation effects affecting in particular the blends, the samples were stored and measured under HV conditions.
III Pure materials
In this section we present the PL spectra of the pure materials and discuss them in the light of time-dependent density funtional theory (TD-DFT) calculations.
III.1 Pentacene (PEN)
In order to relate to existing results in the literature Aoki-Matsumoto et al. (2001); He et al. (2005a); Park et al. (2002); He et al. (2010, 2005b), we first discuss pure PEN films. Fig. 1 shows the PL of PEN at different temperatures. We can identify six PL bands to . The dominating PL line lies at 1.83 eV, which is close to the peak energy of the lowest absorption band at 1.85 eV reported for a thin film with similar properties. Hinderhofer et al. (2007) It is the only band visible at room temperature (RT) and exhibits two broad shoulders shifted by 150 meV towards its lower energy side (see inset). We observe another shoulder blueshifted by 100 meV from the maximum. The intensity of peak increases strongly towards lower temperatures, whereas the blueshifted shoulder and the redshifted shoulders keep their low intensity. The latter become superimposed by other bands at 1.52 eV and 1.66 eV. Towards 4 K, the peak is subject to a blueshift by approximately 10 meV.

Below 250 K further peaks arise at 1.52 eV () and 1.37 eV (), respectively. In good agreement with Ref. 7, we observe a maximum for bands and at approximately 50 K. Both peaks grow in parallel exhibiting a constant intensity ratio. Another band arises at 1.66 eV () for temperatures below 100 K. Below 200 K we observe the bands (2.14 eV) and (2.29 eV). Unlike other PL features, these bands do not change notably in intensity towards lower temperatures.
is known in the literature as the free exciton band Aoki-Matsumoto et al. (2001); He et al. (2005a), originating from the transition. Its position varies between 1.76 eV in thicker thin films Park et al. (2002) and 1.88 eV in monolayers with a parabolically increasing intensity for small film thicknesses He et al. (2010). At 1.82 eV it has been observed less pronounced also in PEN crystals Aoki-Matsumoto et al. (2001). The shoulder 100 meV above coincides with previous reports, where in particular for very thin PEN films and clusters a higher Davydov component of band was observed. He et al. (2005b)
We assign the two shoulders of peak denoted as VP in the inset of Fig. 1 to a vibronic progression. Interestingly, these shoulders do not become more pronounced at lower temperatures. A similar behavior of the vibronic progression was found in tetracene which also crystallizes in a herringbone structure, where this effect could be explained by superradiance. Lim et al. (2004)
was assigned to a self-trapped exciton (STE) state. Its strongly pronounced signal increasing towards low temperature is reported in particular for PEN crystals. Aoki-Matsumoto et al. (2001); He et al. (2005a) The origin of peak remains unclear. It has been discussed as a deep STE Aoki-Matsumoto et al. (2001) or charge-transfer exciton Knupfer and Berger (2006). Also a transition related to impurities of PEN crystals was found in this region. He et al. (2005a)
III.2 Perfluoropentacene (PFP)
PL spectra of pure PFP have not been reported before. The temperature dependent PL spectrum obtained from a 20 nm thick PFP thin film is presented in Fig. 2. The strong peak at 1.72 eV () exhibits a fine structure towards its low energy tail. At lower temperatures the peak becomes more narrow and increases in amplitude. We also observe a blueshift of the peak maximum of towards 4 K by 10 meV. The fine structure consists of sidebands at 1.66 eV () and 1.56 eV (), which appear as shoulders at RT, but are clearly distinguishable at low temperatures where they become narrower.
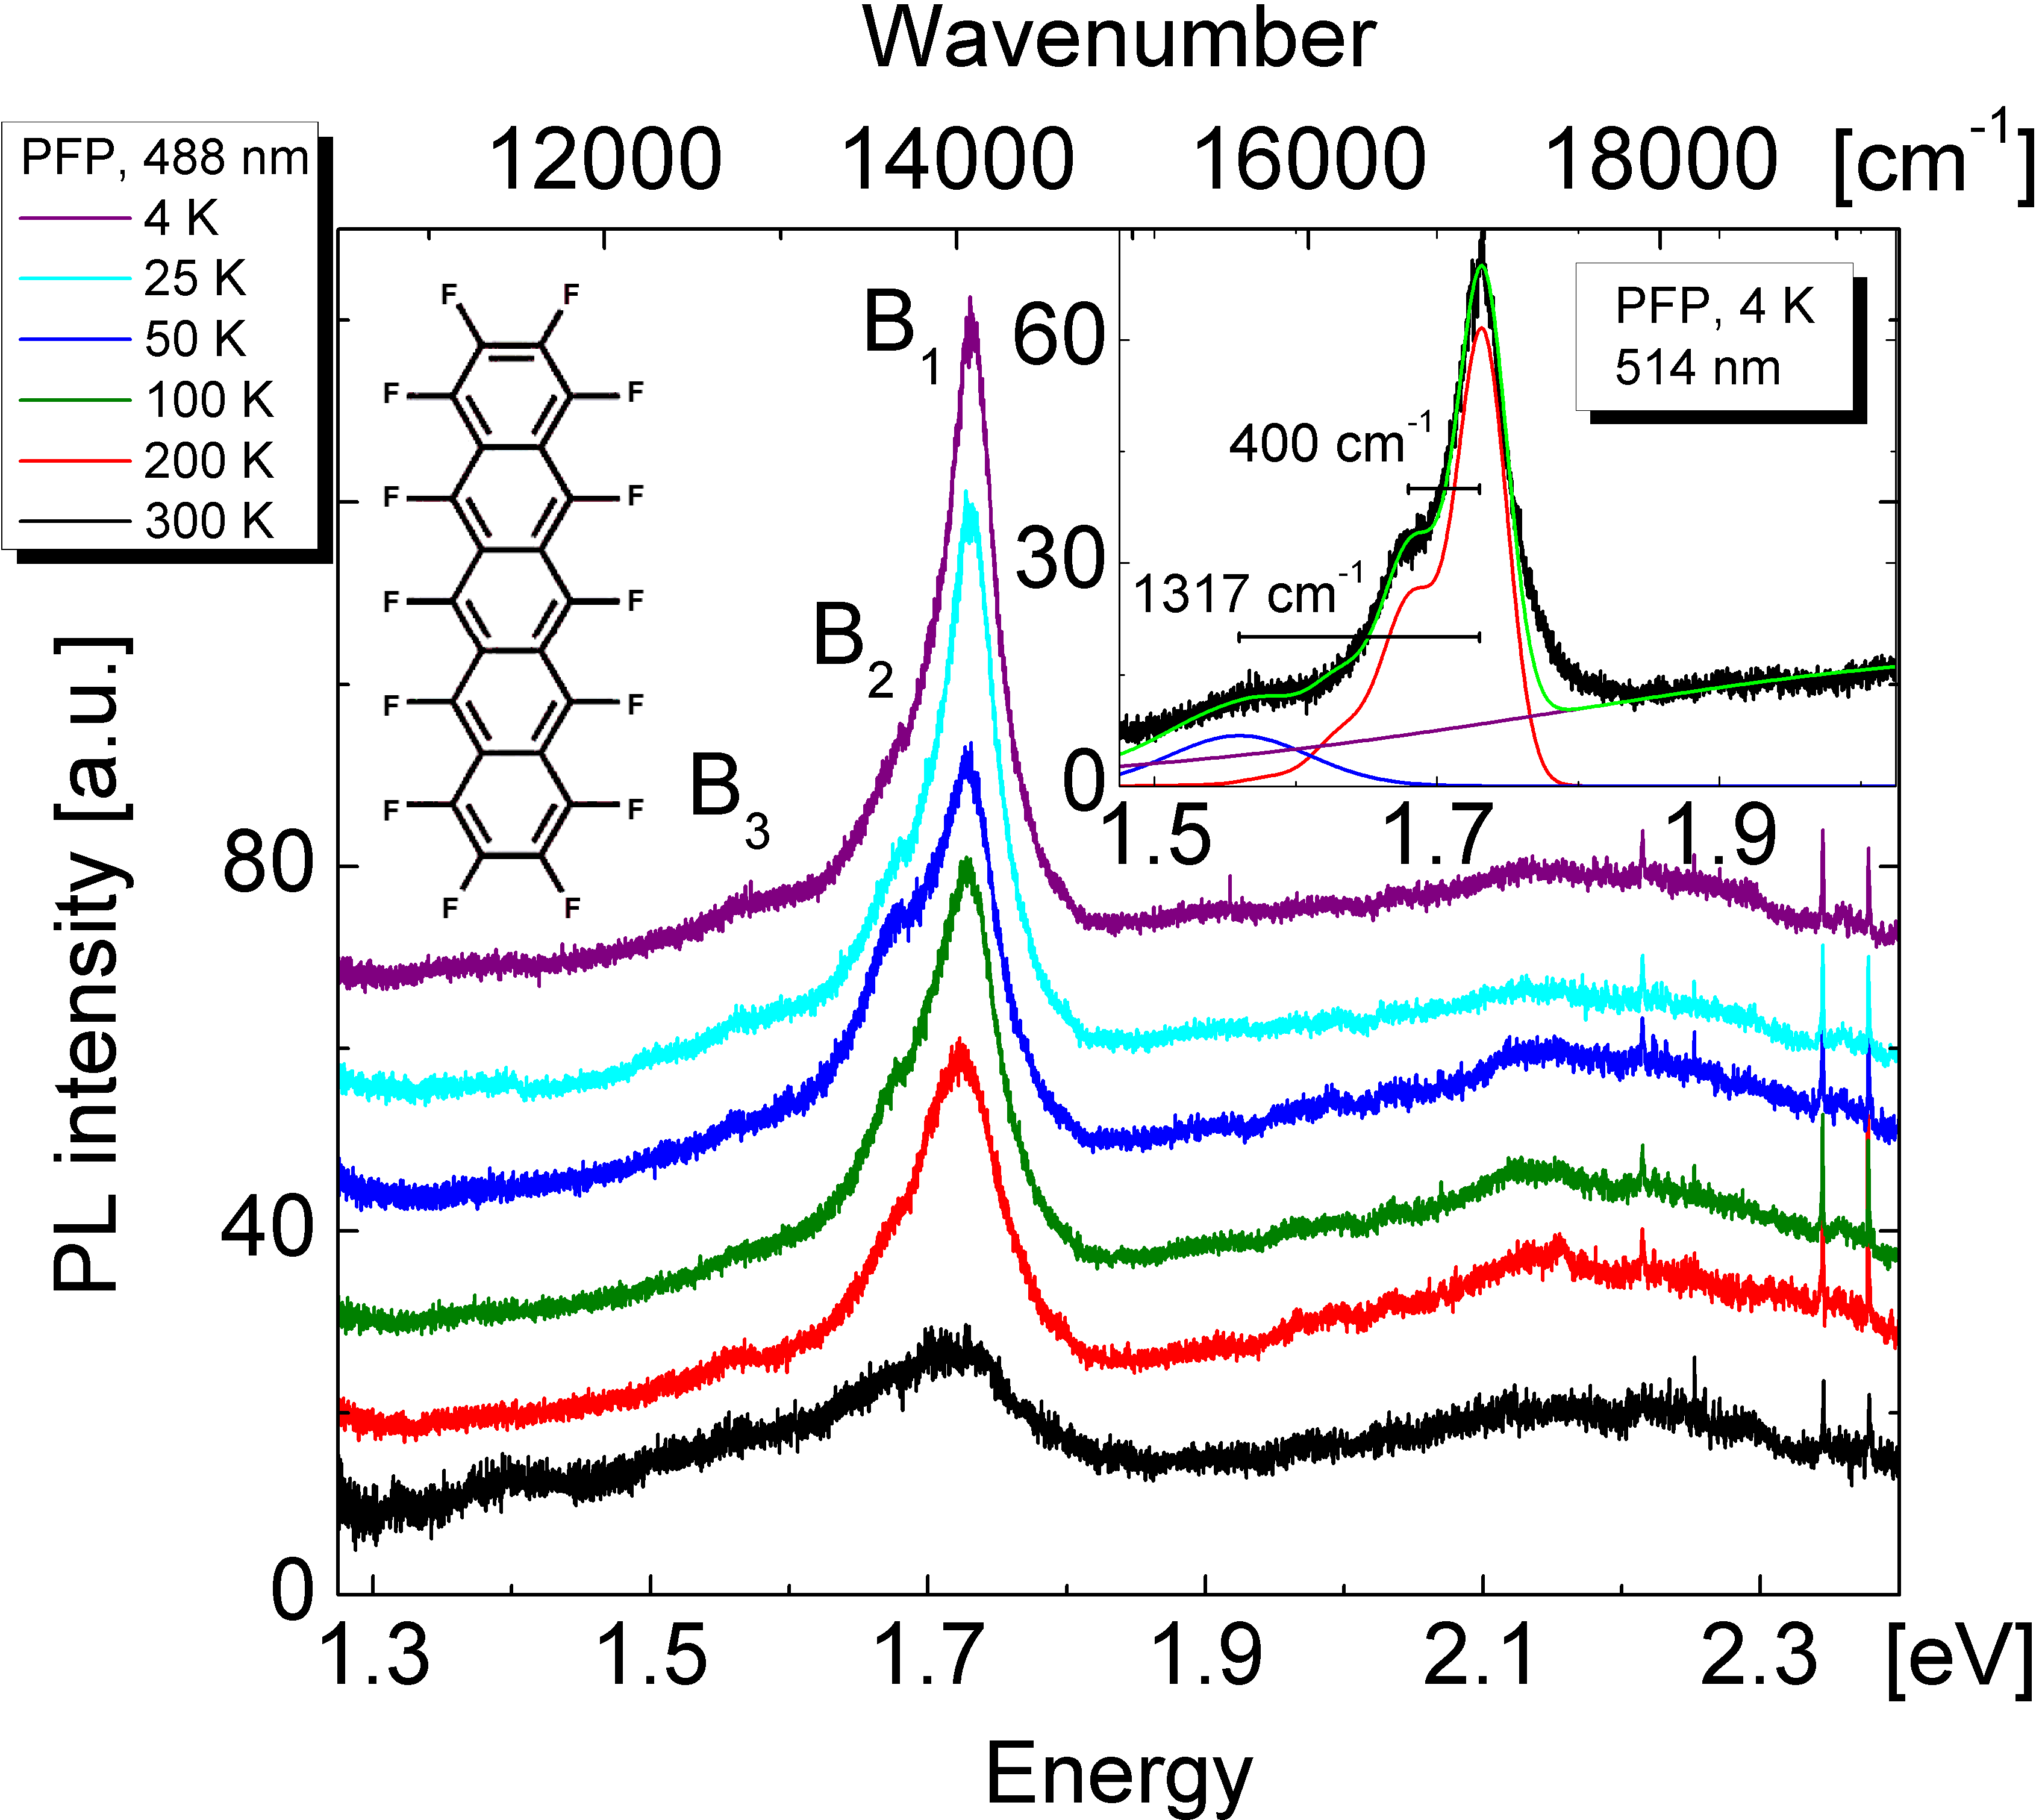
We note that the lowest peak in the absorption spectra for a comparable thin film was observed at 1.78 eV Hinderhofer et al. (2007), which results in a Stokes-shift of the PL maximum of 60 meV. Because of the rather small Stokes-shift of peak with respect to the lowest absorption maximum Hinderhofer et al. (2007), we assign this peak to the transition of PFP. The fine structure seems to originate from a vibronic progression resulting from elongated internal vibrational modes. In order to describe the data at 4 K, we perform a model fit of the intensity using a series of Gaussians that are Poisson-distributed in intensity following
(see inset of Fig. 2, red curve), where and denote the energy position and width of the peaks, respectively. We find a Huang-Rhys-factor of 0.5 for peak . We complete this model by introducing another Gaussian at 1.56 eV () and a broad peak representing the background (blue and purple curve in the inset, respectively). The background is formed by weak and broadened peaks energetically above , which, however, cannot be resolved properly. While the red curve corresponds to C-C bending modes at 48 meV, may be related to a vibronic progression of C-C stretching vibrations at 163 meV. Fujii et al. (2009) Tab. 1 gives a list of selected PEN and PFP peaks.
| PEN | ||
|---|---|---|
| 1.83-1.84 eV | ||
| 1.66 eV | Self trapped exciton | |
| 1.52 eV | Being discussed | |
| 1.37 eV | Vibronic progression of | |
| 2.14 eV | Recombination of electron-hole pairs | |
| 2.29 eV | Recombination of electron-hole pairs | |
| PFP | ||
| 1.72 eV | ||
| 1.66 eV | Vibronic progression of | |
| 1.56 eV | Vibronic progression of | |
III.3 Electronic transitions of pure materials.
The observed absorption Broch et al. (2011) and PL features can be compared to electronic excitations calculated with TD-DFT Jamorski et al. (1996) using the hybrid functional B3LYP Becke (1988); Lee et al. (1988) together with a 6-31G(d) variational basis, as implemented in the gaussian03 program package M. J. Frisch, et al. , compare Tab. 2.
When applied to a free molecule, TD-DFT is known to reproduce the oscillator strength of different electronic transitions reasonably well, but the calculated vertical transition energies in the ground state geometry of the molecule are subject to a rather large variation of about 0.4 eV around the measured transition energies Grimme and Parac (2003); Hellweg et al. (2008). In cases where the observed absorption line shape shows a pronounced vibronic progression, it becomes mandatory to distinguish between the observed origin band and the average over the observed vibronic transitions, . The internal deformations in the relaxed excited geometries of PEN and PFP elongate several breathing modes observable in resonant Raman spectroscopy, and in absorption they result in a pronounced vibronic progression with about eV Gisslén (2009). TD-DFT for a single molecule does not account for the gas-to-crystal shift arising from the surrounding molecules, and lattice sums over long range interactions between the molecular transition dipoles are ignored. Nevertheless, together with the calculated oscillator strengths, TD-DFT can provide a one-to-one correspondence between observed and calculated absorption bands.
| PEN | PFP | ||||||||
| State | Configuration | Transition Dipole | E | E | E | E | |||
| eV | eV | 1 | eV | eV | 1 | ||||
| exp. | calc. | calc. | exp. | calc. | calc. | ||||
| 0 | 0 | ||||||||
| 0.85a | 0.99 | 0.88 | |||||||
| 2.31b | 1.94 | 0.041 | 1.99c | 1.77 | 0.045 | ||||
| 2.13c | 1.78d | ||||||||
| 1.85d | |||||||||
| 2.96 | 2.70 | ||||||||
| 3.73e | 3.24 | 0.012 | 2.71c | 3.01 | 0.337 | ||||
| 3.27 | 3.10 | ||||||||
| 4.01 | 0.000 | 3.68 | 0.001 | ||||||
| (PEN) | 4.40e | 4.34 | 3.24 | ||||||
| (PFP) | 4.03 | ||||||||
| 1.2 - 1.4f | 1.16 | 0.002 | 1.11 | 0.004 | |||||
| 2.02 | 1.69 | ||||||||
| 2.46g | 2.26 | 0.695 | 2.16 | 0.581 | |||||
| 1.97h | |||||||||
a in polycrystalline materialRei Vilar et al. (1983), b free molecule Amirav et al. (1981), c in dichlorobenzene solution Hinderhofer et al. (2007), d in polycrystalline film Hinderhofer et al. (2007), e in neon matrix Halasinski et al. (2000), f in polycrystalline film Thorsmølle et al. (2009), g in cyclohexane solution Hellner et al. (1972), h in polycrystalline film Jundt et al. (1995).
As shown in Tab. 2, both for PEN and PFP, all known dipole-allowed transitions between singlets or between triplets are reproduced within deviations typical for TD-DFT calculations on similar systems. In PEN, the lowest two calculated singlet transitions and agree within 0.05 eV with previous TD-DFT calculations using the same functional in a different basis set Grimme and Parac (2003), but they underestimate the experimental transitions observed in the gas phase or in rare gas matrices Amirav et al. (1981); Halasinski et al. (2000) by up to 0.5 eV. Due to a significant gas-to-solvent shift, the difference between the calculated lowest transitions and the observed values is reduced to about 0.2 eV Hinderhofer et al. (2007). Both in PEN and in PFP, the transition (peak and , respectively) is dominated by a highest occupied molecular orbital/lowest unoccupied molecular orbital (HOMO/LUMO) excitation, so that these designations may be used synonymously.
For PEN, the very strong transition polarized along the long axis of the molecule is obtained in the TD-DFT calculation close to the value of 4.40 eV observed in a rare gas matrix Halasinski et al. (2000). In PFP, the respective transition is dipole-forbidden.
In both molecules, the calculated lowest triplet state occurs below half of the lowest singlet transition energy, so that a non-radiative decay becomes energetically allowed. Using pump-probe spectroscopy for PEN, it was demonstrated that this singlet fission mechanism occurs on a time scale of about 80 fs Jundt et al. (1995), and the microscopic details of this process were analyzed with multi-reference perturbation theory Zimmerman et al. (2010). In PEN, the calculated triplet energy of 0.99 eV is in reasonable agreement with the experimental value of 0.85 eV. For PFP, we are not aware of any previous experimental or theoretical assignment of the lowest triplet energy.
The very weak transition in PEN has been observed with pump-probe spectroscopy in the region 1.2 to 1.4 eV as a transient absorption process from a long-living excited state Thorsmølle et al. (2009). As the ratio between the intensities of our observed PL bands and in PEN is temperature-independent, it is natural to assign both features to a vibronic progression with a fundamental transition at 1.52 eV, above all transient absorption features at lower energies assigned to the lowest triplet . As the respective transition should show a small Stokes shift, only PL bands slightly below the highest observed absorption structure at 1.4 eV Broch et al. (2011) might be assigned to this transition . Therefore, we conclude that this recombination mechanism between the lowest two triplet states cannot contribute to our lowest fundamental PL band observed at 1.52 eV.
The rather strong transition has been detected both in solution Hellner et al. (1972) and in polycrystalline films Jundt et al. (1995). In the latter case, it was suggested that this strong transition between triplets is approximately resonant with the lowest transition between singlets, . Via the interaction between the transition dipoles involved, the reaction (in our notation) might become a source for higher triplet states Jundt et al. (1995). As far as the observed PL spectra of PEN and PFP are concerned, a dipole-allowed recombination process between triplets might indeed contribute to the observed PL features above 2 eV. However, as the two highest PL transitions and are close to observed charge transfer transitions at 2.12 eV and 2.27 eV Sebastian et al. (1981), we think that the respective recombination process involving adjacent cationic and anionic molecules provides a more natural assignment. From calculated lattice sums of the interactions between the transition dipoles, it is evident that the excitonic dispersion possesses a minimum for vanishing wave vector at the point of the Brillouin zone Schlosser and Philpott (1980). Therefore, the optically created Frenkel excitons thermalize around the dispersion minimum at from where they can recombine radiatively under momentum conservation. Occasionally, excitons can scatter from Bloch waves into pairs of photocarriers. The resulting electrons and holes diffuse across the crystal before eventually localizing on a pair of adjacent molecules from where they can recombine radiatively. Even though the respective charge transfer transitions at 2.12 eV and 2.27 eV are high above the fundamental of the at , scattering from the localized electron-hole pair into a Bloch wave at much lower energy seems to be inhibited by a high energy barrier.
To summarize this analysis, the observed PL bands in PEN at 1.83 eV and in PFP at eV are assigned to the fundamental of the recombination process at the point of the Brillouin zone. Moreover, in PFP, the satellites and can be related to a vibronic progression starting with . The high energy transitions and in PEN are assigned to CT transitions between neighboring molecules observed in absorption at similar energies Sebastian et al. (1981). The low energy transition has been related to a self-trapped exciton (STE) state Aoki-Matsumoto et al. (2001), and and represent a vibronic progression with the fundamental transition .
IV PEN:PFP blends
In this section we present PL spectra of the coevaporated PEN:PFP thin films and discuss them in comparison to the pure samples.
IV.1 1:1, 1:2, and 4:1 PEN:PFP mixed samples
The existence of a pronounced radiative transition near 1.4 eV, which does not occur in the pure samples, is common to the PL of all blends. As will be shown below, it relates to a transition at 1.6 eV observed in absorption spectra of similar samples. Broch et al. (2011) For the 1:1 mixture at 4 K it is the only radiative transition in the spectral range we investigated (Fig. 3, top panel).
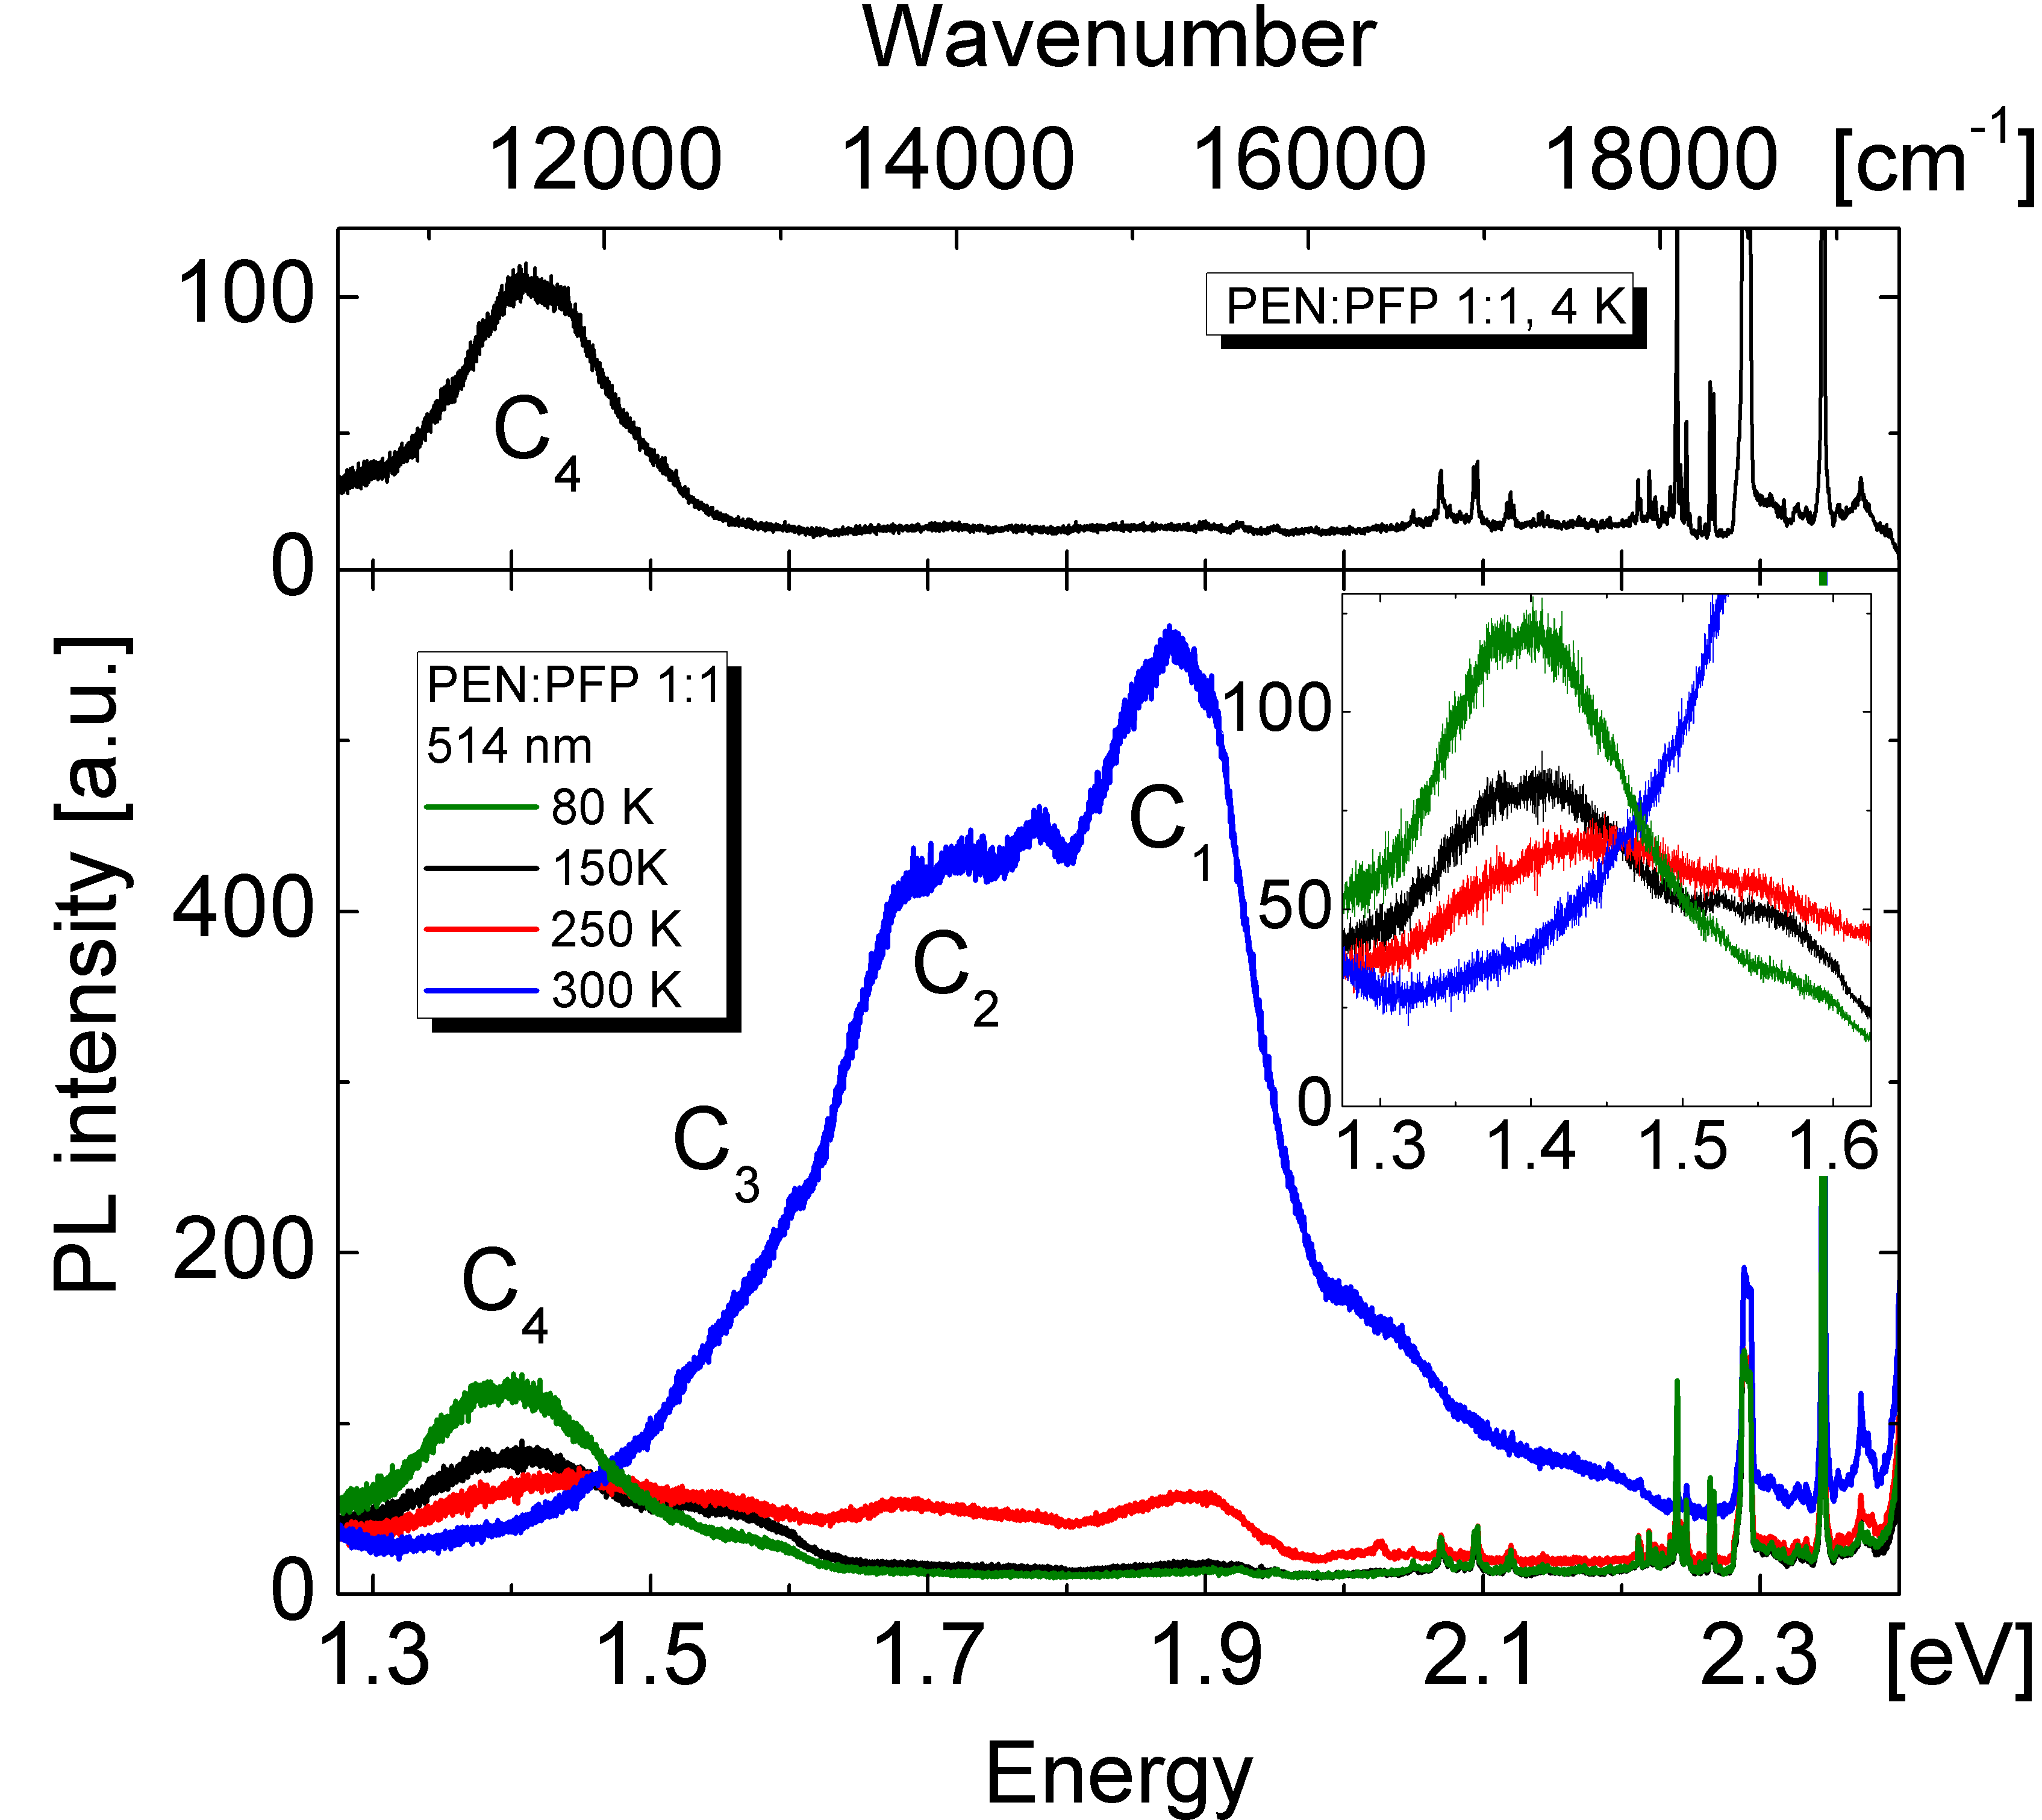
We classify the PL of the 1:1 blend into 4 bands (-), see Fig. 3 (bottom). At RT, we observe a dominant region of merged peaks ranging from approximately 1.5 eV to 2 eV. It shows a maximum at 1.88 eV () accompanied by a band at 1.7 eV () and a shoulder at 1.57 eV (). The intensity of the merged bands and diminishes drastically at lower temperature and, interestingly, at approximately 150 K they disappear completely. Band at 1.57 eV decreases gradually towards lower temperature. We observe a new peak at 1.4 eV, continuously rising with decreasing temperature.
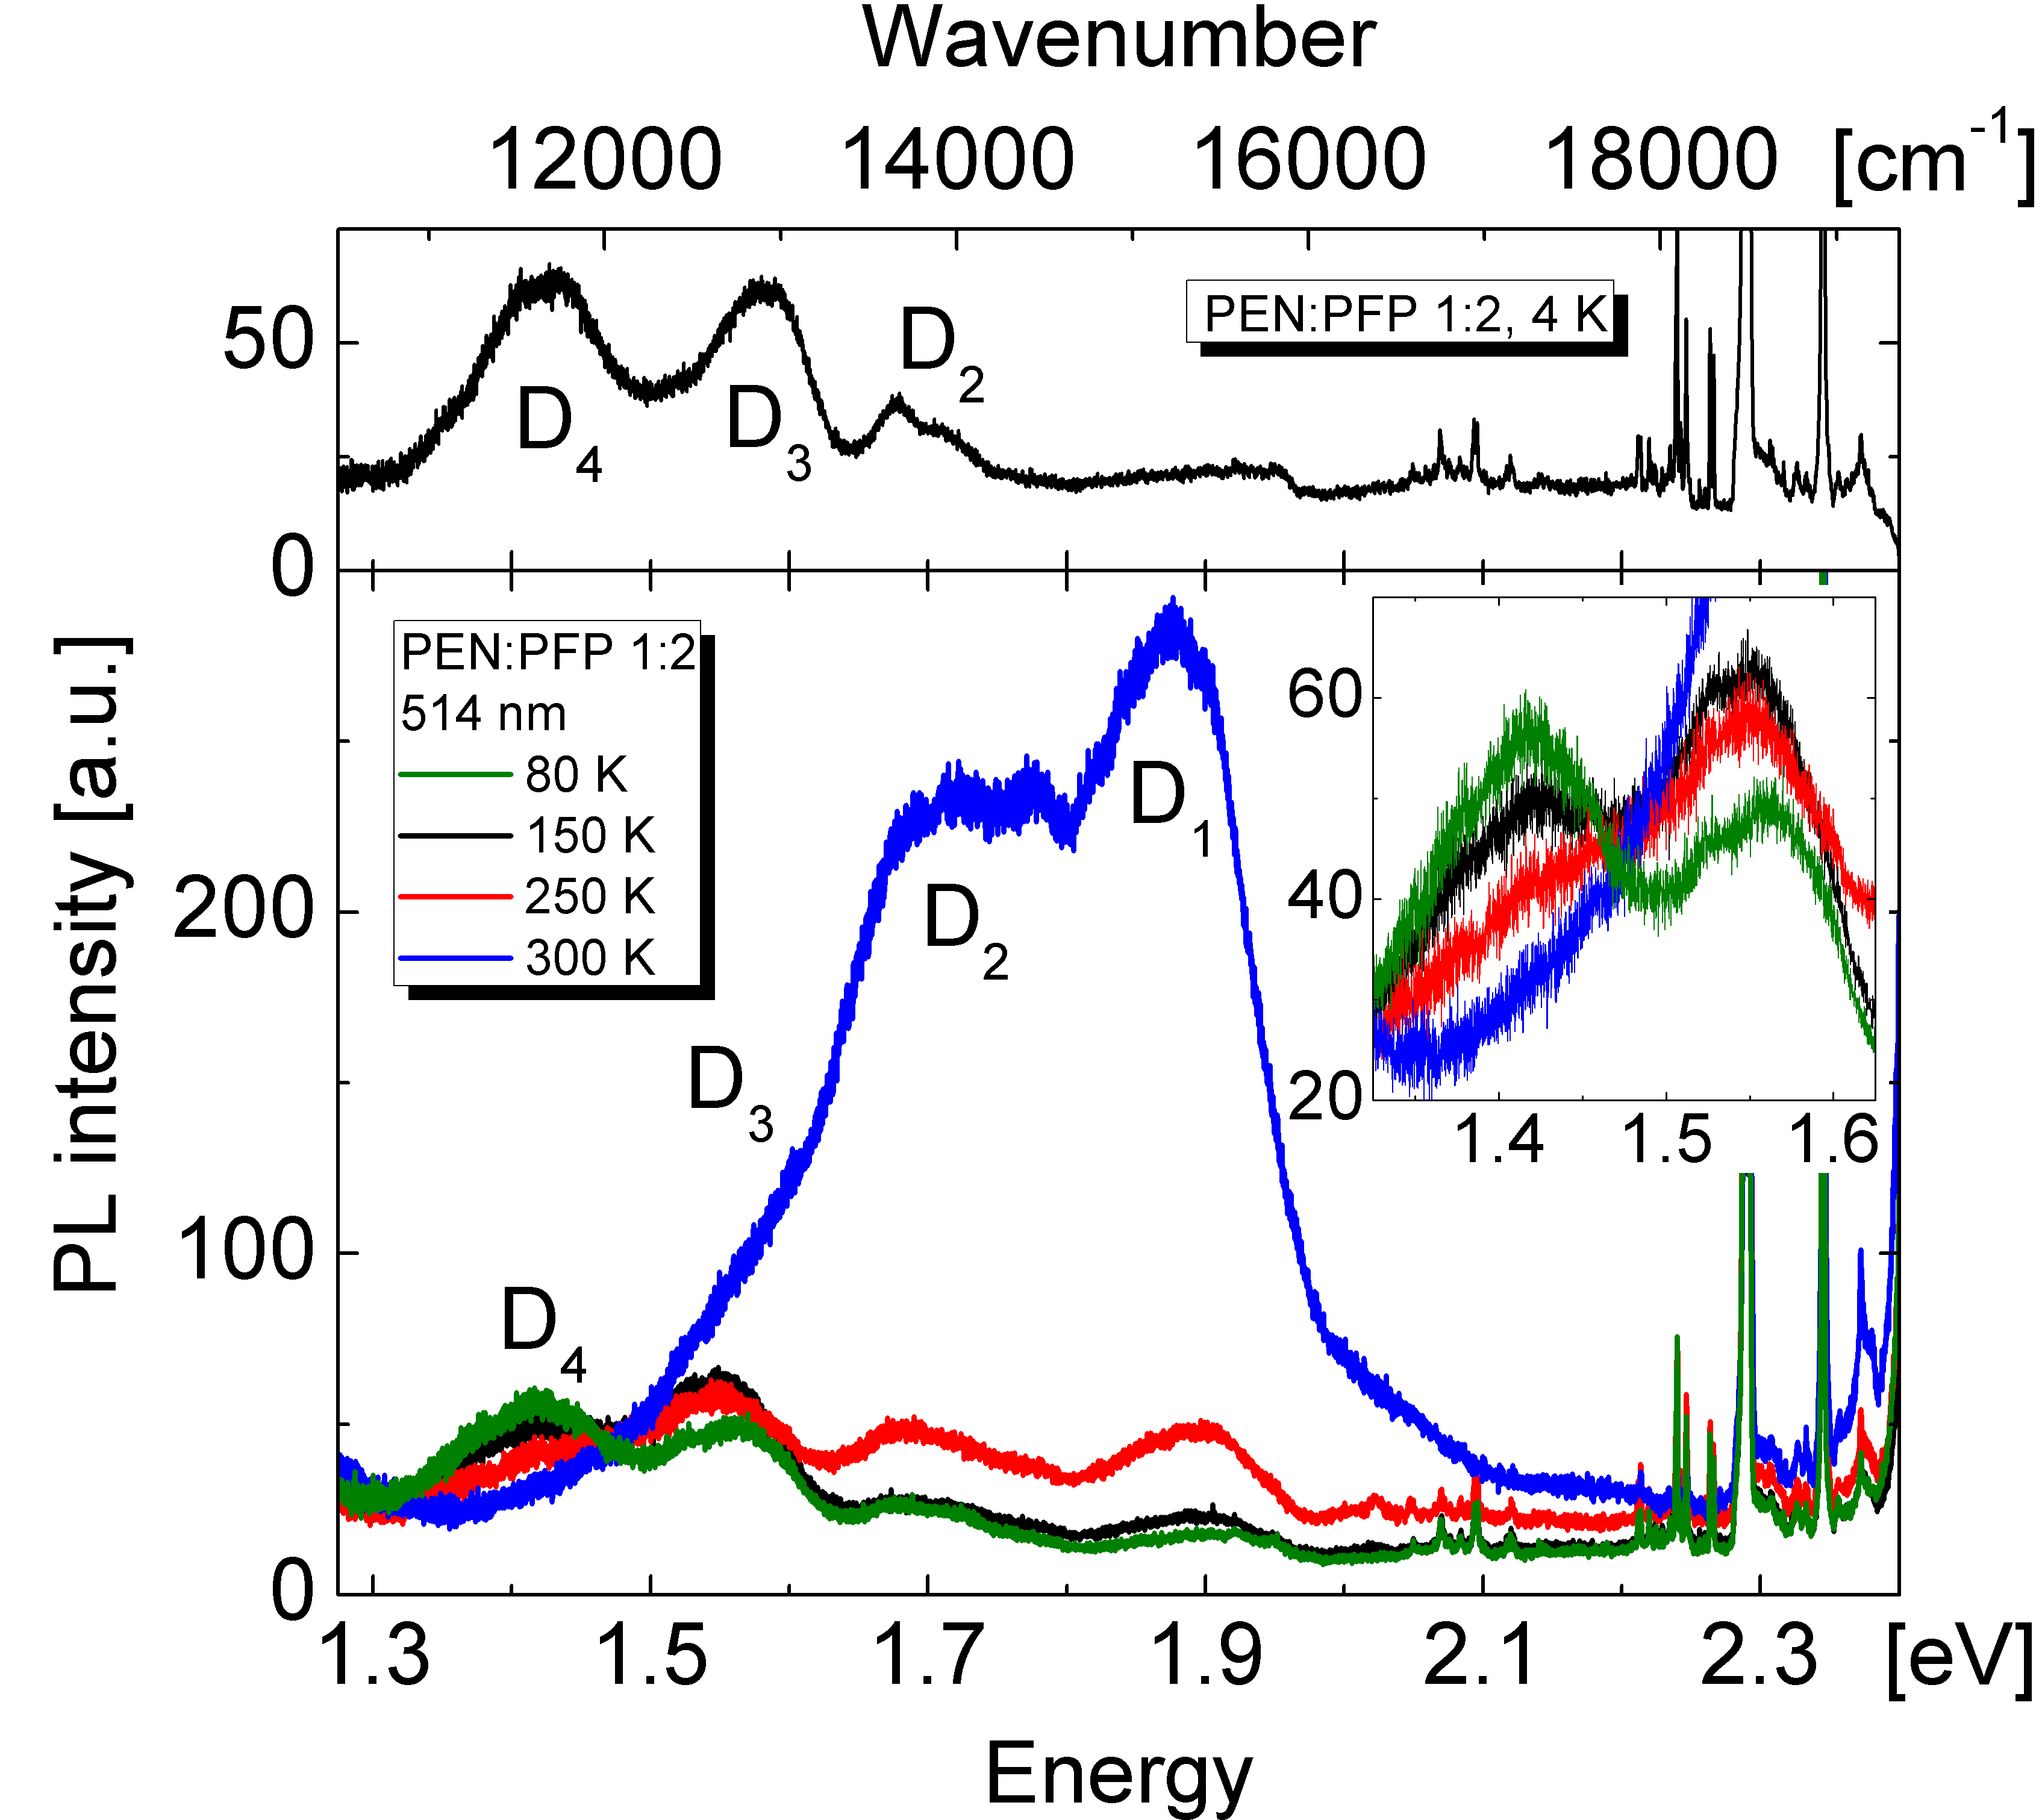
Similar to the 1:1 blend, the 1:2 mixture (Fig. 4) with more PFP exhibits merged bands at RT ranging from approximately 1.5 eV to 2 eV. Though with slight modifications, it shows shoulders and peaks in similar regions as the 1:1 mixture, which we denote as (1.88 eV), (1.7 eV) and (1.56 eV), corresponding to , , and , respectively. The shoulder in the region around 1.7 eV is slightly more pronounced compared to than the corresponding shoulder in the 1:1 mixture.
The bands and decrease with temperature but a peak at approximately 1.7 eV () still remains at 4 K, in contrast to the 1:1 blend. The shoulder denoted as decreases with temperature, reaches a minimum at around 100 K, is blueshifted by 20 meV and rises again towards lower temperatures, which is also different from the 1:1 blend. Below 300 K, a band at 1.4 eV (corresponding to ) increases continuously towards lower temperatures.
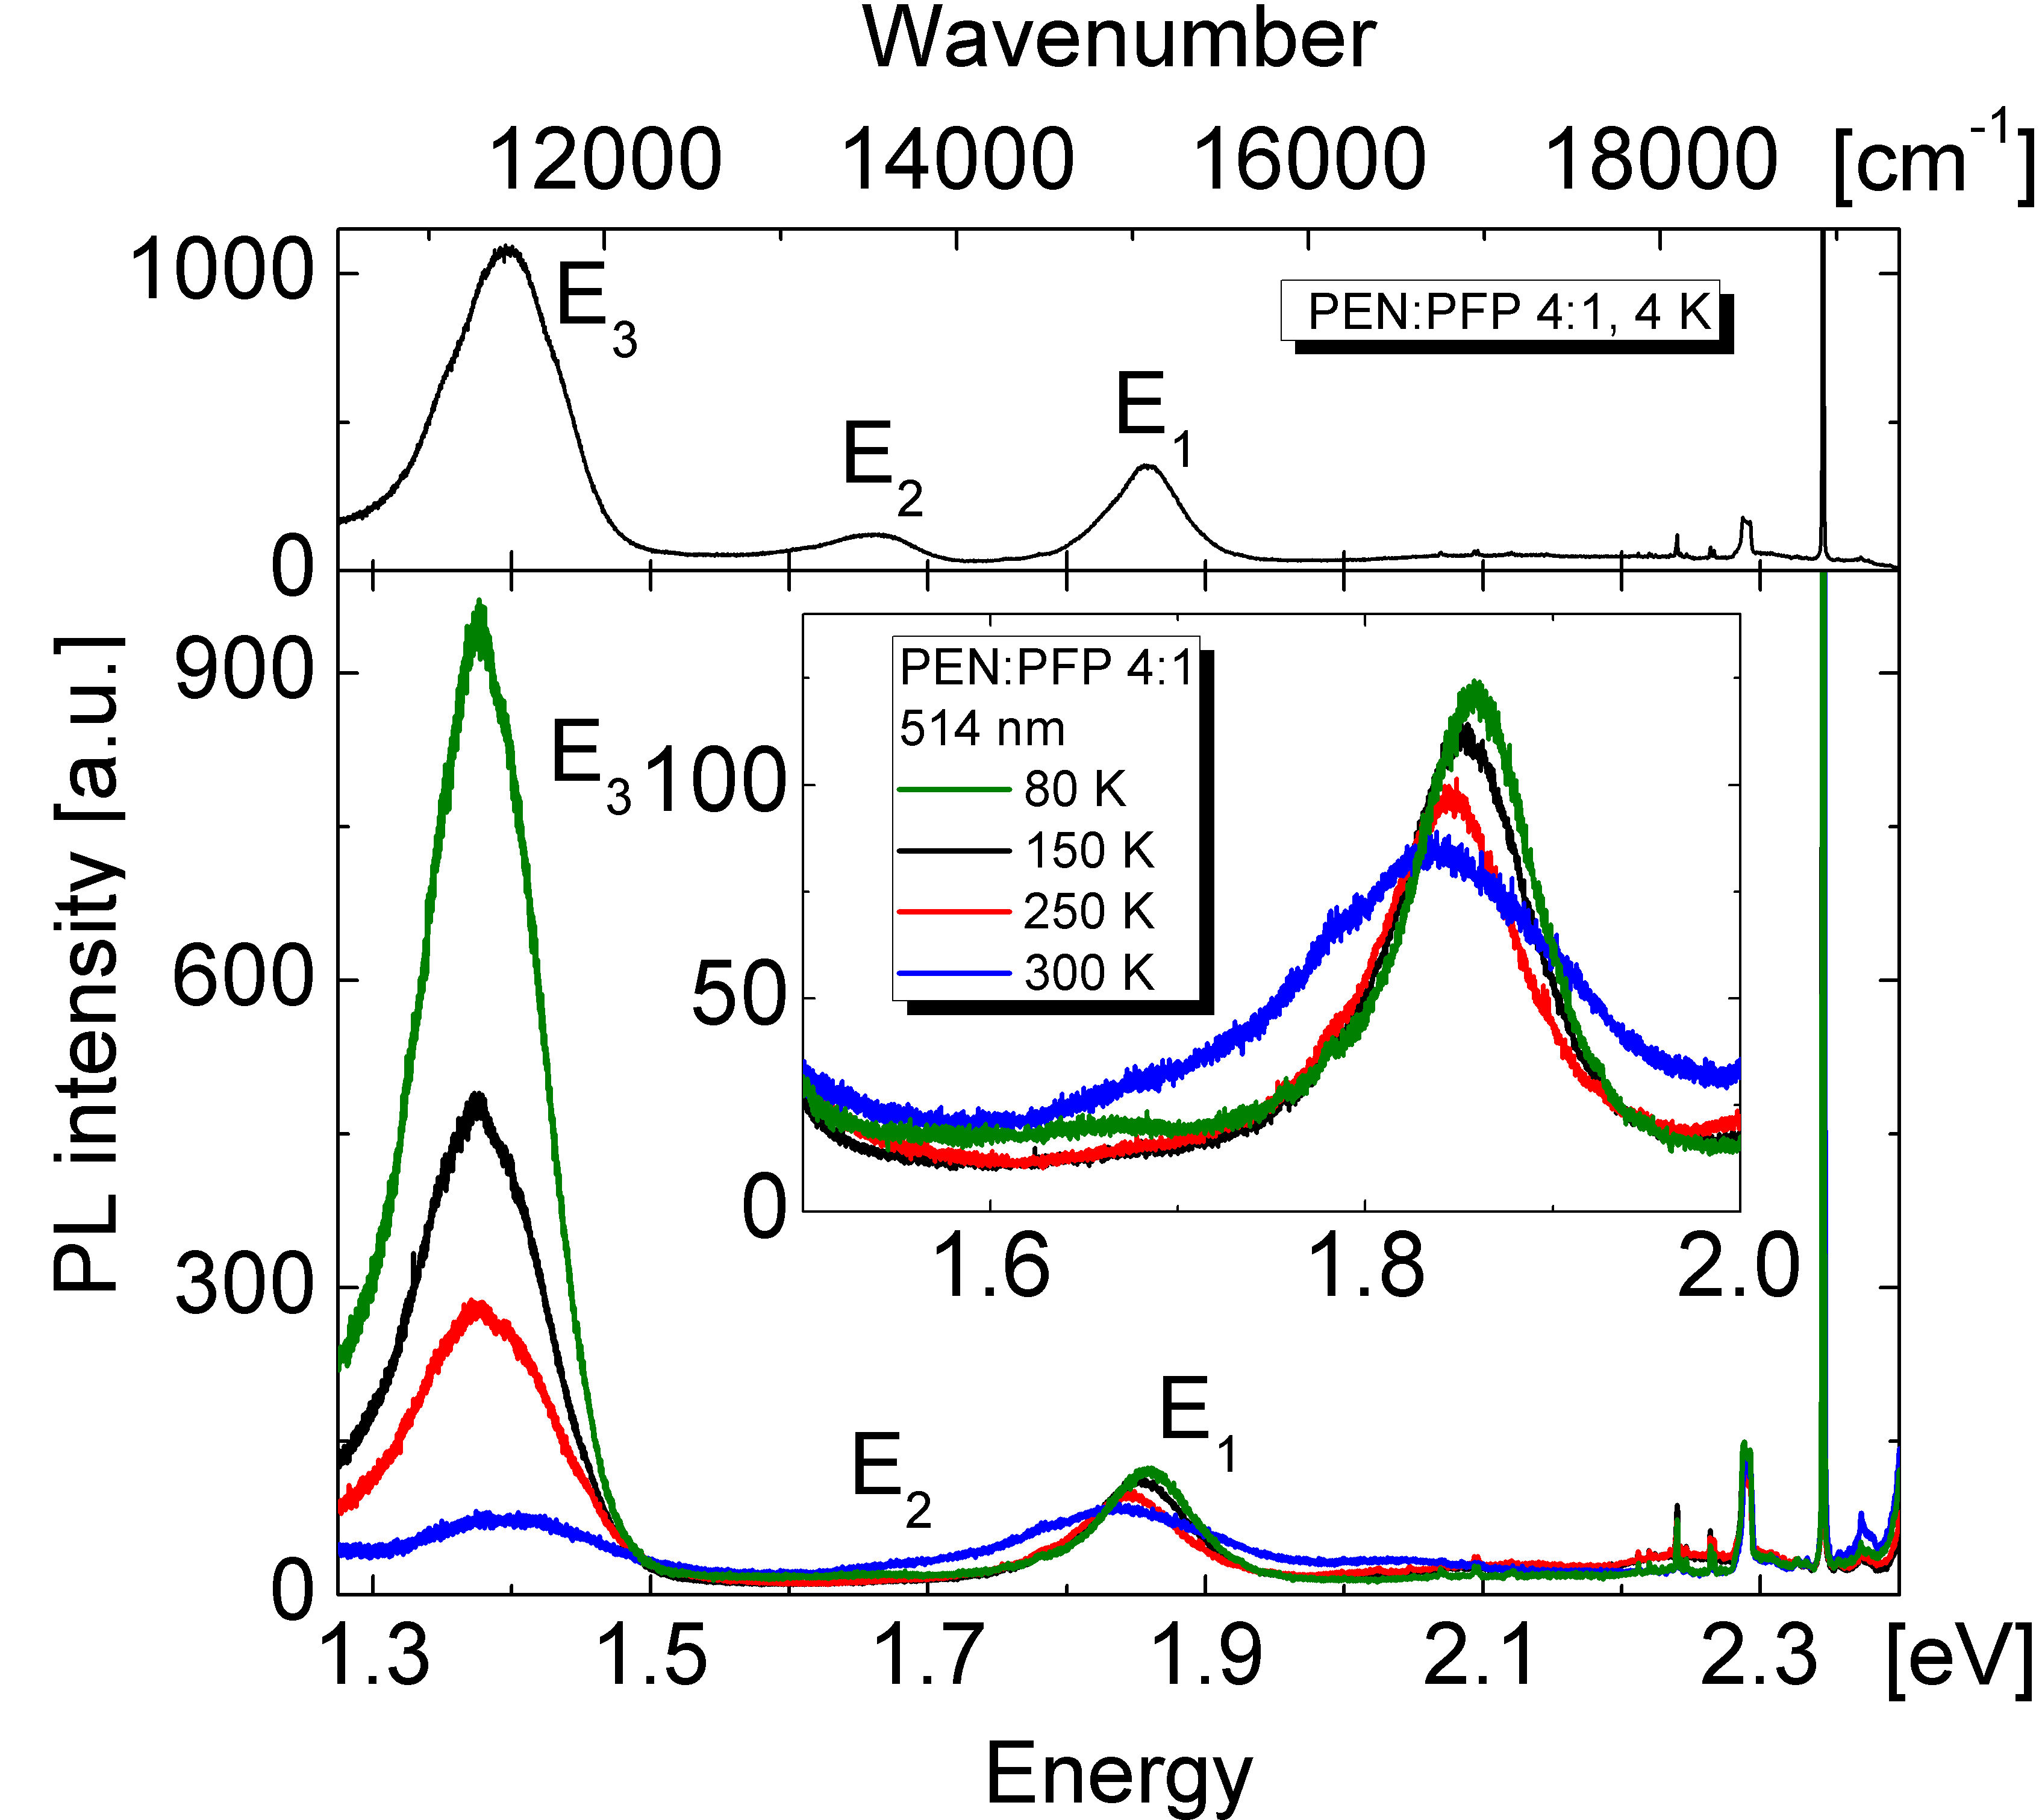
For the third blend (Fig. 5) with the PEN:PFP mixing ratio 4:1, three PL features to can be identified at 1.83 eV, 1.66 eV, and 1.41 eV, respectively. The bands of this mixture are separated and can be well resolved, and are both pronounced at RT. has generally the shape and position of band of PEN, however it is broader and shows a shoulder around 1.7 eV (see inset). Towards lower temperatures suffers a blueshift that is comparable to that of in PEN. increases continuously upon cooling down and becomes the dominant peak at low temperatures. We can observe a redshift of the peak by approximately 20 meV at low temperatures.
Below 100 K we observe a band , exhibiting an asymmetry resembling the shape of band in PEN. The ratio of the amplitude of and is equal to the ratio of to of PEN. Upon excitation with the 2.54 eV line of the Ar+-laser, we observe two peaks at 2.12 eV and 2.29 eV (not shown), analogously to the pure PEN spectrum. Tab. 3 gives an overview of the peaks observed for the three different PEN:PFP blends.
| PEN:PFP 1:1 | ||
|---|---|---|
| 1.88 eV | of PEN | |
| 1.7 eV | of PFP | |
| 1.57 eV | ||
| 1.4 eV | Likely CT PEN PFP | |
| PEN:PFP 1:2 | ||
| 1.88 eV | of PEN | |
| 1.7 eV | of PFP | |
| 1.56-1.58 eV | ||
| 1.4 eV | Likely CT PEN PFP | |
| PEN:PFP 4:1 | ||
| 1.83-1.84 eV | of PEN | |
| 1.66 eV | STE of PEN | |
| 1.41-1.39 eV | Likely CT PEN PFP | |
IV.2 Discussion of blends.
Obviously, the PL spectra of the mixtures differ strongly from the pure samples and cannot be regarded as simple superpositions of the PEN and PFP spectra, neither at RT nor at low temperatures. Importantly, at 4 K the 1:1 blend exhibits only one pronounced peak at around 1.4 eV () that does not occur either in pure PEN or PFP. Other peaks observable in the pure materials vanish completely, in particular in the region of the respective HOMO/LUMO transitions. Altogether, we consider this as clear evidence for intermolecular coupling of PEN and PFP. Since a good theoretical understanding of molecular mixed thin films is missing to a large extent, a unique assignment of PL peaks is difficult.
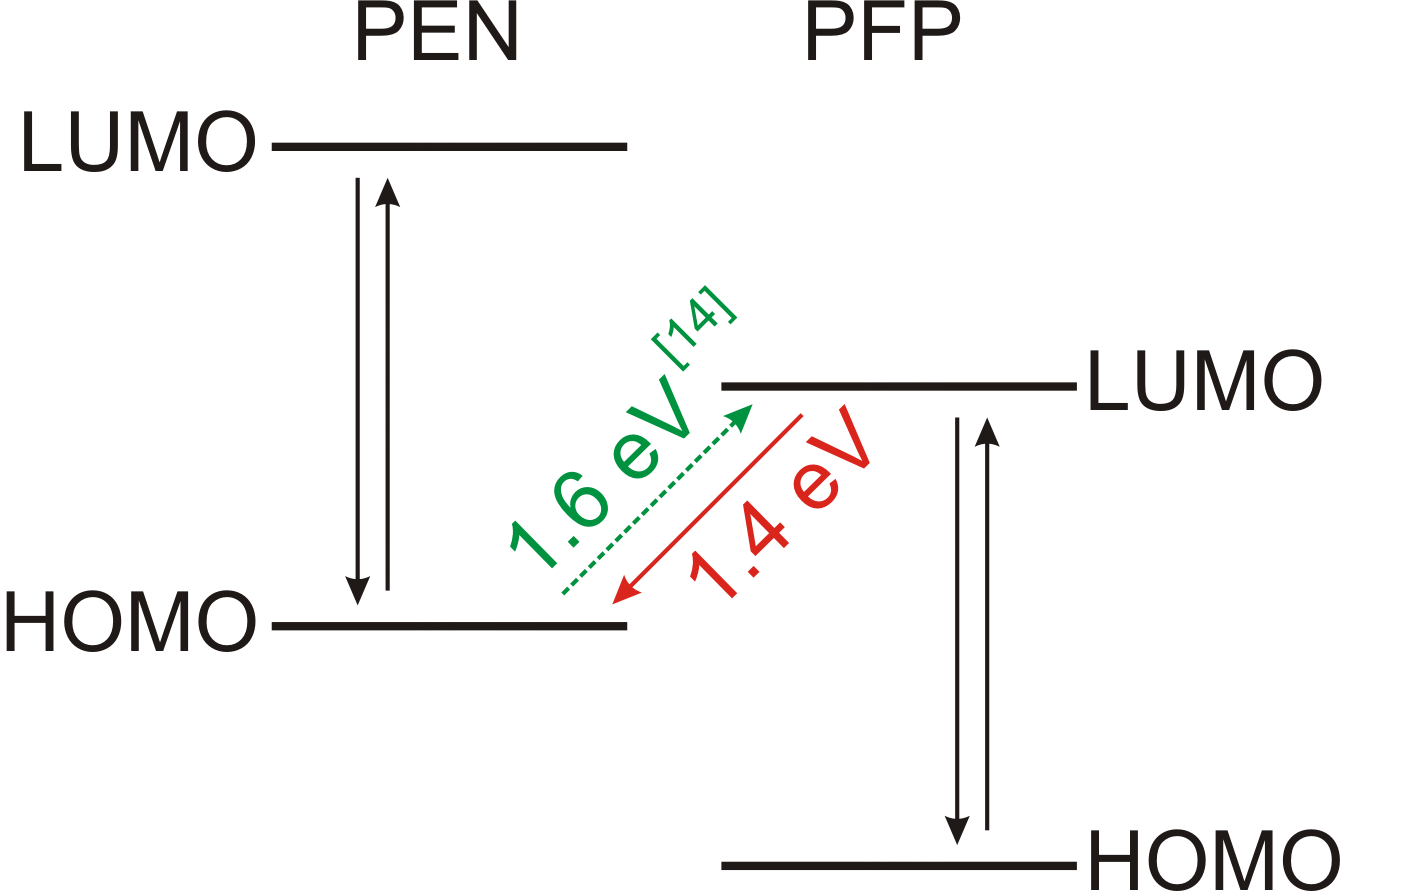
Concerning PEN:PFP blended thin films, in particular for equimolar mixtures, X-ray diffraction experiments Hinderhofer et al. (2011) indicate good intermixing of both materials on a molecular level. The disappearance of the transition of PEN and PFP at low temperatures in the blends raises interesting questions. Scaling with the mixing ratio, the suppression of the respective bands is most pronounced for the 1:1 mixture. For this reason, we relate it to intermolecular coupling effects between PEN and PFP. In the mixtures, excitonic states which would recombine radiatively in the pure phases may decay non-radiatively or transform into the state emitting at 1.4 eV, presumably a CT state delocalized over a hetero-interface as visualized in Fig. 6. A detailed analysis of the underlying mechanisms would require extensive calculations beyond the scope of the present paper. The existence of peaks in the region of the HOMO/LUMO transition of PEN and PFP, which we observe in the non-1:1 blended thin films, is consistent with X-ray diffraction results, where the formation of mixed PEN:PFP phases and pure PEN or PFP phases was reported. Hinderhofer et al. (2011) Hence, the transition at 1.4 eV is likely to originate from the intermixed phases forming also in the non-1:1 blended thin films, whereas transitions resembling pure PEN (, , , ) or PFP (, ) might be assigned to the respective pure phases in the mixtures. It appears reasonable that in the sample with a higher PEN ratio stems from the PEN transition, whereas peak of the sample with more PFP corresponds to the (30 meV blueshifted) PFP transition. The origin of a band in the mixtures at around 1.57 eV ( and ) remains unclear. Similar to CT transitions in pure PEN involving different geometries of the molecule pair Sebastian et al. (1981), it could be due to a CT transition between more distant molecules or due to a trap state, significantly below the transition energies of both pure phases of PEN and PFP.
A reasonable explanation for the transition at 1.4 eV could be that this band is related to a CT between the two components, particularly a CT between PEN and PFP is generally promoted by good molecular intermixing as found by X-ray diffraction Hinderhofer et al. (2011); Salzmann et al. (2008b). While the suppression of PEN and PFP bands in their respective region of HOMO/LUMO transitions is maximized for the equimolar mixture, we find that the intensity of the transition at 1.4 eV is favored by a higher PEN ratio. The only peak we observe in this region in the pure materials occurs for PEN (). However, transition in PEN, assigned to a vibronic progression of , cannot explain the transition at 1.4 eV in the blends because does not occur in any of the mixtures. Recombination processes are expected to be still less likely than in pure PEN films, because singlet fission should be suppressed by more efficient charge separation processes between PEN and PFP. This phenomenon was demonstrated already for PEN:C60Thorsmølle et al. (2009), where singlet fission is suppressed, so that the transient absorption from the lowest triplet is reduced accordingly.
Thus, we conclude that the band at 1.4 eV in the mixture cannot stem from any of the two single components alone. Instead, it represents a new transition that might be due to a CT between the components, i.e. related to a similar transition observed recently in absorption spectra of PEN:PFP blends at 1.6 eV Broch et al. (2011). As this absorption feature cannot be interpreted in terms of the known singlet transitions in the pure materials summarized in Tab. 2 and Sec. III.3, a weak charge transfer transition from the HOMO in PEN to the LUMO in PFP becomes the most likely assignment. Considering the relative alignment of the HOMO/LUMO levels of PEN and PFP as they result from photoelectron spectroscopy measurements Salzmann et al. (2008a) and DFT calculations Sakamoto et al. (2006); Medina et al. (2007), Fig. 6 sketches a possible energy diagram involving a CT.
| mixed PEN:PFP | |||
|---|---|---|---|
| CT transition energy | 1.60 eVa | 1.40 eVb | 1.73 eVc |
IV.3 Assignment of CT transition between PEN and PFP
In order to shed more light on the above data, DFT results for the energies of the frontier orbitals and for the ionization potential (IP) may be compared to published ultraviolet photoemission spectra (UPS) and optical transition energies. The IP is calculated as the difference between a neutral and a cationic molecule. In ultraviolet photoemission (UPS), multilayers of flat-lying PEN or PFP deposited on gold reveal HOMO binding energies and IPs of 5.45 eV or 6.20 - 6.40 eV below the respective vacuum level Koch et al. (2007). These values are about 0.4 - 0.5 eV below the DFT values for the ionization potential. Such changes in the absolute value of the IP can be related to the polarization of molecules surrounding the cationic site in the surface layer Tsiper and Soos (2003). Nevertheless, the difference between the measured HOMO levels of 0.75 to 0.95 eV is well reproduced by the calculated value of 0.79 eV, indicating that polarization effects in pure PEN and pure PFP films composed of lying molecules induce similar energy shifts. The calculated binding energies of the HOMO levels of both compounds remain 1.33 eV below the calculated IP, a deficiency of DFT which can be related to the wrong asymptotics of the exchange-correlation potential.van Leeuwen and Baerends (1994) The difference between the calculated frontier orbitals is 2.21 eV for PEN and 2.03 eV for PFP, in each case about 0.2 eV above the average energy of the observed transition energy.Broch et al. (2011)
When pure PEN or PFP films are grown on SiO2 like in the present work, the molecules adsorb close to upright. In this case, the opposite polarity of C-H and C-F bonds in the two compounds results in substantial changes of the UPS spectra, so that the difference between the HOMO positions increases to 1.9 eV.Salzmann et al. (2008a) However, for a mixed phase of standing molecules with mixing ratio 1:1, both compounds establish a common vacuum level so that the HOMO levels move towards each other, resulting in a much smaller splitting between eV for PFP and eV for PEN.Salzmann et al. (2008a) When using these UPS values for the HOMO energies together with the difference between the frontier orbitals calculated with DFT, one can deduce LUMO energies for the molecules in the mixed phase. On this basis, the difference between the LUMO of PFP and the HOMO of PEN gives an estimate of 1.73 eV for the CT gap between the two compounds, or about 0.13 eV above the observed absorption band at 1.60 eV reported in Tab. 4 Broch et al. (2011). This small difference indicates that energy corrections arising from the Coulomb interaction between the electron and the hole forming the CT state across the PEN-PFP interface remain somewhat smaller than the excitonic binding energy in the pure compounds.
Under the assumption that the excitonic binding energy in the pure compounds results in an average transition energy of 0.2 eV below the DFT gap energies, and that due to the Coulomb attraction between oppositely charged molecules, the above estimate for the CT state has to be reduced by 0.13 eV, we come to the assignment of the observed absorption bands visualized in Fig. 6. Hence, together with a Stokes shift of 0.2 eV arising from reorganization energies of about 0.1 eV for either positively charged PEN or for negatively charged PFP, we can assign the observed PL band at 1.4 eV to the CT transition in the mixed phase. The available experimental data are thus all nicely consistent with our interpretation.
V Summary and conclusion
We have studied PL spectra of PEN, PFP, and PEN:PFP mixed films grown on SiO2. For PFP, we find fewer radiative transitions than for PEN and identify a peak at 1.72 eV as the HOMO/LUMO transition exhibiting a vibronic progression. In the mixed PEN:PFP system, we find evidence for coupling in equimolar PEN:PFP blends. Broch et al. (2011) Based on experiments and theoretical analysis, we suggest that the transition at 1.4 eV originates from a CT state, i.e. similar to absorption measurements showing a corresponding feature at 1.6 eV. Broch et al. (2011) We believe that our experimental data along with broader theoretical interpretation help to understand the important issue of donor/acceptor coupling.
VI acknowledgment
We gratefully acknowledge financial support by the DFG, the DAAD, and the Studienstiftung des Deutschen Volkes.
References
- Brütting (2005) W. Brütting, Physics of Organic Semiconductors (Wiley-VCH, Weinheim, 2005).
- Wagner et al. (2010) J. Wagner, M. Gruber, A. Hinderhofer, A. Wilke, B. Bröker, J. Frisch, P. Amsalem, A. Vollmer, A. Opitz, N. Koch, F. Schreiber, and W. Brütting, Adv. Funct. Mater. 20, 4295 (2010).
- Salaneck et al. (2001) W. R. Salaneck, K. Seki, A. Kahn, and J.-J. Pireaux, Conjugated Polymer & Molecular Interfaces, 1st ed. (Marcel Dekker, New York, 2001).
- Witte and Wöll (2004) G. Witte and C. Wöll, J. Mater. Res. 19, 1889 (2004).
- Koch (2007) N. Koch, ChemPhysChem 8, 1438 (2007).
- Salzmann et al. (2008a) I. Salzmann, S. Duhm, G. Heimel, M. Oehzelt, R. Kniprath, R. L. Johnson, J. P. Rabe, and N. Koch, J. Am. Chem. Soc. 130, 12870 (2008a).
- Aoki-Matsumoto et al. (2001) T. Aoki-Matsumoto, K. Furuta, T. Yamada, H. Moriya, and K. Mizuno, Int. J. Mod. Phys. B 15, 3753 (2001).
- He et al. (2005a) R. He, X. Chi, A. Pinczuk, D. V. Lang, and A. P. Ramirez, Appl. Phys. Lett. 87, 211117 (2005a).
- Park et al. (2002) S. P. Park, S. S. Kim, J. H. Kim, C. N. Whang, and S. Im, Appl. Phys. Lett. 80, 2872 (2002).
- Sakamoto et al. (2006) Y. Sakamoto, T. Suzuki, M. Kobayashi, Y. Gao, Y. Inoue, and S. Tokito, Mol. Cryst. Liq. Cryst. 444, 225 (2006).
- Fujii et al. (2009) K. Fujii, C. Himcinschi, M. Toader, S. Kera, D. Zahn, and N. Ueno, J. Electron. Spectrosc. Relat. Phenom. 174, 65 (2009).
- Inoue et al. (2005) Y. Inoue, Y. Sakamoto, T. Suzuki, M. Kobayashi, Y. Gao, and S. Tokito, Jpn. J. Appl. Phys. 44, 3663 (2005).
- Hinderhofer et al. (2007) A. Hinderhofer, U. Heinemeyer, A. Gerlach, S. Kowarik, R. M. J. Jacobs, Y. Sakamoto, T. Suzuki, and F. Schreiber, J. Chem. Phys. 127, 194705 (2007).
- Broch et al. (2011) K. Broch, U. Heinemeyer, A. Hinderhofer, F. Anger, R. Scholz, A. Gerlach, and F. Schreiber, Phys. Rev. B 83, 245307 (2011).
- Medina et al. (2007) B. M. Medina, D. Beljonne, H.-J. Egelhaaf, and J. Gierschner, J. Chem. Phys. 126, 111101 (2007).
- Koch et al. (2008) N. Koch, A. Gerlach, S. Duhm, H. Glowatzki, G. Heimel, A. Vollmer, Y. Sakamoto, T. Suzuki, J. Zegenhagen, J. P. Rabe, and F. Schreiber, J. Am. Chem. Soc. 130, 7300 (2008).
- Anthony (2008) J. E. Anthony, Angew. Chem. Int. Ed. 47, 452 (2008).
- Salzmann et al. (2008b) I. Salzmann, S. Duhm, G. Heimel, J. P. Rabe, N. Koch, M. Oehzelt, Y. Sakamoto, and T. Suzuki, Langmuir 24, 7294 (2008b).
- Hinderhofer et al. (2011) A. Hinderhofer, C. Frank, T. Hosokai, A. Gerlach, A. Resta, and F. Schreiber, J. Chem. Phys. 134, 104702 (2011).
- Schreiber (2004) F. Schreiber, J. Phys.: Condens. Matter 16, R881 (2004).
- Mattheus et al. (2003) C. C. Mattheus, G. A. de Wijs, R. A. de Groot, and T. T. M. Palstra, J. Am. Chem. Soc. 125, 6323 (2003).
- He et al. (2010) R. He, N. G. Tassi, G. B. Blanchet, and A. Pinczuk, Appl. Phys. Lett. 96, 263303 (2010).
- He et al. (2005b) R. He, N. G. Tassi, G. B. Blanchet, and A. Pinczuk, Appl. Phys. Lett. 87, 103107 (2005b).
- Lim et al. (2004) S.-H. Lim, T. G. Bjorklund, F. C. Spano, and C. J. Bardeen, Phys. Rev. Lett. 92, 107402 (2004).
- Knupfer and Berger (2006) M. Knupfer and H. Berger, Chem. Phys. 325, 92 (2006).
- Jamorski et al. (1996) C. Jamorski, M. E. Casida, and D. R. Salahub, J. Chem. Phys. 104, 5134 (1996).
- Becke (1988) A. D. Becke, Phys. Rev. A 38, 3098 (1988).
- Lee et al. (1988) C. Lee, W. Yang, and R. G. Parr, Phys. Rev. B 37, 785 (1988).
- (29) M. J. Frisch, G. W. Trucks, H. B. Schlegel et al., “Gaussian 03, Revision D.01 (Gaussian, Inc., Wallingford, CT, 2004)” .
- Grimme and Parac (2003) S. Grimme and M. Parac, ChemPhysChem 3, 292 (2003).
- Hellweg et al. (2008) A. Hellweg, S. A. Grün, and C. Hättig, Phys. Chem. Chem. Phys. 10, 4119 (2008).
- Gisslén (2009) L. Gisslén, Influence of Frenkel Excitons and Charge Transfer States on the Spectroscopic Properties of Organic Molecular Crystals, Ph.D. thesis, Technische Universität München (2009).
- Rei Vilar et al. (1983) M. Rei Vilar, M. Heyman, and M. Schott, Chem. Phys. Lett. 94, 522 (1983).
- Amirav et al. (1981) A. Amirav, U. Even, and J. Jortner, J. Phys. Chem. 85, 309 (1981).
- Halasinski et al. (2000) T. M. Halasinski, D. M. Hudgins, F. Salama, L. J. Allamandola, and T. Bally, J. Phys. Chem. A 104, 7484 (2000).
- Thorsmølle et al. (2009) V. K. Thorsmølle, R. D. Averitt, J. Demsar, D. L. Smith, S. Tretiak, R. L. Martin, X. Chi, B. K. Crone, A. P. Ramirez, and A. J. Taylor, Phys. Rev. Lett. 102, 017401 (2009).
- Hellner et al. (1972) C. Hellner, L. Lindqvist, and P. C. Roberge, J. Chem. Soc., Faraday Trans. 2 68, 1928 (1972).
- Jundt et al. (1995) C. Jundt, G. Klein, B. Sipp, J. L. Moigne, M. Joucla, and A. A. Villaeys, Chem. Phys. Lett. 241, 84 (1995).
- Zimmerman et al. (2010) P. M. Zimmerman, Z. Zhang, and C. B. Musgrave, Nat. Chem. 2, 648 (2010).
- Sebastian et al. (1981) L. Sebastian, G. Weiser, and H. Bässler, Chem. Phys. 61, 125 (1981).
- Schlosser and Philpott (1980) D. W. Schlosser and M. R. Philpott, Chem. Phys. 49, 181 (1980).
- Koch et al. (2007) N. Koch, A. Vollmer, S. Duhm, Y. Sakamoto, and T. Suzuki, Adv. Mater. 19, 112 (2007).
- Tsiper and Soos (2003) E. V. Tsiper and Z. G. Soos, Phys. Rev. B 68, 085301 (2003).
- van Leeuwen and Baerends (1994) R. van Leeuwen and E. J. Baerends, Phys. Rev. A 49, 2421 (1994).