Constraining the High-Energy Emission from Gamma-ray Bursts with Fermi
Abstract
We examine 288 GRBs detected by the Fermi Gamma-ray Space Telescope’s Gamma-ray Burst Monitor (GBM) that fell within the field-of-view of Fermi’s Large Area Telescope (LAT) during the first 2.5 years of observations, which showed no evidence for emission above 100 MeV. We report the photon flux upper limits in the 0.110 GeV range during the prompt emission phase as well as for fixed 30 s and 100 s integrations starting from the trigger time for each burst. We compare these limits with the fluxes that would be expected from extrapolations of spectral fits presented in the first GBM spectral catalog and infer that roughly half of the GBM-detected bursts either require spectral breaks between the GBM and LAT energy bands or have intrinsically steeper spectra above the peak of the spectra (). In order to distinguish between these two scenarios, we perform joint GBM and LAT spectral fits to the 30 brightest GBM-detected bursts and find that a majority of these bursts are indeed softer above than would be inferred from fitting the GBM data alone. Approximately 20% of this spectroscopic subsample show statistically significant evidence for a cut-off in their high-energy spectra, which if assumed to be due to attenuation, places limits on the maximum Lorentz factor associated with the relativistic outflow producing this emission. All of these latter bursts have maximum Lorentz factor estimates that are well below the minimum Lorentz factors calculated for LAT-detected GRBs, revealing a wide distribution in the bulk Lorentz factor of GRB outflows and indicating that LAT-detected bursts may represent the high end of this distribution.
1 Introduction
Observations by the Fermi Gamma-ray Space Telescope have dramatically increased our knowledge of the broad-band spectra of gamma-ray bursts (GRBs). The Gamma-ray Burst Monitor (GBM) on board Fermi has detected over 700 GRBs in roughly 3 years of triggered operations. Of these bursts, 29 have been detected at energies 100 MeV by Fermi’s Large Area Telescope (LAT); and five of these bursts: GRB 080916C, GRB 090510, GRB 090328, GRB 090902B, and GRB 090926A, have been detected at energies GeV. The high-energy emission from the majority of these bursts show evidence for being consistent with the high-energy component of the smoothly joined broken power-law, commonly referred to as the Band spectrum (Band et al., 1993), that has been observed in the GBM energy range. Three of these bursts: GRB 090510 (Ackermann et al., 2010a), GRB 090902B (Abdo et al., 2009a), and GRB 090926A (Ackermann et al., 2011a), though, exhibit an additional hard spectral component that is distinct from the continuum emission observed at sub-MeV energies.
Similar high-energy emission above 100 MeV was detected by the Energetic Gamma-Ray Experiment Telescope (EGRET) onboard the Compton Gamma-Ray Observatory and by the AGILE spacecraft (Del Monte et al., 2011). The prompt high-energy emission detected by EGRET from GRB 930131 (Sommer et al., 1994; Kouveliotou et al., 1994) and GRB 940217 (Hurley et al., 1994), was consistent with an extrapolation of the GRB spectrum as measured by the Burst And Transient Source Experiment (BATSE) in the 25 keV2 MeV energy range. EGRET observations of GRB 941017 (González et al., 2003), on the other hand, showed evidence for an additional hard spectral component that extended up to 200 MeV, the first such detection in a GRB spectrum.
Unlike these previous detections by EGRET, many of the LAT detected bursts have measured redshifts, made possible through X-ray localizations by the Swift spacecraft (Gehrels et al., 2004) and ground-based follow-up observations of their long-lived afterglow emission. The high-energy detections, combined with the redshift to these GRBs, have shed new light into the underlying physics of this emission. At a redshift of (McBreen et al., 2010), the detection of GeV photons from GRB 090510 indicates a minimum bulk Lorentz factor of in order for the observed gamma rays to have avoided attenuation due to electron-positron pair production (Ackermann et al., 2010b). Furthermore, a spectral cut-off at GeV is quite evident in the high-energy component of GRB 090926A, which if interpreted as opacity due to attenuation within the emitting region, allows for a direct estimate of the bulk Lorentz factor of 700 for the outflow producing the emission (Ackermann et al., 2011b).
Perhaps equally important for unraveling the nature of the prompt emission is the lack of a significant detection above 100 MeV for the majority of the GRBs detected by the GBM. The LAT instrument has detected roughly 8 of the GBM-triggered GRBs that have occurred within the LAT field-of-view (FOV). This detection rate places limits on the ubiquity of the extra high-energy components detected by LAT, EGRET, and AGILE. Such a component would be a natural consequence of synchrotron emission from relativistic electrons in an internal shock scenario, but, for example, might be suppressed in Poynting flux dominated models (e.g., see Fan & Piran (2008)). Therefore, a systematic analysis of the non-detections of high-energy components in GBM-detected GRBs may significantly help to discriminate between various prompt emission mechanisms. Furthermore, the lack of a detection by the LAT of GBM-detected GRBs with particularly hard spectra points to intrinsic spectral cut-offs and/or curvature at high energies, giving us further insight into the physical properties of the emitting region.
In this paper, we examine the GBM-detected bursts that fell within the LAT field-of-view at the time of trigger during the first 2.5 years of observations which showed no evidence for emission above 100 MeV. We report the photon flux upper limits in the 0.110 GeV band during the prompt emission phase and for 30 s and 100 s integrations starting from the trigger time for each burst. We then compare these upper limits with the fluxes that would be expected from extrapolations of spectral fits presented in the first GBM spectral catalog (Goldstein et al., in press) in order to determine how well measurements of the MeV properties of GRBs can predict detections at MeV energies.
We find that roughly half of the GBM detected bursts either require spectral breaks or have intrinsically steeper spectra in order to explain their non-detections by the LAT. We distinguish between these two scenarios by performing joint GBM and LAT spectral fits to a subset of the 30 brightest bursts, as seen by the GBM that were simultaneously in the LAT field of view. We find that while a majority of these bursts have spectra that are softer above the peak of the spectra () than would be inferred from fitting the GBM data alone, a subset of bright bursts have a svstatistically significant high-energy spectral cut-off similar to the spectral break reported for GRB 090926A (Ackermann et al., 2011b). Finally, we use our joint GBM and LAT spectral fits in conjunction with the LAT non-detections at 100 MeV to place limits on the maximum Lorentz factor for these GRBs which show evidence for intrinsic spectral breaks
The paper is structured as follows: In section 2, we review the characteristics of the GBM and LAT instruments, and in section 3, we define the GRB samples considered in this work. In section 4, we describe the analysis we perform to quantify the significance of the LAT non-detections; we present the results in section 5, and discuss the implications they have on our understanding of the properties associated with the prompt gamma-ray emission in section 6.
2 The LAT and GBM Instruments
The Fermi Gamma-ray Space Telescope carries the Gamma-ray Burst Monitor (Meegan et al., 2009a) and the Large Area Telescope (Atwood et al., 2009). The GBM has 14 scintillation detectors that together view the entire unocculted sky. Triggering and localization are performed using 12 sodium iodide (NaI) and 2 bismuth germanate (BGO) detectors with different orientations placed around the spacecraft. The two BGO scintillators are placed on opposite sides of the spacecraft so that at least one detector is in view for any direction on the sky. GBM spectroscopy uses both the NaI and BGO detectors, sensitive between 8 keV and 1 MeV, and 150 keV and 40 MeV, respectively, so that their combination provides an unprecedented 4 decades of energy coverage with which to perform spectroscopic studies of GRBs.
The LAT is a pair conversion telescope comprising a array of silicon strip trackers and cesium iodide (CsI) calorimeters covered by a segmented anti-coincidence detector (ACD) to reject charged-particle background events. The LAT covers the energy range from 20 MeV to more than 300 GeV with a field-of-view of steradians. The dead time per event of the LAT is nominally 26.50 s for most events, although about 10 of the event read outs include more calibration data, which engender longer dead times. This dead time is 4 orders of magnitude shorter than that of EGRET. This is crucial for observations of high-intensity transient events such as GRBs. The LAT triggers on many more background events than celestial gamma rays. Onboard background rejection is supplemented on the ground using event class selections that accommodate the broad range of sources of interest.
3 Sample Definition
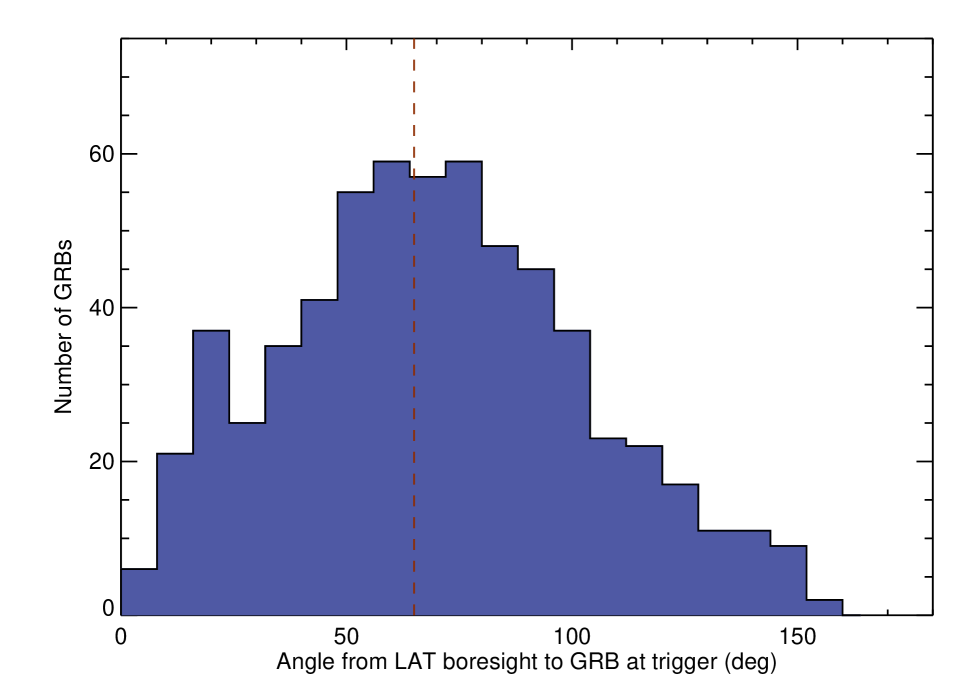
We compiled a sample of all GRBs detected by the GBM between the beginning of normal science operations of the Fermi mission on 2008 August 4th up to 2011 January 1st, yielding a total of 620 GRBs. Of these, 288 bursts fell within 65∘ of the LAT z-axis (or boresight) at the time of GBM trigger, which we define as the LAT FOV. Bursts detected at angles greater than at the time of the GBM trigger were not considered for this analysis, due to the greatly reduced sensitivity of the instrument for such large off-axis angles. A plot of the distribution of the LAT boresight angles at trigger time, , for all 620 bursts is shown in Figure 1. Roughly half (46) of the GBM-detected GRBs fell within the LAT FOV at , as expected given the relative sky coverage of the two instruments. These bursts make up the sample for which the photon flux upper limits described in the next section have been calculated. A complete list of the 288 bursts in the sample, their positions, their durations, and their LAT boresight angles is given in Table 1.
We defined a subsample of 92 bursts which had a rate trigger greater than 75 counts s-1 in at least one of the two BGO detectors. This criteria is similar to the one adopted by Bissaldi et al. (2011) in their analysis of the brightest GBM detected bursts in the first year of observations. Hereafter, we refer to these 92 bursts as the “bright BGO subsample”; it comprises likely candidates for which it would be possible to find evidence of spectral curvature above the upper boundary of the nominal BGO energy window of MeV. Finally, we define our so-called “spectroscopic subsample” as the 30 bursts (of the bright BGO subsample) that have sufficient counts at higher energies to allow for the index of a Band function fit to be determined with standard errors . This spectroscopic subsample was used in joint fits with the LAT data to test models containing spectral breaks or cut-offs.
4 Analysis
4.1 LAT Upper Limits
We derive upper limits for the 288 GRBs that were detected by the GBM and fell in the LAT FOV from the LAT data using two methods. The first consists of the standard unbinned likelihood analysis using the software developed and provided by the LAT team, while the second method simply considers the total observed counts within an energy-dependent acceptance cone centered on the GBM burst location. The likelihood analysis will give more constraining upper limits, but since it uses the instrumental point-spread-function (PSF) information to model the spatial distribution of the observed photons, in cases where the burst location is inaccurate and burst photons are present, it can give less reliable constraints. The latter method will be less constraining in general, but it will also be less sensitive to errors in the burst location, as the analysis considers photons collected over a fixed aperture and does not otherwise use the burst or photon positions on the sky. We use both methods to obtain photon flux upper limits over a 0.110 GeV energy range.
For the unbinned likelihood analysis, we used the standard software package provided by the LAT team, (ScienceTools version v9r15p6)111http://fermi.gsfc.nasa.gov/ssc/. We selected “transient” class events in a acceptance cone centered on the burst location, and we fit the data using the pyLikelihood module and the P6_V3_TRANSIENT response functions (Atwood et al., 2009). Each burst is modeled as a point source at the best available location, derived either from an instrument with good localization capabilities (e.g. Swift or LAT) or by the GBM alone. Of the 288 GRBs considered here, , In the likelihood fitting, the expected distribution of counts is modeled using the energy-dependent LAT PSF and a power-law source spectrum. The photon index of the power-law is fixed to either the value found from the fit of the GBM data for that burst or, if the GBM data are not sufficiently constraining (i.e. ), to , the mean value found for the population of BATSE-detected bursts (Preece et al., 2000a; Kaneko et al., 2006). An isotropic background component is included in the model, and the spectral properties of this component are derived using an empirical background model (Abdo et al., 2009c) that is a function of the position of the source in the sky and the position and orientation of the spacecraft in orbit. This background model accounts for contributions from both residual charged particle backgrounds and the time-averaged celestial gamma-ray emission.
Since we are considering cases where the burst flux in the LAT band will be weak or zero, the maximum likelihood estimate of the source flux may actually be negative owing to downward statistical fluctuations in the background counts. Because the unbinned likelihood function is based on Poisson probabilities, a prior assumption is imposed that requires the source flux to be non-negative. This is necessary to avoid negative probability densities that may arise for measured counts that are found very close to the GRB point-source location because of the sharpness of the PSF. On average, this means that for half of the cases in the null hypothesis (i.e., zero burst flux), the “best-fit” value of the source flux is zero but does not correspond to a local maximum of the unconstrained likelihood function (Mattox et al., 1996).
Given the prior of the non-negative source flux, we treat the resulting likelihood function as the posterior distribution of the flux parameter. In this case, an upper limit may be obtained by finding the flux value at which the integral of the normalized likelihood corresponds to the chosen confidence level (Amsler et al., 2008). For a fully Bayesian treatment, one would integrate over the full posterior distribution, i.e., marginalize over the other free parameters in the model. However, in practice, we have found it sufficient to treat the profile likelihood function as a one-dimensional probability distribution function (pdf) in the flux parameter. Again, in the limit of Gaussian statistics and a strong source, this method is equivalent to the use of the asymptotic standard error for defining confidence intervals. Hereafter, we will refer to this treatment as the “unbinned likelihood” method.
In the second set of upper limit calculations, we implement the method described by Helene (1983) and the interval calculation implemented in Kraft et al. (1991). Here, the upper limit is computed in terms of the number of counts and is based on the observed and estimated background counts within a prescribed extraction region. For the LAT data, the extraction region is an energy-dependent acceptance cone centered on the burst position. Since the burst locations from the GBM data have typical systematic uncertainties 3.2∘ (Connaughton et al. 2011), the size of the acceptance cone at a given energy is taken to be the sum in quadrature of the LAT 95% PSF containment angle and the total (statistical + systematic) uncertainty in the burst location. The counts upper limits are evaluated over a number of energy bands, converted to fluxes using the energy-dependent LAT exposure at the burst location, and then summed to obtain the final flux limit. Since this method relies on comparing counts without fitting any spectral shape parameters, we will refer to this as the “counting” method.
The time intervals over which the upper limits are calculated are important for their interpretation. For both upper limit methods, we consider three time intervals: two fixed intervals of 30 and 100 seconds post-trigger, and a “T100” interval that is determined through the use of the Bayesian Blocks algorithm (Jackson et al., 2005) to estimate the duration of burst activity in the NaI detector that has the largest signal above background. For the T100 interval, an estimate of the time-varying background count rate is obtained by fitting a 3rd degree polynomial to the binned data in time intervals outside of the prompt burst phase. Nominally, we take to s and s to , where is the GBM trigger time and s, although we increased the separation of these intervals in some cases to accommodate longer bursts. The counts per bin is then subtracted by the resulting background model throughout the to interval, and the binned reconstruction mode of the Bayesian Blocks algorithm is applied. The T100 interval is then defined by the first and last change points in the Bayesian Blocks reconstruction.
The two fixed time intervals have been introduced so as to not bias our results through assumptions regarding the durations of the high energy components. The brighter LAT-detected GRBs have exhibited both delayed and extended high-energy emission on time scales that exceed the durations traditionally defined by observations in the keVMeV energy range (Abdo et al. 2011). Hence, we search for and place limits on emission over intervals that may in some cases exceed the burst duration. We will discuss the implications of the limits found for the various time intervals in section 5.1.
4.2 GBM Spectroscopy
For the 92 bursts in the bright BGO subsample, we performed spectral fits to the NaI and BGO data and estimated the flux expected to be seen by the LAT between - GeV using the GBM fitted Band function (Band et al., 1993) parameters. The selection of background and source intervals for all bursts were performed manually through the use of the RMFIT (version 3.3) spectral analysis software package222http://fermi.gsfc.nasa.gov/ssc/data/analysis/user/. Because the number of counts in the highest BGO energy bins is often in the Poisson regime, we use the Castor modification (Castor, 1995) to the Cash statistic (Cash, 1976), commonly referred to as C-Stat 333http://heasarc.nasa.gov/xanadu/xspec/manual/manual.html, since the standard statistic is not reliable for low counts. The variable GBM background for each burst is determined for all detectors individually by fitting an energy-dependent, second order polynomial to the data several hundred seconds before and after the prompt GRB emission. The standard 128 energy bin CSPEC data (Meegan et al., 2009b) from the triggered NaI and BGO detectors were then fit from 8 keV to 1 MeV and from 200 keV to 40 MeV, respectively, for each burst.
As we noted above, only 30 bursts in the bright BGO subsample have sufficient signal-to-noise to constrain the high-energy power-law index of the Band function to within . Although we considered a variety of models in our spectral analysis, we found that the Band function was sufficient to describe the spectral shape for all of these bursts.
5 Results
5.1 LAT Upper Limits
Of the 288 GRBs in our sample, we were able to obtain upper limits, at 95% confidence level (CL), for 270 bursts using the unbinned likelihood method and 95% CL upper limits for 250 bursts using the counting method for the T100 intervals derived from the GBM data. The GRBs for which upper limits could not be calculated were bursts that occurred either during spacecraft passages through the South Atlantic Anomaly (SAA) or at angles with respect to the Earth’s zenith that were , thereby resulting in diffuse emission at the burst locations that was dominated by -rays from the Earth’s limb produced by interactions of cosmic rays with the earth’s atmosphere. These cases where the burst occurred at a high angle with respect to the zenith primarily affects the counting method, because it requires a reliable estimate of the background during the burst, and our method to estimate the background does not account for Earth limb emission. The likelihood method can fit for an Earth limb as a diffuse component, but it may give weaker limits since the background level is not as tightly constrained in this case compared to when the empirical background estimate can be used to model all of the non-burst emission. The photon flux upper limits found for the likelihood method for all three time intervals are presented in the last three columns of Table 1.
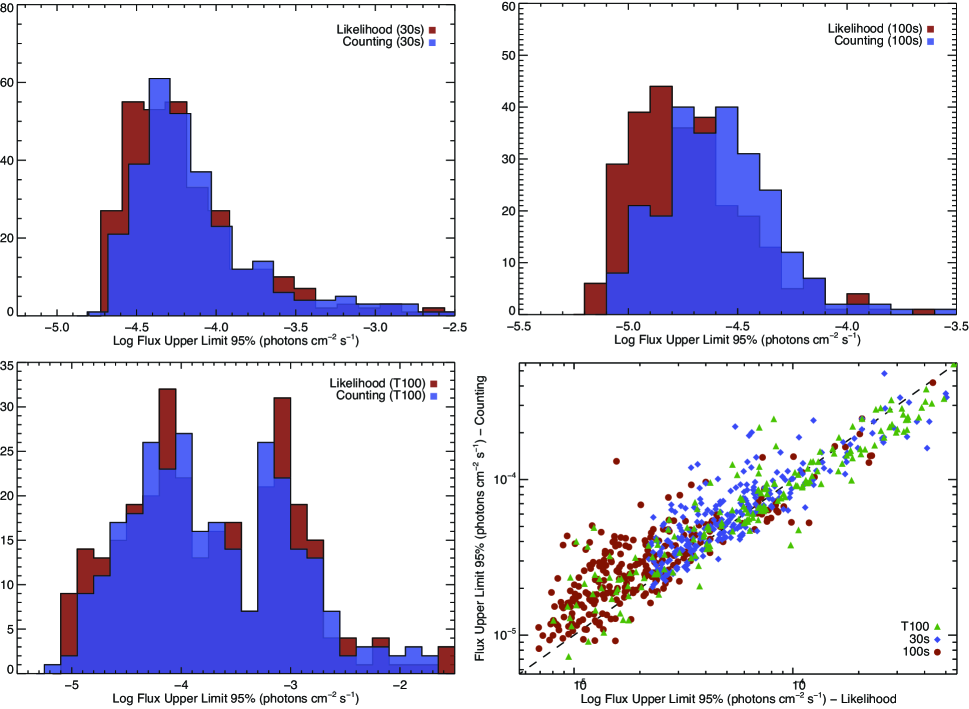
The distributions of the 95% CL photon flux upper limits obtained via the likelihood and counting methods for the 30 s, 100 s, and T100 time intervals are shown in upper-left, upper-right, and lower-left panels of Figure 2, respectively. As expected, the likelihood limits are systematically deeper than those found using the counting method over the same time interval. For either method, the upper limits for the 100 s integrations are roughly half an order-of-magnitude deeper than for the 30 s integrations. In the photon-limited case, this is expected since the flux limit at a specified confidence level should be inversely proportional to the exposure. The doubly peaked upper limits distribution that appears in the upper-left panel of Figure 2 for the T100 duration reflects the bimodal duration distribution for the short and long GRB populations. The median of the T100 upper limit distribution for the likelihood method is photons cm-2 s-1 with a standard deviation of ; whereas the counting method distribution has a median of photons cm-2 s-1 and . The median of the 30 s upper limits distribution for the likelihood method is photons cm-2 s-1 with a standard deviation of ; whereas the counting method distribution has a median of photons cm-2 s-1 and . The median of the 100 s upper limits distribution for the likelihood method are photons cm-2 s-1 and and photons cm-2 s-1 and for the counting method.
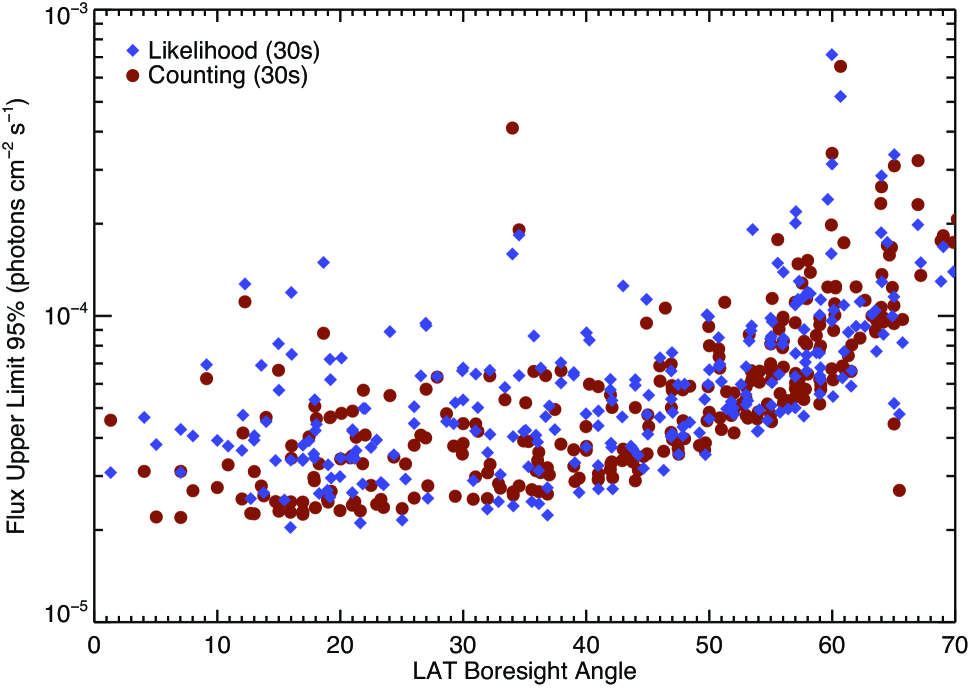
A comparison of the likelihood and counting methods for all three time intervals for is shown in the lower-right panel of Figure 2. The scatter in the upper limits distribution for both methods is largely due to the range of angles at which the GRBs occurred with respect to the LAT boresight, resulting in different effective areas and hence different exposures for each burst. The LAT exposure as a function of the off-axis angle drops steeply with increasing inclination, resulting in a shallowing of the LAT upper limits as a function of increasing off-axis angle, which can be seen in Figure 3. Overall, the two methods give consistent results for the bursts in our sample, and therefore we will hereafter focus primarily on the limits obtained with the likelihood method in our discussion of the implication of these results.
Despite the dependence of the upper limit values on off-axis angle, the distribution of LAT photon flux upper limits is relatively narrow for angles , allowing us to define an effective LAT sensitivity assuming a typical GRB spectrum (i.e., ). We can therefore set sensitivity thresholds for the corresponding median photon flux upper limit for each integration time of photons cm-2s-1and photons cm-2s-1.
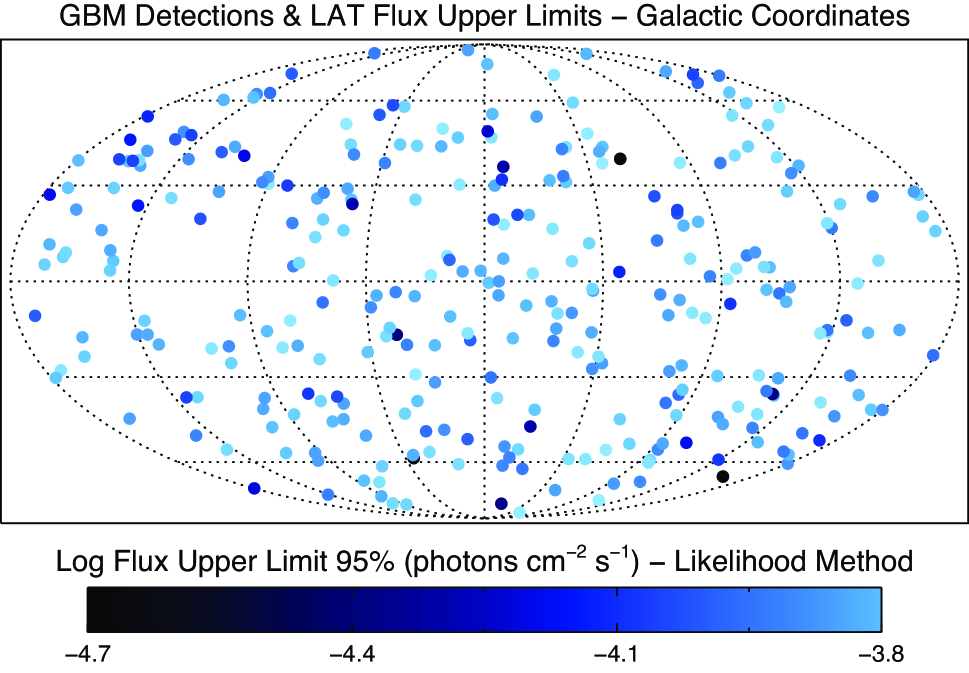
Finally, in Figure 4 we plot the location of each burst on the sky in Galactic coordinates, color-coded to represent the likelihood-determined photon flux upper limits. There is no evidence of a spatial dependence of the GBM detection rate nor of the magnitude of the LAT upper limit, as a function of Galactic latitude .
5.2 GBM Spectral Fits and Upper Limit Comparisons
We compare the LAT upper limits calculated over the burst duration to the expected 0.110 GeV photon fluxes found through extrapolations of spectral fits presented in the first GBM spectral catalog (Goldstein et al. in press). We focus this analysis on bursts for which a Band spectral model was a preferred fit compared to models with fewer degrees of freedom, since alternative models such as Comptonized spectra suffer sharp drops in expected flux at high-energy and are not expected to result in LAT detections without the presence of additional spectral components. Of the 487 GRBs presented in that catalog, a Band model fit was preferred over simpler models for 161 bursts, 75 of which appeared in the LAT field of view. For this comparison, the LAT upper limits were recalculated for a duration that matched the interval used in the GBM spectral catalog (see Goldstein et al. 2011 for a detailed discussion of their interval selection). We next performed a simulation in which we varied the expected LAT photon flux fitted values using the associated errors for each burst in order to determine the median number of bursts over all realizations that would fall above the LAT upper limit. In a total of realizations, we find that 50 of the GRBs in the GBM spectral catalog, which prefer a Band model fit, have expected 0.110 GeV photon fluxes that exceeds the LAT upper limit.
We investigate the differences between the GBM-based extrapolations and the LAT upper-limits further by performing detailed spectral fits to our spectroscopic subsample. The spectral parameters obtained from the fits to the GBM data only for the 30 GRBs in this spectroscopic subsample are listed in Table 2. The median values of the low and high energy power-law indices and the peak of the spectra are , , and keV, with standard deviations of , , and keV, respectively. The distributions of spectral parameters for these bursts are consistent with similar distributions found for BATSE-detected GRBs (Preece et al., 2000a; Kaneko et al., 2006). The time durations used in the spectral fits and the time-averaged photon flux values in the 0.0220 MeV energy range for these GRBs are given in Table 3. In the third column, we list the expected flux in the 0.110 GeV energy range assuming a power-law extrapolation of the Band function fit to the GBM data; and in the fourth column, we give the measured LAT photon flux upper limit found for the same time interval. The errors on the expected LAT photon fluxes were determined using the covariance matrices obtained from the GBM spectral fits.
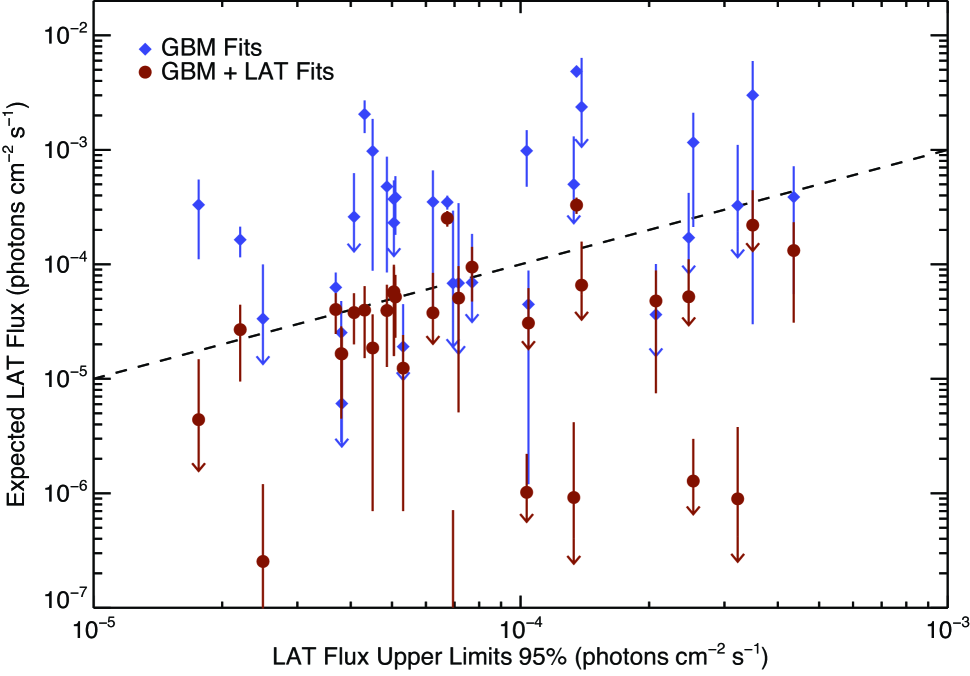
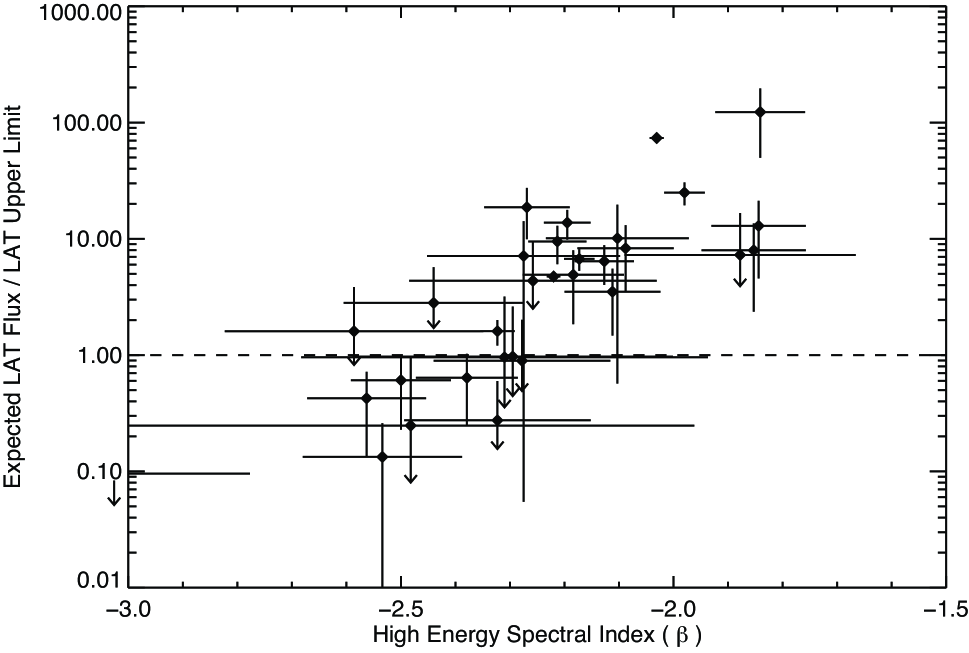
A comparison of the LAT photon flux upper limits versus the expected 0.110 GeV photon fluxes for each burst in our spectroscopic subsample is shown as blue data points in Figure 5. The downward arrows on the expected flux values indicate values that are consistent with zero within the 1- errors shown. The dashed line represents the line of equality between the expected LAT photon flux and the LAT photon flux upper limits when calculated for the durations presented in Table 5. In a total of realizations, we find that 53 of GRBs in our spectroscopic subsample have expected 0.110 GeV photon fluxes that exceed their associated 95% CL LAT upper limit. As with the flux comparison, roughly 50 in our sample also have expected fluence values that exceed the 95% CL LAT fluence upper limit. Figure 6 shows that the degree to which the expected flux in the LAT energy range from these bursts exceed our estimated LAT upper limits correlates strongly with the measured high energy spectral index, with particularly hard bursts exceeding the estimated LAT sensitivity by as much as a factor of 100. Again, the spectral fits to the bright bursts detected by the BGO clearly shows that a simple extrapolation from the GBM band to the LAT band systematically over-predicts the observed flux.
5.3 Joint GBM and LAT Spectral Fits
Including the LAT data in the spectral fits drastically alters the best-fit Band model parameters and the resulting expected photon flux in the LAT energy range. The best-fit parameters of the joint spectral fits for the spectroscopic subsample can be found in Table 4. The high-energy spectral indices are typically steeper (softer) than found from fits to the GBM data alone.
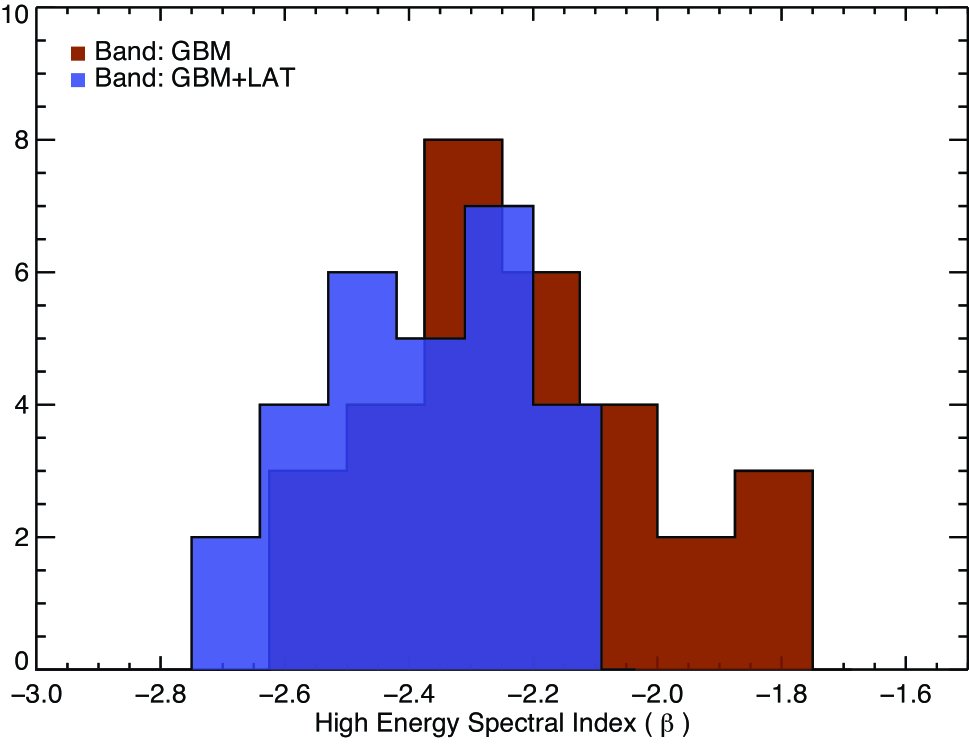
The difference in the values for the joint fits with respect to the fits to the GBM data alone can be found in Column 8 of Table 4. The resulting distributions are shown in Figure 7. The GBM-only distribution (red histogram) peaks at , matching the distribution found for the population of BATSE-detected bursts presented in Preece et al. (2000a). In contrast, the distribution found from the joint fits (blue histogram) indicates spectra that are considerably softer, with a median value of . While the GBM-only distribution includes 5 GRBs with , no bursts had values this hard from the joint fits. The low energy power-law index and the peak of the spectra, distribution remain relatively unchanged. In Figure 5, we compare the LAT photon flux upper limits calculated over the burst duration presented in Table 4 versus the expected 0.110 GeV photon fluxes for each burst, now using a power-law extrapolation of the Band function that was fit to both the GBM and LAT data. The softer values obtained through the joint fits yield expected LAT photon flux values that are more consistent with the LAT non-detections, with only 23 of the bursts in our spectroscopic subsample with expected flux values that exceed the 95% CL LAT flux upper limit given realizations of the data about their errors. We find that a similar ratio of bursts have expected fluence values that exceed their associated 95% CL LAT fluence upper limit.
5.4 Spectral Breaks or Softer Spectral Indices?
Although the discrepancy between the predicted 0.110 GeV fluxes from the GBM-only fits and the LAT upper limits can be explained by the softer values in the joint fits, intrinsic spectral breaks at energies MeV can also reconcile the conflicting GBM and LAT results. Determining whether softer values or spectral breaks are present has at least two important implications: If the spectral breaks or cut-offs arise from intrinsic pair production () in the source, then the break or cut-off energy would provide a direct estimate of the bulk Lorentz factor of the emitting region within the outflow On the other hand, an intrinsically softer distribution of values would mean that theoretical inferences based on the distributions found by fitting BATSE or GBM data alone may need to be revised. Evidence for either spectral breaks or softer values could also provide support for multi-component models that have been used to describe novel spectral features detected by the GBM and LAT (e.g., Guiriec et al., 2011a).
For the joint fitting of the GBM and LAT data, deciding between the two possibilities for any single burst can be cast as a standard model selection problem. Under the null hypothesis, we model the GRB spectrum using a simple Band function, as we have done in section 5.3. As an alternative hypothesis, we could extend the Band model to account for the presence of a spectral break. This may be done via an additional break energy above the Band , effectively using a doubly broken power-law in the fit; or it could be accomplished by adding an exponential cut-off to the Band model with cut-off energy . In either case, the null and alternative hypotheses are “nested” such that the former is a special case of the latter for some values of the extra model parameters that are introduced. Assuming there are additional free parameters under the alternative model, then whether the alternative model is statistically preferred would be given by the C-Stat value assuming it follows a distribution for degrees-of-freedom.
For the purposes of this analysis, we have adopted an alternative model consisting of a Band function plus a step function fixed at 50 MeV. Although unphysical, a simple step function introduces a single additional degree-of-freedom and can adequately represent the need for a break in the high-energy spectra. This additional degree-of-freedom represents the normalization of the Band function’s high-energy component above 50 MeV, which is left to vary, leading to the normalization of the power-law above 50 MeV being adjusted such that it is always consistent with the LAT upper limits. For this analysis, the index of the power-law above the break is fixed to match the Band function’s high-energy power-law index, which is allowed to vary as a free parameter. Since this introduces a single extra degree-of-freedom, a value of C-Stat would represent a ¿ improvement in the fit. We adopt this criterion as the threshold for a statistical preference for a break in the high-energy spectrum of an individual GRB.
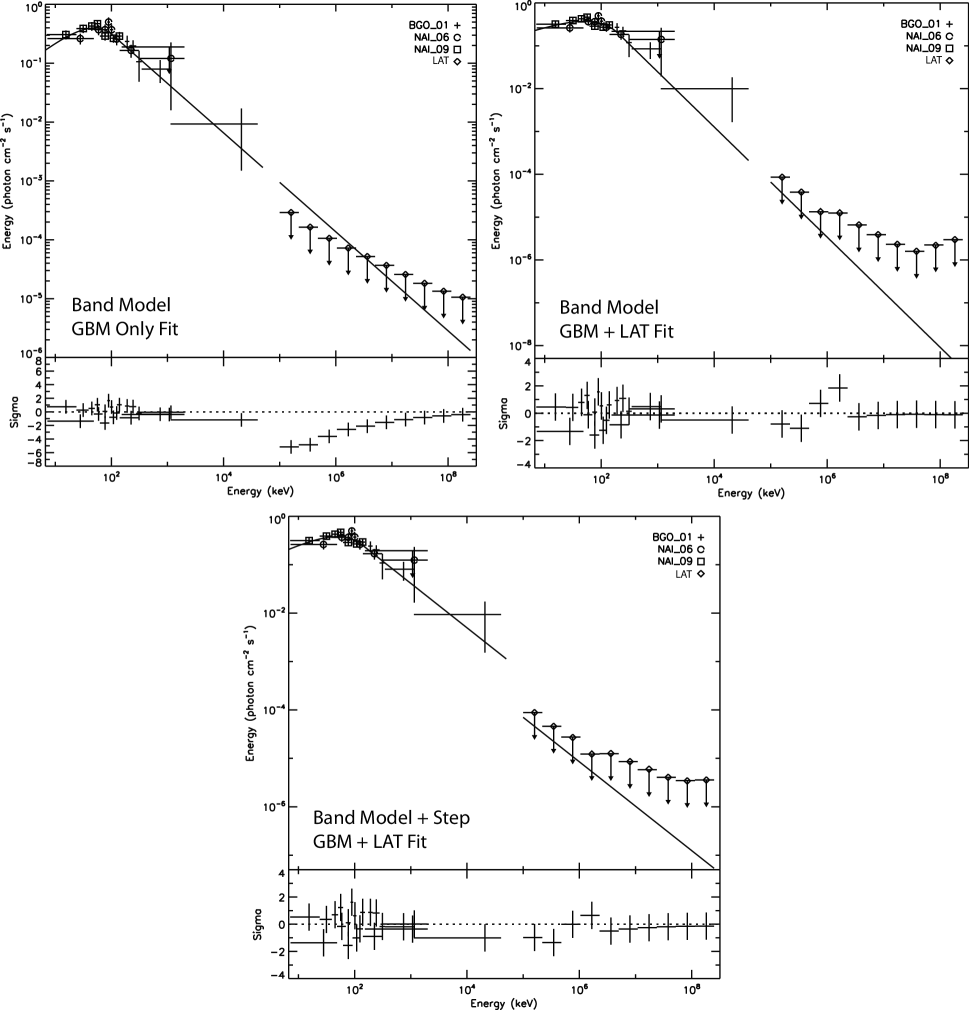
An example of such a fit can be seen in Figure 8, where the three panels show (clockwise) a Band model fit to GBM data alone, a Band model fit to both the GBM and LAT data, and a Band model plus a step function fit to the GBM and LAT data. The difference between the first two panels demonstrates the degree to which the high-energy spectral index can steepen to accommodate the LAT data, despite being outside of the range allowed by the statistical uncertainty in the determination made through the GBM fit alone. The third panel shows the effect of introducing a step function between the two instruments, in which the requirement for a softer value is alleviated. For the fit shown in Figure 8, the value determined through the Band model plus a step function fit is consistent with the value found by fitting a Band model to the GBM data alone.
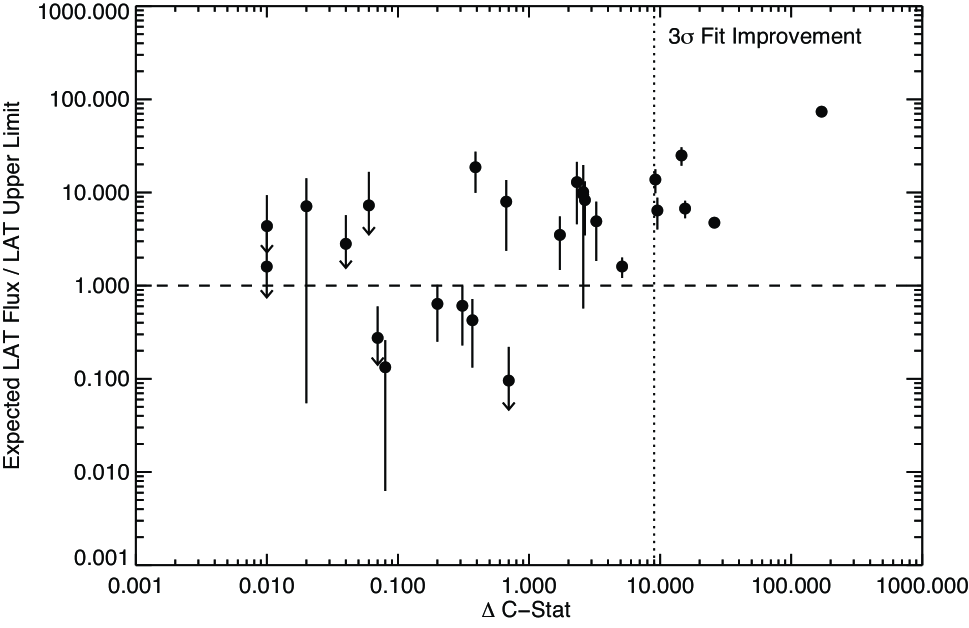
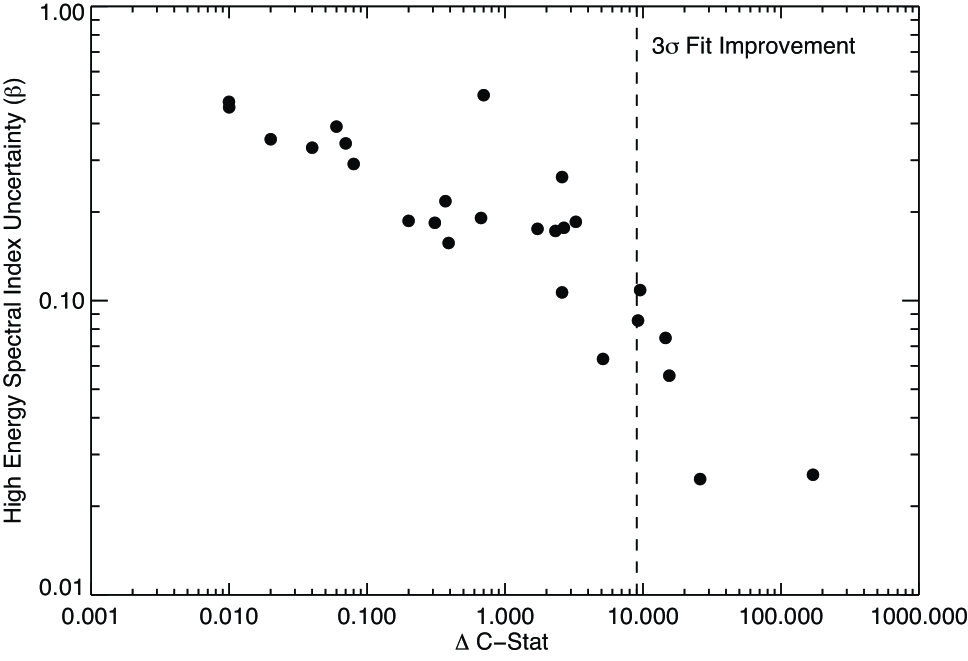
The C-Stat values obtained for the Band and Band+step function fits are listed in Column 9 of Table 4. For most of the bursts, a simple steepening of the high energy power-law index was sufficient to explain the lack of a LAT detection. However, in 6 cases C-Stat exceeded a value of 9, indicating a statistical preference for a break in the high energy spectrum. Figure 9 shows the ratio of the expected LAT flux (based on GBM-only fits) to the LAT 95% CL upper limit plotted versus the C-Stat values for the spectroscopic subsample. A weak correlation between the flux ratio and C-Stat is apparent. In addition, Figure 10 shows an anti-correlation between the resulting C-Stat values for this sample plotted versus the uncertainty in the high-energy spectral index found from fits to the GBM data alone. The bursts for which a spectral break is statistically preferred both have the most severe discrepancies between the GBM-only extrapolations and the LAT upper limits and also have the smallest uncertainties in their GBM-only values.
5.5 Constraints on the Bulk Lorentz Factor
If we assume that the high-energy spectra in the 6 GRBs that prefer spectral cut-offs are a result of attenuation, as opposed to a spectral turnover that is intrinsic to the GRB spectrum, then we can use the joint GBM and LAT spectral fits in conjunction with the LAT non-detections at 100 MeV to place limits on the maximum Lorentz factor. In this context, the high-energy -rays produced within the GRB jet may undergo pair production and can be absorbed in situ. The interaction rate of this process and corresponding optical depth, , depend on the target photon density and can be significant when both the high-energy and target photons are produced in the same physical region. Highly relativistic bulk motion of such an emission region can reduce the implied optical depth greatly by allowing for a larger emitting region radius and a smaller target photon density for a given observed flux and variability time scale. Observation of -ray emission up to an energy thus can be used to put a lower limit on the bulk Lorentz factor of the emitting region (Lithwick & Sari, 2001; Razzaque et al., 2004; Granot et al., 2008; Ackermann et al., 2010b). This method is valid for , which follows from the threshold condition for pair production, when both the incident and target photons are at the maximum observed energy.
If a high-energy -ray photon with energy and the observed broadband photon emission originate from the same physical region, and if we assume the photons are quasi-isotropic in the comoving frame, then the pair production optical depth can be written as
| (1) |
Here is the observed photon spectrum, is the target photon energy, is the target photon energy in the comoving frame of the emitting plasma, is the luminosity distance, is the -ray flux variability time scale, and is the Thomson cross-section. The function is defined by Gould & Schréder (1967) and Brown et al. (1973). The value of follows from the condition . This single-zone model, in which the spatial and temporal dependancies of have been averaged out, has been the technique used to measure the reported values of for the LAT detections of GRBs 080916C, 090510, and 09092B in Abdo et al. (2009d), Ackermann et al. (2010b), and Abdo et al. (2009b), respectively.
A direct estimate of the bulk Lorentz factor , as opposed to a minimum value, of the GRB jet can be made based on evidence of a cut-off in the spectral fits that are attributed to attenuation, such as has been reported for GRB 090926A in Abdo et al. (2010).
In the case of the 6 GRBs that we are considering here for which no direct evidence for a spectral cut-off is otherwise detected, we use our upper limits to calculate a maximum bulk Lorentz factor from the condition . To do so, we use the Band function fit to the GBM and LAT data and set MeV. We also assume a variability time scale of s, which we believe represents a conservative estimate of given the ubiquity of millisecond variability in BATSE detected GRBs (Walker et al., 2000) as well as the short timescales observed in other LAT detected GRBs (Ackermann et al., 2010b).
We note that if the cutoff energy due to intrinsic pair opacity is small enough, , then the Thomson optical depth of the pairs that are produced in the emitting region is (Lithwick & Sari, 2001; Abdo et al., 2009a). This should affect both the observed spectrum, thermalizing it for a large enough optical depth, and light curve, eliminating short timescale variability. For MeV, this condition is nearly violated at , therefore a much lower cutoff energy would be hard to reconcile with an intrinsic pair opacity origin for GRBs at low redshift.
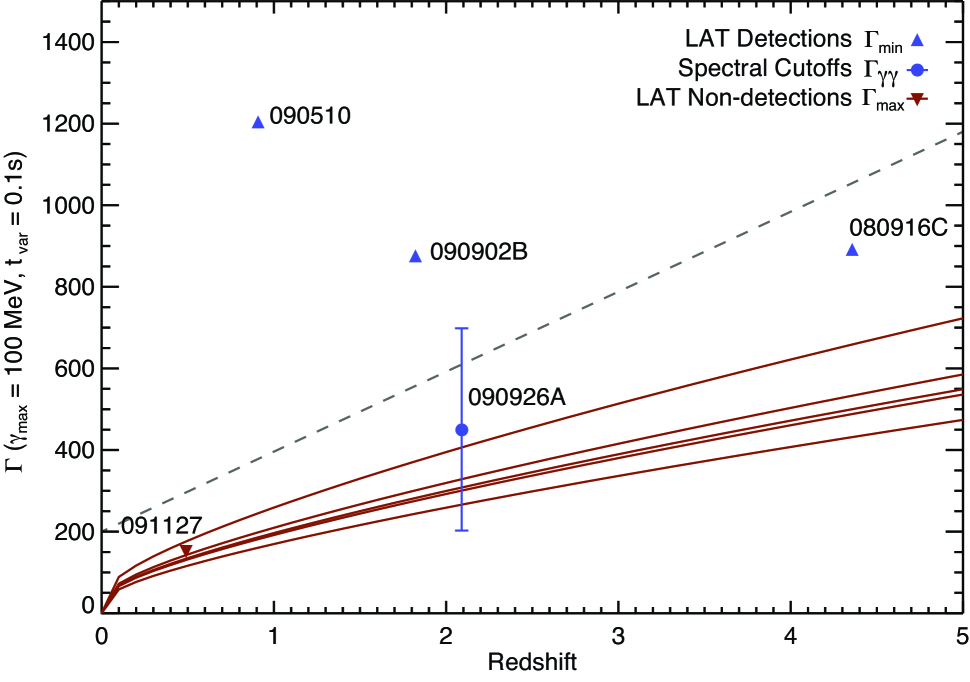
The resulting and values for previously reported LAT detections and from the upper limits presented here are shown in Figure 13. Since the Lorentz factor calculation depends on the redshift, which is unknown for the majority of GBM detected bursts, we have plotted the values as a function of the redshift (red lines). One GRB in our spectroscopic subsample, GRB 091127, has a measured redshift which allows us to constrain the burst’s value. Using a redshift of (Cucchiara et al., 2009) and MeV, we calculate a relatively small bulk Lorentz factor of . Using the measurements of for these GRBs provides a relatively narrow distribution of that range from at to at . These values stand in stark contrast to the LAT detected GRBs for which was measured, all of which have .
The detection of spectral curvature by the LAT in the spectrum of GRB 090926 provides a case that appears to bridge the LAT detected and non-detected samples. The estimate of of 200700 presented in Abdo et al. (2010) reflects the systematic differences between Lorentz factors obtained through the use of time-dependent models by Granot et al. (2008) which yield systematic differences in and the inferred when compared to the simple single-zone model used above. Granot et al. (2008), and more recently Hascoët et al. (2011), have shown that such time-dependent models, which include the temporal evolution of during the emission period, can yield inferred estimates that are reduced by a factor of 2-3 compared to estimates made using single-zone models. In the context of these time-dependent model, the and presented in Figure 13 would all be systematically overestimated by a factor of 2-3, but the dichotomy between the LAT detected and LAT non-detected GRBs would persist since all estimates would be effected by the same correction.
Note that the grey dashed line in Figure 13 demarcates the self-consistency line where the condition that is violated, implying an incorrect determination of , for the bursts with no detected emission above MeV. None of the bursts in our spectroscopic subsample violate this condition at any redshift for the choice of MeV.
6 Discussion
The upper limits presented above place stringent constraints on the high energy emission from GRBs detected by the GBM. Of the 620 bursts detected by the GBM from 2008 August 4th to 2011 January 1st, 46% were within the LAT FOV. There is evidence for high energy emission MeV in the LAT energy range for 23 GRBs, representing 8% of the entire GBM sample observed by the LAT. This is significantly less than the pre-launch estimate of 1 detection per month that produces at least 100 counts above 100 MeV (Band et al., 2009).
The results of our joint GBM and LAT spectral fits show that both softer high-energy power-law spectra and spectral breaks likely account for the lower-than-expected number of LAT-detected GRBs. For the 24 bursts in our spectroscopic subsample where a spectral break is not statistically justified, the values from the joint fits are systematically softer than the values found from fitting the GBM data alone. This may indicate that the high-energy spectral index for the Band model may in fact be softer than that deduced from measurements made by previous missions, such as BATSE, which had a much narrower energy range compared to the combined coverage of the GBM and LAT. The GBM+LAT distribution shown in Figure 7 appears to exclude the harder spectra found from fits made with just the lower energy BATSE or GBM data. In fact, we find no cases of spectra with , which would otherwise result in a divergent energy flux at high energies.
The detection of softer values also provides support for continuum models with multiple components, which have been used to describe novel spectral features detected by the GBM and LAT. Recent work on bright GRBs by Guiriec et al. (2011a) suggests that although the Band function represents many GRB spectra very well in a limited energy range, it is sometimes possible to discern, even in this limited energy range, contributions such as thermal components in addition to the presumably non-thermal synchrotron emission represented by the Band function. The addition of such components to a Band function has the effect of modifying the parameter values, in the case of GRB 100724B raising and softening (Guiriec et al., 2011b). Whilst these more complex models are not statistically favored in most GRBs due to low photon statistics, their successful fits to some GRBs indicate that the representation of GRB emission by a Band function may be inadequate and lead to overestimates of fluxes when extrapolated to GeV energies. Because the Band function was developed to represent GRB spectra rather than to parametrize a physical model, it is difficult to decouple physical components from this empirical function, which probably incompletely describes elements of multiple physical phenomena. Additionally, the superposition of Band functions does not necessarily produce a Band function, so the presence of spectral evolution means that any extrapolation to higher energies from flux-averaged spectra may not be representative of the emission throughout the entire GRB emission period.
Granot et al. (2008) have shown that even when integrating over a single spike in a light curve there is a steepening to a softer power-law rather than an exponential cutoff. This is due to the high-energy power law arising from the sum of instantaneous spectra with an exponential cutoff whose break energy evolves with time. Likewise, Hascoët et al. (2011) have shown that the effect of averaging a time variable opacity cutoff would be manifested as a steepening in the power-law index of the high-energy spectral slope rather than as a sharp cutoff in the spectrum. Likewise, Baring (2006) has shown that skin-depth effects tend to smear out exponential attenuation when the source and target photons originate in the same volume, resulting in a similar effect. Such considerations could explain the softer values found when fitting both the GBM and LAT data, even in cases where a spectral break was not statistically preferred. Detailed time resolved spectroscopy of bright GBM detected GRBs should be able to discriminate between such pair opacity effects, intrinsically steeper high-energy spectra, or the more complex continuum models discussed above (Guiriec et al., 2011b).
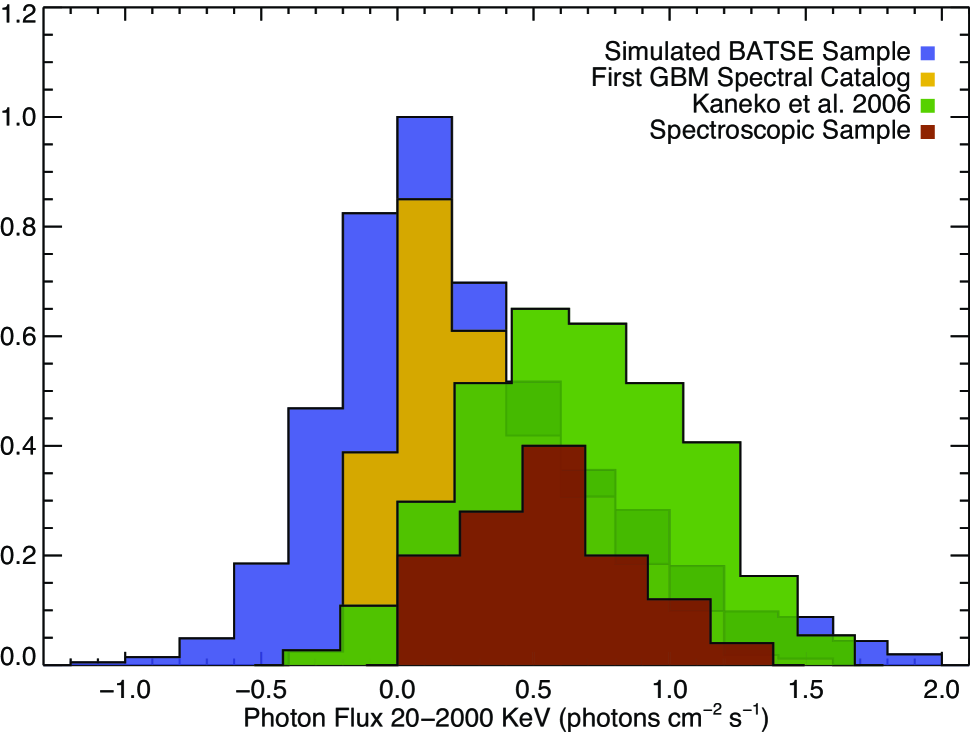
The bursts in our spectroscopic subsample were chosen specifically because they were among the brightest bursts detected by the BGO and yet had no appreciable signal in the LAT. This makes them good candidates to examine for evidence of spectral breaks, but they may also form a biased data set. In order to understand how representative these bursts are of the general GRB population, we plot in Figure 11 the distribution of the time averaged photon flux as determined from fits to GBM data for bursts in our spectroscopic subsample (red), the bursts which appear in the first GBM spectral catalog (gold) the bursts in the bright BATSE catalog presented in Kaneko et al. (2006) (green), and a sample of simulated BATSE bursts (blue) using the spectral parameter distributions given in Preece et al. (2000b). The resulting distributions show that the spectroscopic subsample is consistent with being drawn from the distribution of the brightest bursts detected by BATSE.
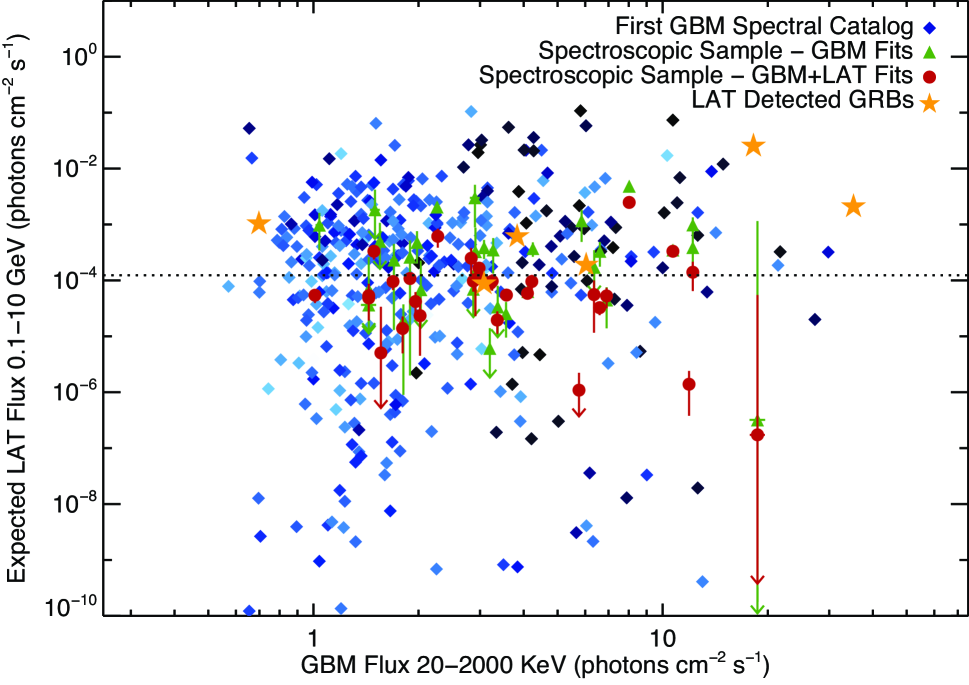
We extend this analysis in Figure 12, where we plot the expected 0.110 GeV LAT photon flux versus the 202000 keV photon flux for our spectroscopic sample using spectral parameters from the GBM-only fits (green) and from the joint GBM-LAT fits (red), along with the bursts from the first GBM spectral catalog which were in the LAT FOV (blue). The color gradient in the GBM sample represents the burst’s duration, with darker (blue) symbols representing shorter duration bursts. In addition, we have plotted the 6 LAT-detected bursts (gold) that had spectra that could be fit with a single Band function (i.e., we excluded bursts with extra high-energy components). The dashed line represents the median T100 upper limit. The green data points demonstrate how fits to the GBM data without the inclusion of the LAT data yield spectral parameters that over-predict the flux in the LAT energy range, which can be seen by the number of bursts in our spectroscopic subsample that fall above the median upper limit values. The red data points represent the predicted LAT flux for the same GRBs using spectral parameters determined through fits to both the GBM and LAT data. Roughly 50% of the bursts from the GBM spectral catalog fall above the median T100 upper limit. This would imply that a large fraction of bright GBM detected bursts would have been detectable by the LAT assuming a direct extrapolation of their high-energy spectra. Therefore, we conclude that intrinsic spectral breaks and/or softer-than-measured high-energy spectra must be fairly common in the GRB population in order to explain the lack of LAT-detected GRBs.
Despite the unknown distances to all but one of the GRBs in our spectroscopic subsample, the allowed range of values for all lie well below. This range of for the relativistic outflow contrasts with the minimum Lorentz factors that have been calculated for the bright, LAT-detected GRBs using their highest detected photons. For GRB 080916C, GRB 090510, and GRB 09092B, the estimated lower limits for the Lorentz factors were found to be 887, 1200, and 867 when using single zone models, respectively. Therefore, measurements of and from both LAT detections and non-detections reveal a wide distribution in the bulk Lorentz factor of GRB outflows, with a potential range of over .
As discussed above, these estimates of and have been calculated using simple single-zone models, which may provide overestimated values compared to time-dependent multi-zone models that take into account the time variability of . In such a scenario, our estimates of the and would need to be rescaled downwards by a factor of 23, but the large difference between the LAT detected and non-detected GRBs would remain.
| GRB | MET††Mission elapsed time relative to January 1, 2001, 0h:0m:0s UTC | RA | Dec | Error | Angle‡‡Off-axis angle with respect to the LAT boresight | T100 | Flim,T100 | Flim,30s | Flim,100s |
|---|---|---|---|---|---|---|---|---|---|
| Index | s | ∘ | ∘ | ∘ | ∘ | s | ( photons cm-2 s-1) | ||
| 080804972 | 239584816 | 328.70 | -53.20 | 0.0 | 56.4 | 22.0 | 7.1 | 5.3 | 1.7 |
| 080805496 | 239630032 | 322.70 | 47.90 | 5.6 | 13.0 | 28.0 | - | 2.3 | 0.8 |
| 080806896 | 239750976 | 241.80 | 46.70 | 2.9 | 59.6 | 44.0 | 8.4 | 12.4 | 4.0 |
| 080808565 | 239895232 | 33.60 | 5.40 | 2.6 | 57.9 | 18.0 | 10.5 | 8.1 | 2.3 |
| 080808772 | 239913104 | 96.70 | -14.40 | 12.3 | 17.0 | 1.0 | 65.5 | 2.3 | 1.4 |
| 080810549 | 240066608 | 356.80 | 0.32 | 0.0 | 60.8 | 53.0 | 4.0 | 6.9 | 2.3 |
| 080816503 | 240581056 | 156.20 | 42.60 | 2.0 | 59.1 | 68.0 | 2.7 | 6.0 | 2.9 |
| 080824909 | 241307328 | 122.40 | -2.80 | 1.0 | 18.1 | 10.0 | 7.6 | 4.6 | 1.9 |
| 080825593 | 241366432 | 232.20 | -4.90 | 1.0 | 60.0 | 35.0 | 31.5 | 34.0 | 12.6 |
| 080830368 | 241779024 | 160.10 | 30.80 | 2.5 | 23.5 | 47.0 | 1.9 | 2.4 | 1.2 |
| 080904886 | 242255760 | 214.20 | -30.30 | 2.1 | 21.8 | 18.0 | 4.2 | 3.3 | 0.9 |
| 080905499 | 242308736 | 287.70 | -18.90 | 0.0 | 27.9 | 1.0 | 71.1 | 6.3 | 2.2 |
| 080906212 | 242370320 | 182.80 | -6.40 | 1.3 | 34.9 | 3.0 | 60.7 | 3.9 | 1.6 |
| 080912360 | 242901536 | 25.80 | -7.20 | 7.1 | 57.8 | 8.0 | 24.0 | 5.8 | 2.1 |
| 080916009 | 243216768 | 119.80 | -56.60 | 0.0 | 48.8 | 86.0 | 76.7 | 171.8 | 68.6 |
| 080920268 | 243584752 | 121.60 | 8.90 | 5.4 | 21.0 | 1.0 | 79.9 | 4.9 | 1.2 |
| 080924766 | 243973360 | 72.80 | 32.50 | 4.4 | 60.1 | 17.0 | 12.0 | 6.2 | 2.1 |
| 080925775 | 244060560 | 96.10 | 18.20 | 1.2 | 38.0 | 33.0 | 6.0 | 6.6 | 2.7 |
| 080928628 | 244307104 | 95.10 | -55.20 | 0.0 | 39.4 | 12.0 | 7.4 | 3.0 | 1.0 |
| 081003644 | 244740432 | 259.10 | 35.40 | 6.9 | 62.7 | 147.0 | 10.6 | 11.3 | 6.9 |
| 081006604 | 244996176 | 142.00 | -67.40 | 8.0 | 16.0 | 144.0 | 1.2 | 3.4 | 0.9 |
| 081006872 | 245019344 | 172.20 | -61.00 | 8.7 | 16.0 | 1.0 | 71.1 | 3.8 | 1.5 |
| 081008832 | 245188688 | 280.00 | -57.40 | 0.0 | 64.2 | 126.0 | 6.2 | 9.6 | 5.9 |
| 081012549 | 245509824 | 30.20 | -17.60 | 0.0 | 61.5 | 7.0 | 31.9 | 6.6 | 1.7 |
| 081024891 | 246576160 | 322.90 | 21.20 | 0.0 | 18.6 | 134.0 | 1.0 | 8.8 | 2.6 |
| 081101491 | 247232800 | 95.10 | -0.10 | 0.0 | 29.9 | 1.0 | 71.9 | 3.5 | 1.1 |
| 081102365 | 247308304 | 225.30 | 22.00 | 8.6 | 61.0 | 147.0 | 2.2 | 6.7 | 2.0 |
| 081102739 | 247340656 | 331.20 | 53.00 | 0.0 | 50.9 | 41.0 | 3.3 | 4.6 | 2.3 |
| 081107321 | 247736528 | 51.00 | 17.10 | 3.5 | 52.0 | 3.0 | 60.1 | 4.9 | 2.0 |
| 081115891 | 248476944 | 190.60 | 63.30 | 15.1 | 53.0 | 1.0 | 131.4 | 4.7 | 2.5 |
| 081118876 | 248734848 | 54.60 | -43.30 | 3.6 | 34.1 | 23.0 | 3.4 | 2.6 | 1.1 |
| 081122520 | 249049696 | 339.10 | 40.00 | 1.0 | 19.2 | 25.0 | 6.1 | 4.7 | 1.0 |
| 081122614 | 249057808 | 151.40 | -2.10 | 11.2 | 52.0 | 1.0 | 120.7 | 4.2 | 1.2 |
| 081126899 | 249428048 | 323.50 | 48.70 | 0.0 | 17.5 | 8.0 | 10.2 | 4.0 | 2.8 |
| 081204004 | 250041920 | 63.30 | -62.60 | 4.8 | 57.0 | 3.0 | 77.2 | 5.5 | 2.7 |
| 081207680 | 250359520 | 112.40 | 70.50 | 1.2 | 60.2 | 101.0 | 8.2 | 11.0 | 5.1 |
| 081213173 | 250834176 | 12.90 | -33.90 | 13.2 | 55.0 | 1.0 | 145.8 | 6.2 | 2.1 |
| 081217983 | 251249696 | 116.80 | 26.80 | 2.0 | 53.5 | 24.0 | 7.6 | 6.2 | 1.9 |
| 081222204 | 251614448 | 22.70 | -34.10 | 0.0 | 50.0 | 45.0 | 5.9 | 9.2 | 2.7 |
| 081223419 | 251719440 | 112.50 | 33.20 | 3.8 | 30.0 | 3.0 | 37.6 | 4.5 | 1.1 |
| 081224887 | 251846272 | 201.70 | 75.10 | 1.0 | 17.9 | 35.0 | 4.7 | 5.1 | 2.3 |
| 081225257 | 251878160 | 234.10 | -64.60 | 6.9 | 46.4 | 15.0 | 21.3 | 10.6 | 5.3 |
| 081226156 | 251955888 | 193.00 | 26.80 | 2.4 | 51.8 | 11.0 | 13.3 | 4.7 | 1.6 |
| 081226509 | 251986384 | 25.50 | -47.40 | 0.0 | 22.5 | 1.0 | 75.3 | 2.8 | 1.2 |
| 081229187 | 252217744 | 172.60 | 56.90 | 8.8 | 44.0 | 1.0 | 86.6 | 2.9 | 0.9 |
| 081230871 | 252363216 | 207.60 | -17.30 | 7.7 | 23.0 | 1.0 | 69.6 | 2.4 | 0.9 |
| 081231140 | 252386464 | 208.60 | -35.80 | 1.0 | 23.3 | 36.0 | 2.1 | 2.5 | 0.8 |
| 090112332 | 253439840 | 110.90 | -30.40 | 1.0 | 4.1 | 52.0 | 1.6 | 3.1 | 1.1 |
| 090113778 | 253564848 | 32.10 | 33.40 | 0.0 | 31.2 | 9.0 | 9.2 | 4.2 | 1.1 |
| 090117335 | 253872128 | 227.30 | -41.50 | 4.8 | 63.6 | 3.0 | 117.9 | 9.7 | 3.5 |
| 090117632 | 253897840 | 121.60 | -38.80 | 1.9 | 57.7 | 27.0 | 6.0 | 5.3 | 1.7 |
| 090117640 | 253898528 | 164.00 | -58.20 | 0.0 | 50.9 | 148.0 | 3.7 | 6.8 | 3.4 |
| 090126227 | 254640384 | 189.20 | 34.10 | 3.6 | 19.0 | 7.0 | 11.0 | 2.5 | 1.3 |
| 090129880 | 254956032 | 269.00 | -32.80 | 0.0 | 24.4 | 16.0 | 7.1 | 3.5 | 1.0 |
| 090131090 | 255060560 | 352.30 | 21.20 | 1.0 | 42.2 | 55.0 | 2.4 | 3.0 | 1.2 |
| 090202347 | 255255568 | 274.30 | -2.00 | 2.6 | 57.0 | 15.0 | 12.1 | 6.0 | 2.0 |
| 090207777 | 255724752 | 252.70 | 34.90 | 3.8 | 46.9 | 14.0 | 9.6 | 5.0 | 1.5 |
| 090213236 | 256196368 | 330.60 | -55.00 | 3.1 | 19.2 | 1.0 | 67.8 | 4.7 | 1.5 |
| 090217206 | 256539408 | 204.90 | -8.40 | 0.0 | 34.5 | 37.0 | 15.4 | 19.1 | 6.9 |
| 090227310 | 257412352 | 3.30 | -43.00 | 1.2 | 21.3 | 15.0 | 6.2 | 4.0 | 2.5 |
| 090228204 | 257489600 | 106.80 | -24.30 | 1.0 | 16.0 | 1.0 | 68.2 | 2.5 | 0.7 |
| 090228976 | 257556304 | 357.60 | 36.70 | 3.3 | 21.2 | 5.0 | 16.8 | 2.5 | 1.1 |
| 090301315 | 257585616 | 352.80 | 9.50 | 5.0 | 54.0 | 4.0 | 43.2 | 4.9 | 1.5 |
| 090303542 | 257778032 | 223.70 | -68.20 | 12.1 | 26.0 | 1.0 | 63.2 | 2.5 | 1.4 |
| 090304216 | 257836256 | 195.90 | -73.40 | 12.3 | 42.0 | 1.0 | 94.7 | 3.3 | 1.9 |
| 090305052 | 257908480 | 135.00 | 74.30 | 5.4 | 37.0 | 2.0 | 81.5 | 3.0 | 1.9 |
| 090306245 | 258011520 | 137.00 | 57.00 | 4.1 | 17.0 | 20.0 | 3.5 | 2.5 | 1.0 |
| 090308734 | 258226592 | 21.90 | -54.30 | 4.8 | 50.0 | 1.0 | 111.2 | 8.0 | 2.2 |
| 090309767 | 258315904 | 174.30 | -49.50 | 3.6 | 36.1 | 16.0 | 7.4 | 3.6 | 1.0 |
| 090319622 | 259167344 | 283.30 | -8.90 | 2.6 | 17.9 | 37.0 | 2.4 | 3.0 | 0.9 |
| 090320045 | 259203920 | 108.30 | -43.30 | 17.9 | 40.0 | 1.0 | 84.8 | 3.8 | 1.3 |
| 090320418 | 259236112 | 238.00 | -46.50 | 12.0 | 61.0 | 1.0 | 194.8 | 17.3 | 5.9 |
| 090323002 | 259459360 | 190.70 | 17.10 | 0.0 | 57.2 | 144.0 | 6.9 | 14.8 | 9.1 |
| 090328401 | 259925808 | 90.90 | -42.00 | 0.0 | 64.5 | 85.0 | 13.1 | 17.0 | 11.0 |
| 090330279 | 260088144 | 160.20 | -8.20 | 2.1 | 51.4 | 27.0 | 6.3 | 5.7 | 2.1 |
| 090331681 | 260209216 | 210.50 | 3.10 | 9.3 | 41.0 | 1.0 | 83.9 | 3.1 | 1.4 |
| 090403314 | 260436768 | 67.10 | 47.20 | 9.7 | 42.1 | 14.0 | 7.6 | 5.0 | 1.8 |
| 090411838 | 261173200 | 156.00 | -68.90 | 2.1 | 60.3 | 17.0 | 17.9 | 12.5 | 5.2 |
| 090413122 | 261284160 | 266.50 | -9.20 | 5.5 | 50.8 | 12.0 | 23.7 | 7.4 | 2.1 |
| 090418816 | 261776128 | 262.80 | -28.20 | 14.4 | 57.9 | 1.0 | 165.2 | 11.4 | 2.7 |
| 090419997 | 261878112 | 88.60 | 31.30 | 3.6 | 55.8 | 87.0 | 2.4 | 5.6 | 2.1 |
| 090422150 | 262064112 | 294.70 | 40.40 | 0.0 | 29.2 | 1.0 | 76.3 | 3.8 | 1.1 |
| 090426066 | 262402544 | 17.60 | -19.20 | 18.1 | 56.0 | 1.0 | 149.8 | 5.2 | 1.8 |
| 090427644 | 262538816 | 210.00 | -45.70 | 11.8 | 14.0 | 1.0 | 96.8 | 4.7 | 1.0 |
| 090429753 | 262721040 | 124.40 | 7.90 | 5.0 | 32.0 | 2.0 | 73.2 | 2.5 | 1.5 |
| 090510016 | 263607776 | 333.60 | -26.60 | 0.0 | 13.6 | 1.0 | 1626.0 | 143.3 | 43.7 |
| 090514006 | 263952528 | 12.30 | -10.90 | 4.6 | 17.0 | 44.0 | 2.3 | 2.3 | 1.2 |
| 090516137 | 264136640 | 122.20 | -71.62 | 2.6 | 47.8 | 147.0 | 1.7 | 5.7 | 1.8 |
| 090516353 | 264155280 | 138.26 | -11.85 | 0.0 | 19.3 | 85.0 | 1.3 | 2.7 | 1.1 |
| 090518080 | 264304480 | 119.95 | 0.75 | 0.0 | 36.8 | 1.0 | 78.3 | 3.2 | 1.4 |
| 090519462 | 264423936 | 119.00 | -46.30 | 7.2 | 31.0 | 2.0 | 77.7 | 3.0 | 2.5 |
| 090519881 | 264460128 | 142.30 | 0.20 | 0.0 | 47.5 | 18.0 | 6.2 | 3.7 | 1.5 |
| 090520832 | 264542272 | 332.00 | 43.20 | 12.0 | 10.0 | 1.0 | 61.1 | 2.8 | 0.9 |
| 090522344 | 264672944 | 277.70 | 19.60 | 4.9 | 55.1 | 3.0 | 70.8 | 4.5 | - |
| 090524346 | 264845872 | 327.30 | -66.90 | 1.5 | 62.3 | 55.0 | 4.2 | 8.5 | 2.4 |
| 090529310 | 265274784 | 231.20 | 32.20 | 7.2 | 39.0 | 147.0 | 1.0 | 3.2 | 1.0 |
| 090531775 | 265487760 | 252.06 | -36.05 | 0.0 | 21.9 | 2.0 | 101.3 | 5.7 | 1.8 |
| 090612619 | 266511056 | 81.03 | 17.71 | 2.2 | 54.1 | 6.0 | 33.6 | 6.1 | 2.6 |
| 090617208 | 266907600 | 78.89 | 15.65 | 4.2 | 45.0 | 2.0 | 113.5 | 3.5 | 1.0 |
| 090620400 | 267183392 | 237.35 | 61.15 | 1.0 | 56.0 | 21.0 | 14.4 | 9.9 | 3.6 |
| 090621185 | 267251200 | 11.02 | 61.94 | 0.0 | 10.9 | 48.0 | 1.8 | 3.3 | 1.0 |
| 090621417 | 267271248 | 257.49 | -28.46 | 3.2 | 52.6 | 36.0 | 4.1 | 5.1 | 1.4 |
| 090623913 | 267486864 | 41.70 | 1.80 | 1.5 | 36.8 | 7.0 | 11.7 | 2.6 | 1.3 |
| 090625234 | 267601024 | 20.29 | -6.43 | 3.1 | 13.8 | 13.0 | 5.3 | 2.6 | 0.7 |
| 090626189 | 267683536 | 169.30 | -36.05 | 1.0 | 18.3 | 79.0 | 3.7 | 3.3 | 4.2 |
| 090629543 | 267973280 | 8.48 | 17.67 | 7.4 | 40.0 | 1.0 | 96.8 | 3.6 | 1.7 |
| 090701225 | 268118640 | 114.69 | -42.07 | 4.2 | 12.0 | 1.0 | 65.5 | 2.5 | 1.7 |
| 090703329 | 268300448 | 3.30 | 6.90 | 6.6 | 22.0 | 5.0 | 26.1 | 4.1 | 1.4 |
| 090704783 | 268426016 | 312.97 | 20.43 | 16.5 | 34.5 | 16.0 | 5.3 | 2.8 | 1.2 |
| 090706283 | 268555648 | 205.07 | -47.07 | 3.0 | 20.8 | 86.0 | 1.5 | 3.4 | 1.3 |
| 090708152 | 268717088 | 154.63 | 26.64 | 0.1 | 54.7 | 9.0 | 18.3 | 5.2 | 3.2 |
| 090709630 | 268844864 | 93.59 | 64.08 | 0.1 | 46.9 | 30.0 | 7.0 | 7.0 | 2.4 |
| 090711850 | 269036608 | 139.61 | -64.74 | 1.0 | 12.7 | 46.0 | 1.6 | 2.3 | 1.5 |
| 090712160 | 269063456 | 70.10 | 22.52 | 0.0 | 33.4 | 150.0 | 1.6 | 5.3 | 1.6 |
| 090713020 | 269137760 | 284.80 | -3.33 | 2.4 | 59.0 | 51.0 | 4.7 | 8.0 | 4.2 |
| 090717111 | 269491232 | 246.95 | 22.97 | 3.9 | 35.1 | 1.0 | 84.6 | 5.2 | 1.4 |
| 090718720 | 269630208 | 243.76 | -6.68 | 5.9 | 35.7 | 147.0 | 2.4 | 6.6 | 2.2 |
| 090720710 | 269802176 | 203.00 | -54.80 | 2.9 | 56.0 | 8.0 | 40.5 | 9.7 | 4.6 |
| 090722447 | 269952224 | 344.13 | -62.00 | 31.9 | 1.3 | 154.0 | 1.5 | 4.6 | 1.7 |
| 090726218 | 270278048 | 238.70 | 32.50 | 6.9 | 52.8 | 8.0 | - | - | - |
| 090807832 | 271367872 | 326.90 | 7.23 | 2.6 | 45.0 | 158.0 | 1.6 | 4.8 | 2.0 |
| 090811696 | 271701728 | 277.05 | 22.22 | 7.5 | 36.7 | 2.0 | 118.8 | 6.4 | 2.1 |
| 090813174 | 271829440 | 225.80 | 88.60 | 0.0 | 35.3 | 8.0 | 11.1 | 3.9 | 1.4 |
| 090814368 | 271932576 | 335.90 | 60.30 | 5.9 | 59.0 | 1.0 | 166.6 | 6.2 | 2.3 |
| 090815946 | 272068896 | 251.30 | 52.90 | 2.4 | 47.5 | 1.0 | 102.0 | 3.5 | 1.6 |
| 090819607 | 272385280 | 49.10 | -67.10 | 3.3 | 47.0 | 1.0 | 103.9 | 5.9 | 2.4 |
| 090820509 | 272463200 | 321.00 | -4.30 | 10.5 | 44.2 | 12.0 | 8.5 | 3.1 | 1.2 |
| 090826068 | 272943456 | 140.62 | -0.11 | 9.7 | 27.1 | 8.0 | 11.6 | 2.8 | 1.1 |
| 090829672 | 273254848 | 329.20 | -34.20 | 1.0 | 48.4 | 92.0 | 1.8 | 5.9 | 1.6 |
| 090829702 | 273257440 | 355.00 | -9.40 | 3.2 | 42.0 | 24.0 | 5.3 | 5.5 | 2.1 |
| 090902462 | 273582304 | 264.94 | 27.32 | 0.0 | 50.8 | 30.0 | 265.2 | 265.3 | 84.6 |
| 090907808 | 274044224 | 81.10 | 20.50 | 3.7 | 32.0 | 1.0 | - | 3.1 | 0.9 |
| 090909854 | 274220992 | 54.18 | -25.03 | 8.3 | 53.0 | 1.0 | 128.5 | 5.4 | 2.8 |
| 090917661 | 274895488 | 222.60 | -19.80 | 7.4 | 37.9 | 3.0 | 40.7 | 3.8 | 1.6 |
| 090922539 | 275316992 | 13.10 | 74.00 | 1.0 | 20.0 | 146.0 | 1.2 | 3.4 | 1.3 |
| 090924625 | 275497184 | 50.80 | -68.80 | 6.7 | 55.0 | 1.0 | 146.6 | 4.8 | 1.6 |
| 090926181 | 275631616 | 353.40 | -66.32 | 0.0 | 48.1 | 30.0 | 274.7 | 274.8 | 99.9 |
| 091002685 | 276193568 | 41.00 | -13.10 | 3.8 | 15.9 | 3.0 | 32.2 | 2.3 | 1.2 |
| 091003191 | 276237344 | 251.52 | 36.62 | 0.0 | 12.2 | 38.0 | 11.7 | 11.1 | 6.9 |
| 091010113 | 276835392 | 298.67 | -22.54 | 0.1 | 55.7 | 15.0 | 18.7 | 9.1 | 3.2 |
| 091017985 | 277515552 | 204.80 | -62.60 | 3.6 | 13.6 | 1.0 | 64.1 | 2.8 | 1.3 |
| 091019750 | 277668032 | 226.03 | 80.33 | 12.8 | 56.0 | 1.0 | 145.0 | 8.3 | 2.2 |
| 091020977 | 277773984 | 187.80 | -13.40 | 2.2 | 44.9 | 38.0 | 7.4 | 9.5 | 4.2 |
| 091024380 | 278068000 | 339.25 | 56.89 | 0.0 | 15.5 | 36.0 | 2.0 | 2.5 | 1.0 |
| 091030613 | 278606592 | 249.00 | 23.54 | 5.6 | 47.9 | 148.0 | 1.8 | 4.5 | 2.6 |
| 091031500 | 278683232 | 71.70 | -57.50 | 0.0 | 24.0 | 43.0 | 3.7 | 5.5 | 4.3 |
| 091103912 | 278978048 | 170.70 | 11.34 | 1.8 | 59.0 | 20.0 | 9.1 | 7.8 | 2.9 |
| 091107635 | 279299648 | 188.69 | 32.65 | 9.0 | 47.0 | 2.0 | 109.1 | 5.7 | 2.2 |
| 091109895 | 279494912 | 247.72 | 42.31 | 4.1 | 21.0 | 26.0 | 4.1 | 3.5 | 1.2 |
| 091115177 | 279951296 | 279.37 | 68.04 | 6.0 | 51.1 | 9.0 | 18.9 | - | 1.6 |
| 091120191 | 280384480 | 226.81 | -21.79 | 0.5 | 46.0 | 53.0 | 4.2 | 6.9 | 2.4 |
| 091122163 | 280554848 | 91.28 | 6.02 | 17.7 | 56.0 | 1.0 | 146.0 | 6.8 | 3.4 |
| 091126389 | 280920000 | 48.72 | 28.26 | 12.6 | 57.0 | 1.0 | 167.7 | 11.1 | 2.6 |
| 091127976 | 281057152 | 36.60 | -19.00 | 0.0 | 25.3 | 14.0 | 7.4 | 3.3 | 1.1 |
| 091202072 | 281411040 | 255.32 | 1.44 | 9.9 | 34.0 | 14.0 | 6.0 | 2.7 | 1.4 |
| 091207333 | 281865600 | 12.04 | -48.42 | 1.7 | 36.3 | 146.0 | 1.1 | 3.1 | 1.2 |
| 091208410 | 281958592 | 29.40 | 16.90 | 0.0 | 55.6 | 16.0 | 25.3 | 17.8 | 4.7 |
| 091219462 | 282913472 | 294.49 | 71.91 | 5.4 | 36.0 | 1.0 | 78.6 | 3.4 | 0.8 |
| 091220442 | 282998208 | 167.76 | 3.92 | 1.5 | 60.1 | 23.0 | 12.3 | 9.0 | 2.1 |
| 091221870 | 283121568 | 55.80 | 23.20 | 0.0 | 53.4 | 34.0 | 5.8 | 6.6 | 1.5 |
| 091223191 | 283235712 | 203.23 | 76.35 | 8.9 | 33.0 | 1.0 | 77.6 | 2.7 | 1.0 |
| 091230260 | 283846464 | 101.53 | 0.68 | 18.0 | 59.0 | 1.0 | 149.9 | 5.2 | 1.7 |
| 091231206 | 283928192 | 197.09 | -55.95 | 1.5 | 32.2 | 146.0 | 2.3 | 6.4 | 2.4 |
| 100101028 | 283999200 | 307.32 | -27.00 | 17.4 | 31.0 | 1.0 | 85.8 | 4.4 | 1.7 |
| 100101988 | 284082144 | 70.66 | 18.69 | 9.3 | 47.0 | 1.0 | 102.0 | 4.0 | 1.2 |
| 100107074 | 284521600 | 6.31 | -21.24 | 6.0 | 53.0 | 111.0 | 1.6 | 5.9 | 1.4 |
| 100111176 | 284875968 | 247.00 | 15.60 | 0.0 | 32.2 | 8.0 | 11.5 | 3.3 | 0.9 |
| 100112418 | 284983264 | 242.16 | -77.54 | 14.0 | 57.0 | 25.0 | 8.2 | 6.5 | 3.4 |
| 100116897 | 285370272 | 305.00 | 14.50 | 0.0 | 26.5 | 108.0 | 1.2 | 4.1 | 1.5 |
| 100122616 | 285864448 | 79.20 | -2.71 | 1.3 | 49.2 | 29.0 | 3.9 | 3.8 | 1.1 |
| 100130729 | 286565376 | 21.19 | -24.75 | 2.5 | 48.0 | 92.0 | 1.3 | 4.0 | 1.2 |
| 100131730 | 286651872 | 120.39 | 16.49 | 1.2 | 27.0 | 11.0 | 10.3 | 5.8 | 2.3 |
| 100201588 | 286725984 | 133.10 | -37.29 | 4.3 | 45.1 | 147.0 | 1.2 | 4.4 | 1.6 |
| 100204024 | 286936448 | 50.78 | -47.89 | 3.0 | 55.1 | 30.0 | 6.6 | 6.6 | 1.7 |
| 100206563 | 287155808 | 47.16 | 13.16 | 0.0 | 44.7 | 2.0 | 100.5 | 3.5 | 1.5 |
| 100207721 | 287255904 | 321.78 | -15.78 | 1.0 | 15.0 | 1.0 | 167.9 | 6.6 | 1.8 |
| 100208386 | 287313344 | 260.25 | 27.53 | 29.3 | 55.0 | 1.0 | 147.8 | 8.1 | 2.3 |
| 100210101 | 287461504 | 244.38 | 16.08 | 6.1 | 64.0 | 6.0 | 57.0 | 13.7 | 3.4 |
| 100212550 | 287673120 | 134.27 | 32.22 | 1.4 | 8.0 | 4.0 | 20.5 | 2.7 | 1.3 |
| 100212588 | 287676448 | 1.82 | 45.96 | 5.0 | 21.6 | 3.0 | 33.3 | 2.3 | 0.8 |
| 100218194 | 288160736 | 206.64 | -11.94 | 2.2 | 37.5 | 147.0 | 1.0 | 4.9 | 1.3 |
| 100221368 | 288435040 | 27.12 | -17.41 | 8.0 | 60.0 | 12.0 | - | - | - |
| 100225115 | 288758720 | 310.30 | -59.40 | 0.9 | 58.2 | 12.0 | 27.7 | 13.9 | 4.5 |
| 100225580 | 288798944 | 314.27 | 0.21 | 1.1 | 55.1 | 8.0 | 33.1 | 11.4 | 3.6 |
| 100225703 | 288809536 | 147.91 | 34.01 | 3.9 | 49.9 | 12.0 | 15.2 | 5.9 | 3.3 |
| 100227067 | 288927392 | 0.00 | 0.00 | 0.0 | 35.6 | 0.0 | 0.8 | 2.7 | 0.8 |
| 100228873 | 289083456 | 117.99 | 18.63 | 11.1 | 55.0 | 4.0 | 49.1 | 6.9 | 3.4 |
| 100301068 | 289100256 | 110.14 | -15.68 | 7.3 | 42.9 | 1.0 | 125.8 | 3.4 | 1.4 |
| 100301223 | 289113696 | 201.85 | 19.83 | 4.9 | 56.0 | 9.0 | 18.4 | 7.9 | 2.3 |
| 100313288 | 290156064 | 172.71 | -52.58 | 2.9 | 59.1 | 7.0 | 27.8 | 5.8 | 2.7 |
| 100313509 | 290175136 | 186.37 | 11.72 | 9.6 | 43.8 | 28.0 | 3.6 | 3.3 | 1.3 |
| 100315361 | 290335168 | 208.90 | 30.14 | 5.5 | 7.0 | 1.0 | 62.2 | 2.2 | 0.8 |
| 100325246 | 291189280 | 209.14 | -79.10 | 7.2 | 12.1 | 7.0 | 21.4 | 4.1 | 1.4 |
| 100325275 | 291191776 | 330.24 | -26.47 | 0.9 | 9.1 | 8.0 | 18.8 | 6.2 | 2.1 |
| 100327405 | 291375808 | 334.93 | -5.83 | 14.2 | 20.0 | 20.0 | 3.5 | 2.3 | 0.7 |
| 100328141 | 291439360 | 155.94 | 47.03 | 4.8 | 58.0 | 1.0 | 166.2 | 15.2 | 4.4 |
| 100330856 | 291673984 | 326.38 | -6.97 | 7.7 | 21.0 | 24.0 | 3.0 | 2.4 | 0.8 |
| 100401297 | 291798464 | 281.85 | -27.83 | 9.0 | 27.0 | 82.0 | 1.5 | 4.0 | 1.4 |
| 100414097 | 292904416 | 192.11 | 8.69 | 0.0 | 60.7 | 147.0 | 18.6 | 65.3 | 20.2 |
| 100417166 | 293169600 | 261.31 | 50.38 | 9.2 | 15.0 | 1.0 | 65.4 | 2.3 | 0.9 |
| 100420008 | 293415136 | 120.55 | -5.82 | 2.8 | 58.7 | 25.0 | 10.3 | 8.6 | 2.9 |
| 100423244 | 293694688 | 119.67 | 5.78 | 1.5 | 40.3 | 13.0 | 7.6 | 6.0 | 2.0 |
| 100424876 | 293835712 | 7.79 | 43.35 | 2.4 | 53.5 | 27.0 | 7.0 | 6.3 | 1.7 |
| 100427356 | 294049920 | 89.17 | -3.46 | 0.4 | 28.6 | 11.0 | 7.0 | 4.8 | 1.9 |
| 100429999 | 294278400 | 89.09 | -69.96 | 4.0 | 41.0 | 9.0 | 10.6 | 2.9 | - |
| 100503554 | 294585472 | 147.48 | 3.96 | 1.5 | 61.6 | 135.0 | 2.4 | 8.0 | 3.2 |
| 100507577 | 294933088 | 2.90 | -79.01 | 2.5 | 64.0 | 25.0 | 21.2 | 23.3 | 11.3 |
| 100511035 | 295231808 | 109.29 | -4.65 | 1.0 | 43.6 | 41.0 | 2.6 | 3.6 | 1.1 |
| 100516014 | 295662016 | 117.32 | 55.14 | 5.3 | 19.0 | 1.0 | 66.7 | 2.5 | 1.1 |
| 100517132 | 295758592 | 40.63 | -44.32 | 5.2 | 25.0 | 12.0 | 6.2 | 2.3 | 0.9 |
| 100519204 | 295937600 | 191.49 | 57.41 | 1.0 | 60.3 | 85.0 | 4.5 | 12.3 | 3.7 |
| 100527795 | 296679872 | 226.83 | 19.78 | 1.9 | 53.9 | 50.0 | 2.8 | 4.6 | 3.0 |
| 100528075 | 296704096 | 311.12 | 27.81 | 0.1 | 49.7 | 149.0 | 0.9 | 3.9 | 1.3 |
| 100604287 | 297327232 | 248.30 | -73.19 | 3.6 | 52.0 | 13.0 | 13.4 | 5.6 | 1.9 |
| 100605774 | 297455712 | 273.43 | -67.60 | 7.7 | 18.0 | 1.0 | 66.9 | 2.4 | 0.9 |
| 100608382 | 297681024 | 30.54 | 20.45 | 5.3 | 39.0 | 5.0 | 20.3 | 3.7 | 1.5 |
| 100614498 | 298209440 | 224.76 | 40.87 | 3.0 | 53.1 | 1.0 | 131.8 | 4.6 | 1.8 |
| 100620119 | 298695104 | 80.10 | -51.68 | 1.5 | 20.1 | 21.0 | 7.0 | 4.8 | 1.5 |
| 100621529 | 298816928 | 160.86 | 14.72 | 11.4 | 64.0 | 1.0 | 286.7 | 10.7 | 3.0 |
| 100625891 | 299193760 | 338.26 | 20.29 | 4.4 | 30.8 | 9.0 | 8.8 | 2.5 | 1.0 |
| 100704149 | 299907296 | 133.64 | -24.22 | 0.0 | 63.2 | 19.0 | 12.9 | 10.0 | 3.7 |
| 100715477 | 300886048 | 299.27 | -54.71 | 9.3 | 42.0 | 14.0 | 7.0 | 3.1 | 1.6 |
| 100717446 | 301056096 | 304.31 | 19.53 | 9.2 | 59.0 | 1.0 | 165.7 | 9.9 | 2.4 |
| 100718160 | 301117824 | 121.83 | -46.18 | 5.9 | 49.8 | 121.0 | 2.6 | 4.5 | 2.3 |
| 100719311 | 301217312 | 304.87 | -67.14 | 15.4 | 43.0 | 1.0 | 96.0 | 3.7 | 1.5 |
| 100719825 | 301261696 | 231.41 | 18.56 | 10.3 | 58.0 | 1.0 | 167.4 | 6.5 | 1.6 |
| 100722096 | 301457920 | 238.77 | -15.61 | 1.1 | 32.9 | 13.0 | 6.6 | 2.8 | 1.0 |
| 100724029 | 301624928 | 124.16 | 74.42 | 1.0 | 51.3 | 100.0 | 6.6 | 11.1 | 6.6 |
| 100725475 | 301749888 | 292.26 | 76.20 | 4.0 | 19.2 | 1.0 | 66.6 | 2.6 | 1.3 |
| 100728095 | 301976256 | 88.76 | -15.26 | 0.0 | 59.9 | 147.0 | 6.4 | 19.8 | 7.2 |
| 100728439 | 302005920 | 44.05 | 0.28 | 0.1 | 57.0 | 6.0 | 33.6 | 5.8 | 1.8 |
| 100729415 | 302090240 | 349.59 | -74.86 | 102.8 | 5.6 | 23.0 | - | - | - |
| 100802240 | 302420736 | 2.47 | 47.75 | 0.0 | 64.8 | 150.0 | 8.0 | 16.7 | 14.2 |
| 100805845 | 302732192 | 112.72 | -35.93 | 3.8 | 64.7 | 44.0 | 8.9 | 15.8 | 3.8 |
| 100811108 | 303186944 | 345.87 | 15.86 | 6.0 | 64.0 | 1.0 | 229.4 | 26.4 | 10.1 |
| 100811781 | 303245056 | 108.14 | 62.19 | 3.6 | 17.9 | 16.0 | 5.7 | 2.9 | 1.2 |
| 100820373 | 303987424 | 258.79 | -18.51 | 2.1 | 50.0 | 2.0 | 120.9 | 4.8 | 2.2 |
| 100826957 | 304556320 | 286.43 | -32.63 | 3.8 | 64.2 | 103.0 | 4.0 | 9.9 | 3.8 |
| 100829374 | 304765152 | 115.45 | -3.99 | 4.7 | 61.3 | 80.0 | 3.9 | 7.4 | 3.2 |
| 100905907 | 305416000 | 262.65 | 13.08 | 4.0 | 61.9 | 12.0 | 32.9 | 12.4 | 4.8 |
| 100910818 | 305840256 | 238.10 | -34.62 | 1.0 | 50.8 | 21.0 | 8.2 | 7.8 | 4.7 |
| 100911816 | 305926528 | 151.32 | 58.99 | 11.8 | 59.0 | 1.0 | 12910.0 | 9.4 | 3.4 |
| 100919884 | 306623552 | 163.24 | 6.02 | 1.8 | 42.1 | 14.0 | 6.9 | 3.3 | 1.4 |
| 100923844 | 306965728 | 106.12 | 39.60 | 5.3 | 34.0 | 16.0 | 5.6 | 41.1 | 2.2 |
| 100924165 | 306993504 | 0.67 | 7.00 | 0.0 | 51.0 | 33.0 | - | - | - |
| 100926694 | 307212000 | 43.58 | -11.10 | 12.0 | 46.0 | 1.0 | 113.3 | 6.1 | 2.4 |
| 100929235 | 307431520 | 166.33 | 62.29 | 13.4 | 41.0 | 1.0 | 85.2 | 2.9 | 1.0 |
| 101013412 | 308656352 | 292.08 | -49.64 | 1.6 | 40.0 | 148.0 | 1.9 | 4.4 | 1.6 |
| 101014175 | 308722304 | 26.94 | -51.07 | 1.0 | 54.1 | 116.0 | 2.8 | 6.6 | - |
| 101015558 | 308841856 | 73.16 | 15.46 | 5.9 | 57.0 | 21.0 | 13.5 | 9.5 | - |
| 101017619 | 309019904 | 27.47 | -26.55 | 4.9 | 35.9 | 20.0 | 4.1 | 3.1 | 1.0 |
| 101025146 | 309670208 | 240.19 | -8.49 | 24.4 | 55.0 | 1.0 | 134.6 | 7.0 | 2.2 |
| 101027230 | 309850240 | 79.02 | 43.97 | 11.4 | 30.0 | 1.0 | 75.1 | 3.8 | 1.0 |
| 101101899 | 310340064 | 266.04 | -29.00 | 5.4 | 60.2 | 17.0 | 19.2 | 10.1 | 6.7 |
| 101102840 | 310421408 | 284.68 | -37.03 | 7.8 | 39.1 | 148.0 | 1.0 | 2.9 | 1.2 |
| 101107011 | 310781792 | 168.33 | 22.43 | 4.1 | 36.2 | 147.0 | 1.4 | 2.7 | 1.1 |
| 101112984 | 311297824 | 100.10 | 9.62 | 5.1 | 46.9 | 70.0 | 1.8 | 4.2 | 1.2 |
| 101113483 | 311340928 | 29.08 | 0.21 | 2.7 | 46.3 | 147.0 | 0.9 | 3.6 | 1.1 |
| 101116481 | 311599936 | 32.00 | -81.20 | 7.3 | 13.0 | 1.0 | 66.5 | 3.1 | 1.2 |
| 101126198 | 312439456 | 84.77 | -22.55 | 1.0 | 63.5 | 25.0 | 10.5 | 8.9 | 2.9 |
| 101127093 | 312516832 | 290.31 | 7.89 | 23.2 | 64.9 | 1.0 | 282.1 | 12.4 | 7.6 |
| 101127102 | 312517664 | 70.95 | -11.32 | 6.6 | 29.4 | 14.0 | 5.6 | 2.6 | 0.8 |
| 101128322 | 312623040 | 145.47 | -35.20 | 5.7 | 7.0 | 2.0 | 62.1 | 3.1 | 0.8 |
| 101129652 | 312737984 | 157.75 | -17.25 | 4.6 | 26.0 | 1.0 | 69.8 | 3.8 | 1.6 |
| 101129726 | 312744320 | 271.54 | 1.01 | 8.2 | 41.0 | 1.0 | 85.6 | 5.9 | 1.3 |
| 101204343 | 313143264 | 191.91 | 55.67 | 10.4 | 44.0 | 43.0 | 3.6 | 5.0 | 2.7 |
| 101206036 | 313289536 | 164.08 | -38.11 | 3.5 | 57.5 | 8.0 | 25.2 | 12.8 | 3.2 |
| 101207536 | 313419104 | 175.75 | 8.72 | 3.7 | 57.3 | 148.0 | 1.3 | 6.2 | 1.6 |
| 101208203 | 313476768 | 212.40 | 4.04 | 11.7 | 39.2 | 1.0 | - | - | - |
| 101213849 | 313964544 | 260.99 | -64.51 | 7.1 | 51.0 | 147.0 | 1.2 | 4.3 | 1.8 |
| 101214993 | 314063392 | 185.97 | -24.27 | 10.0 | 60.0 | 13.0 | 16.2 | 6.7 | 2.1 |
| 101219686 | 314468896 | 12.23 | -34.57 | 0.0 | 53.2 | 12.0 | 17.6 | 8.7 | 4.2 |
| 101220576 | 314545792 | 241.57 | 46.14 | 1.2 | 14.7 | 85.0 | 1.0 | 2.5 | 0.8 |
| 101220864 | 314570624 | 2.70 | 27.20 | 1.5 | 63.5 | 33.0 | 8.3 | 9.0 | 3.0 |
| 101224578 | 314891584 | 289.14 | -55.25 | 4.8 | 49.6 | 47.0 | 2.9 | 3.7 | 1.3 |
| 101227406 | 315135904 | 240.50 | -24.50 | 1.6 | 5.0 | 10.0 | 7.2 | 2.2 | 0.9 |
| 101227536 | 315147104 | 150.87 | -49.44 | 2.6 | 57.7 | 16.0 | 11.5 | 8.3 | 4.0 |
| GRB | Amplitude | C-Stat | |||
|---|---|---|---|---|---|
| ( photons cm-2 s-1) | (keV) | ||||
| 080824909 | 0.65 0.33 | -1.02 0.25 | -1.84 0.12 | 113.2 47.6 | 1.27 |
| 080906212 | 12.07 1.58 | -0.42 0.09 | -2.38 0.13 | 163.9 11.8 | 1.29 |
| 080925775 | 1.87 0.19 | -1.00 0.05 | -2.13 0.08 | 136.3 11.6 | 1.32 |
| 081122520 | 4.19 0.44 | -0.64 0.07 | -2.44 0.23 | 221.2 19.9 | 1.02 |
| 081207680 | 0.97 0.04 | -0.66 0.03 | -1.98 0.05 | 417.0 24.8 | 2.44 |
| 081223419 | 4.84 4.20 | -0.25 0.46 | -1.85 0.14 | 104.4 33.3 | 1.03 |
| 081231140 | 1.50 0.08 | -1.07 0.04 | -2.59 0.34 | 251.9 20.6 | 1.38 |
| 090129880 | 0.65 0.10 | -1.52 0.09 | -2.31 0.53 | 184.7 62.5 | 1.10 |
| 090131090 | 2.70 0.52 | -1.11 0.08 | -2.17 0.04 | 55.0 4.2 | 1.85 |
| 090514006 | 1.54 0.56 | -0.81 0.19 | -2.10 0.19 | 103.9 21.4 | 1.12 |
| 090528516 | 2.38 0.14 | -1.00 0.03 | -2.19 0.06 | 163.5 8.9 | 2.43 |
| 090612619 | 1.24 0.15 | -0.81 0.10 | -2.30 0.41 | 399.1 80.6 | 1.18 |
| 090620400 | 1.81 0.21 | -0.45 0.07 | -2.53 0.21 | 157.7 9.8 | 1.26 |
| 090829672 | 1.88 0.04 | -1.59 0.01 | -2.27 0.11 | 254.4 20.1 | 2.62 |
| 091031500 | 0.72 0.04 | -0.91 0.05 | -2.28 0.25 | 474.6 58.5 | 1.54 |
| 091109895 | 50.12 176.00 | 0.78 1.57 | -2.28 0.23 | 46.3 13.6 | 1.10 |
| 091120191 | 2.58 0.27 | -1.02 0.06 | -2.50 0.13 | 101.4 5.8 | 2.30 |
| 091127976 | 10.01 1.61 | -1.28 0.06 | -2.22 0.02 | 34.1 1.4 | 1.53 |
| 091208410 | 1.32 0.20 | -1.34 0.08 | -2.32 0.24 | 110.3 17.3 | 1.30 |
| 091221870 | 1.20 0.17 | -0.76 0.10 | -2.09 0.12 | 205.7 26.8 | 1.53 |
| 100122616 | 6.89 1.65 | -0.91 0.10 | -2.32 0.04 | 42.7 2.3 | 1.49 |
| 100131730 | 11.80 1.32 | -0.57 0.06 | -2.21 0.08 | 138.1 8.4 | 1.02 |
| 100225115 | 0.56 0.06 | -0.83 0.09 | -2.48 0.74 | 493.4 107.0 | 1.37 |
| 100225580 | 3.71 0.46 | -0.76 0.08 | -2.11 0.12 | 194.5 21.4 | 1.22 |
| 100724029 | 3.36 0.04 | -0.76 0.01 | -2.03 0.02 | 413.1 8.9 | 3.19 |
| 100728095 | 1.33 0.02 | -0.86 0.02 | -3.03 0.35 | 413.5 13.3 | 15.24 |
| 101126198 | 3.10 0.13 | -1.25 0.02 | -2.56 0.15 | 156.7 7.5 | 1.62 |
| 101206036 | 0.49 0.11 | -1.13 0.16 | -1.84 0.28 | 467.6 324.0 | 1.20 |
| 101227406 | 3.15 0.91 | -0.51 0.19 | -2.18 0.13 | 148.9 20.9 | 1.48 |
| 101227536 | 0.48 0.03 | -0.73 0.08 | -2.26 0.32 | 828.2 172.0 | 1.19 |
| GRB | T90 | Measured Flux 0.02–20 MeV | Expected Flux 0.1–10 GeV | Flux Limit 0.1–10 GeV |
|---|---|---|---|---|
| (s) | (photons cm-2 s-1) | ( photons cm-2 s-1) | ( photons cm-2 s-1) | |
| 080824909 | 28.67 | 1.04 0.04 | 9.75 8.87 | 4.50 |
| 080906212 | 2.69 | 12.20 0.18 | 3.87 3.32 | 43.60 |
| 080925775 | 38.14 | 3.08 0.03 | 3.85 2.04 | 5.09 |
| 081122520 | 4.10 | 6.37 0.12 | 1.71 2.49 | 24.75 |
| 081207680 | 104.45 | 2.26 0.02 | 20.50 6.49 | 4.31 |
| 081223419 | 2.36 | 2.90 0.13 | 30.00 29.70 | 34.95 |
| 081231140 | 27.65 | 3.37 0.04 | 0.34 0.66 | 2.49 |
| 090129880 | 16.38 | 2.03 0.05 | 0.68 2.26 | 6.94 |
| 090131090 | 57.35 | 2.98 0.03 | 1.64 0.49 | 2.21 |
| 090514006 | 12.97 | 1.70 0.06 | 2.31 3.10 | 5.05 |
| 090528516 | 61.44 | 4.25 0.03 | 3.71 1.50 | 5.05 |
| 090612619 | 6.14 | 2.91 0.09 | 3.26 7.79 | 32.23 |
| 090620400 | 49.41 | 1.81 0.03 | 0.19 0.26 | 5.31 |
| 090829672 | 94.21 | 6.61 0.03 | 3.31 2.20 | 1.76 |
| 091031500 | 45.06 | 1.89 0.03 | 2.60 3.65 | 4.07 |
| 091109895 | 6.14 | 1.44 0.11 | 0.36 0.64 | 20.74 |
| 091120191 | 53.25 | 3.56 0.04 | 0.25 0.23 | 3.80 |
| 091127976 | 14.08 | 10.70 0.05 | 3.49 0.48 | 6.73 |
| 091208410 | 16.38 | 2.87 0.06 | 0.69 1.15 | 7.69 |
| 091221870 | 34.82 | 1.98 0.04 | 4.78 3.93 | 4.86 |
| 100122616 | 29.70 | 4.11 0.04 | 0.63 0.22 | 3.69 |
| 100131730 | 3.46 | 12.20 0.15 | 9.81 5.04 | 10.33 |
| 100225115 | 18.99 | 1.44 0.05 | 0.69 2.73 | 7.16 |
| 100225580 | 5.12 | 5.86 0.10 | 11.60 9.48 | 25.36 |
| 100724029 | 100.35 | 8.02 0.03 | 48.40 5.20 | 13.52 |
| 100728095 | 147.46 | 3.20 0.02 | 0.06 0.11 | 3.81 |
| 101126198 | 25.60 | 6.91 0.05 | 0.45 0.44 | 10.43 |
| 101206036 | 17.92 | 1.44 0.07 | 23.70 39.70 | 13.89 |
| 101227406 | 10.50 | 3.27 0.10 | 3.51 3.10 | 6.23 |
| 101227536 | 18.82 | 1.55 0.05 | 5.00 8.10 | 13.32 |
| GRB | Amplitude | Cash | DOF | C-Stat | ||||
|---|---|---|---|---|---|---|---|---|
| ( photons cm-2 s-1) | (keV) | |||||||
| 080824909 | 0.53 0.12 | -1.11 0.13 | -2.41 0.15 | 151.2 31.3 | 475.73 | 378 | -0.56 0.15 | 2.32 |
| 080906212 | 10.79 1.10 | -0.48 0.07 | -2.55 0.12 | 176.4 10.1 | 639.11 | 504 | -0.17 0.12 | 0.20 |
| 080925775 | 1.70 0.12 | -1.05 0.04 | -2.42 0.09 | 154.0 9.4 | 500.77 | 380 | -0.30 0.09 | 9.53 |
| 081122520 | 3.99 0.35 | -0.67 0.07 | -2.64 0.19 | 232.7 17.0 | 501.82 | 502 | -0.20 0.19 | 0.04 |
| 081207680 | 0.87 0.02 | -0.73 0.02 | -2.70 0.12 | 528.2 24.3 | 952.43 | 385 | -0.72 0.12 | 14.57 |
| 081223419 | 2.57 1.02 | -0.57 0.25 | -2.23 0.15 | 149.6 32.0 | 399.95 | 380 | -0.37 0.15 | 0.67 |
| 081231140 | 1.46 0.07 | -1.08 0.03 | -3.46 0.71 | 265.7 16.0 | 509.18 | 378 | -0.88 0.71 | 0.01 |
| 090129880 | 0.61 0.07 | -1.55 0.07 | -4.16 36.00 | 219.9 56.2 | 406.74 | 379 | -1.85 36.00 | 0.00 |
| 090131090 | 1.62 0.16 | -1.33 0.05 | -2.42 0.09 | 73.8 4.6 | 696.42 | 374 | -0.25 0.09 | 15.51 |
| 090514006 | 1.49 0.41 | -0.82 0.15 | -2.30 0.10 | 109.1 15.1 | 424.25 | 380 | -0.19 0.10 | 2.59 |
| 090528516 | 2.14 0.09 | -1.06 0.03 | -2.49 0.11 | 187.2 8.6 | 1216.40 | 504 | -0.30 0.11 | 9.20 |
| 090612619 | 1.18 0.10 | -0.84 0.08 | -3.41 0.66 | 444.0 65.5 | 436.14 | 379 | -1.11 0.66 | 0.00 |
| 090620400 | 1.77 0.18 | -0.47 0.07 | -2.60 0.14 | 160.0 8.6 | 469.50 | 377 | -0.07 0.14 | 0.08 |
| 090829672 | 1.83 0.03 | -1.60 0.01 | -3.07 0.48 | 287.0 17.3 | 972.98 | 379 | -0.80 0.48 | 0.39 |
| 091031500 | 0.70 0.03 | -0.92 0.04 | -2.63 0.09 | 501.1 50.2 | 567.74 | 378 | -0.35 0.09 | 0.02 |
| 091109895 | 54.26 190.00 | 0.81 1.58 | -2.24 0.11 | 45.6 12.3 | 272.81 | 255 | 0.04 0.11 | -0.04 |
| 091120191 | 2.53 0.24 | -1.03 0.05 | -2.56 0.11 | 103.1 5.1 | 589.17 | 262 | -0.06 0.11 | 0.31 |
| 091127976 | 8.55 1.16 | -1.34 0.06 | -2.26 0.02 | 36.4 1.4 | 774.38 | 495 | -0.04 0.02 | 25.95 |
| 091208410 | 1.35 0.20 | -1.33 0.07 | -2.28 0.07 | 107.4 13.9 | 480.39 | 376 | 0.04 0.07 | 0.07 |
| 091221870 | 1.06 0.10 | -0.84 0.07 | -2.48 0.11 | 241.0 22.8 | 571.15 | 379 | -0.40 0.11 | 2.67 |
| 100122616 | 6.01 1.28 | -0.96 0.09 | -2.38 0.05 | 44.6 2.3 | 557.59 | 379 | -0.06 0.05 | 5.13 |
| 100131730 | 8.07 0.48 | -0.78 0.04 | -3.32 0.20 | 183.8 7.3 | 399.27 | 382 | -1.11 0.20 | 2.59 |
| 100225115 | 0.56 0.05 | -0.83 0.09 | -2.54 0.17 | 496.8 94.8 | 506.20 | 379 | -0.06 0.17 | -0.02 |
| 100225580 | 3.02 0.21 | -0.88 0.05 | -3.25 0.24 | 248.8 17.7 | 619.61 | 509 | -1.14 0.24 | 1.72 |
| 100724029 | 3.08 0.03 | -0.82 0.01 | -2.51 0.03 | 502.1 8.6 | 1435.30 | 378 | -0.48 0.03 | 170.70 |
| 100728095 | 1.33 0.02 | -0.86 0.02 | -2.84 0.12 | 410.8 12.4 | 5633.20 | 379 | 0.19 0.12 | 0.70 |
| 101126198 | 3.08 0.12 | -1.26 0.02 | -2.62 0.16 | 158.4 7.2 | 603.71 | 379 | -0.06 0.16 | 0.37 |
| 101206036 | 0.49 0.07 | -1.12 0.12 | -2.45 0.27 | 514.9 209.0 | 445.33 | 378 | -0.62 0.27 | 0.06 |
| 101227406 | 2.18 0.38 | -0.74 0.13 | -2.53 0.20 | 188.7 21.3 | 549.62 | 378 | -0.35 0.20 | 3.26 |
| 101227536 | 0.47 0.03 | -0.75 0.07 | -3.65 0.86 | 930.3 164.0 | 440.63 | 378 | -1.39 0.86 | 0.01 |
References
- Abdo et al. (2009a) Abdo, A. A., et al. 2009a, ApJ, 706, L138
- Abdo et al. (2009b) —. 2009b, ApJ, 706, L138
- Abdo et al. (2009c) —. 2009c, ApJ, 707, 580
- Abdo et al. (2009d) —. 2009d, Science, 323, 1688
- Abdo et al. (2010) —. 2010, ApJ, submitted
- Ackermann et al. (2010a) Ackermann, M., et al. 2010a, ApJ, 716, 1178
- Ackermann et al. (2010b) —. 2010b, ApJ, 716, 1178
- Ackermann et al. (2011a) —. 2011a, ApJ, 729, 114
- Ackermann et al. (2011b) —. 2011b, ApJ, 729, 114
- Amsler et al. (2008) Amsler, C., et al. 2008, Phys. Lett., B667, 1
- Atwood et al. (2009) Atwood, W. B., et al. 2009, ApJ, 697, 1071
- Band et al. (1993) Band, D., et al. 1993, ApJ, 413, 281
- Band et al. (2009) Band, D. L., et al. 2009, ApJ, 701, 1673
- Baring (2006) Baring, M. G. 2006, ApJ, 650, 1004
- Bissaldi et al. (2011) Bissaldi, E., et al. 2011, ApJ, 733, 97
- Brown et al. (1973) Brown, R. W., Mikaelian, K. O., & Gould, R. J. 1973, Astrophys. Lett., 14, 203
- Cash (1976) Cash, W. 1976, A&A, 52, 307
- Castor (1995) Castor, J. 1995, private communication
- Cucchiara et al. (2009) Cucchiara, A., Fox, D., Levan, A., & Tanvir, N. 2009, GRB Coordinates Network, 10202, 1
- Del Monte et al. (2011) Del Monte, E., et al. 2011, A&A, 535, A120
- Fan & Piran (2008) Fan, Y., & Piran, T. 2008, Frontiers of Physics in China, 3, 306
- Gehrels et al. (2004) Gehrels, N., et al. 2004, ApJ, 611, 1005
- González et al. (2003) González, M. M., Dingus, B. L., Kaneko, Y., Preece, R. D., Dermer, C. D., & Briggs, M. S. 2003, Nature, 424, 749
- Gould & Schréder (1967) Gould, R. J., & Schréder, G. P. 1967, Physical Review, 155, 1408
- Granot et al. (2008) Granot, J., Cohen-Tanugi, J., & do Couto e Silva, E. 2008, ApJ, 677, 92
- Guiriec et al. (2011a) Guiriec, S., et al. 2011a, ApJ, 727, L33+
- Guiriec et al. (2011b) —. 2011b, ApJ, 727, L33
- Hascoët et al. (2011) Hascoët, R., Daigne, F., Mochkovitch, R., & Vennin, V. 2011, ArXiv e-prints
- Helene (1983) Helene, O. 1983, Nuclear Instruments and Methods in Physics Research, 212, 319
- Hurley et al. (1994) Hurley, K., et al. 1994, Nature, 372, 652
- Jackson et al. (2005) Jackson, B., et al. 2005, Signal Processing Letters, IEEE, 12, 105
- Kaneko et al. (2006) Kaneko, Y., Preece, R. D., Briggs, M. S., Paciesas, W. S., Meegan, C. A., & Band, D. L. 2006, ApJS, 166, 298
- Kouveliotou et al. (1994) Kouveliotou, C., et al. 1994, ApJ, 422, L59
- Kraft et al. (1991) Kraft, R. P., Burrows, D. N., & Nousek, J. A. 1991, ApJ, 374, 344
- Lithwick & Sari (2001) Lithwick, Y., & Sari, R. 2001, ApJ, 555, 540
- Mattox et al. (1996) Mattox, J. R., et al. 1996, ApJ, 461, 396
- McBreen et al. (2010) McBreen, S., et al. 2010, A&A, 516, A71
- Meegan et al. (2009a) Meegan, C., et al. 2009a, ApJ, 702, 791
- Meegan et al. (2009b) —. 2009b, ApJ, 702, 791
- Preece et al. (2000a) Preece, R. D., Briggs, M. S., Mallozzi, R. S., Pendleton, G. N., Paciesas, W. S., & Band, D. L. 2000a, ApJS, 126, 19
- Preece et al. (2000b) —. 2000b, ApJS, 126, 19
- Razzaque et al. (2004) Razzaque, S., Mészáros, P., & Zhang, B. 2004, ApJ, 613, 1072
- Sommer et al. (1994) Sommer, M., et al. 1994, ApJ, 422, L63
- Walker et al. (2000) Walker, K. C., Schaefer, B. E., & Fenimore, E. E. 2000, ApJ, 537, 264