No need for conspiracy: Self-organized cartel formation in a modified trust game
Abstract
We investigate the dynamics of a trust game on a mixed population where individuals with the role of buyers are forced to play against a predetermined number of sellers, whom they choose dynamically. Agents with the role of sellers are also allowed to adapt the level of value for money of their products, based on payoff. The dynamics undergoes a transition at a specific value of the strategy update rate, above which an emergent cartel organization is observed, where sellers have similar values of below optimal value for money. This cartel organization is not due to an explicit collusion among agents; instead it arises spontaneously from the maximization of the individual payoffs. This dynamics is marked by large fluctuations and a high degree of unpredictability for most of the parameter space, and serves as a plausible qualitative explanation for observed elevated levels and fluctuations of certain commodity prices.
pacs:
89.65.Ef 02.50.Le 05.65.+b 89.75.HcModern societies are complex systems, where observed macroscopic properties are the emergent result of collective actions of individual agents. The most commonly adopted scenario assumes that agents select strategies which are perceived to be in their own best interest. This decision, however, must often be made without full a priori knowledge of the most likely outcome, and thus must rely on some notion of belief, or trust. Common examples include most types of markets, where buyers must decide if a certain product is worth its cost, and sellers must decide which price they should assign for their products. At the most fundamental level, this problem can be framed as a trust game Berg et al. (1995); McCabe et al. (2003); Sigmund (2010), where a buyer must decide whether he buys a product at a given cost, and the seller decides which cost to select. If the price is perceived to be fair by both parties, the outcome is positive for both of them, otherwise it slants in favor of either party. A real market, however, is composed of many buyers and sellers, and depending on the situation, buyers do not have the option of not buying, instead they can only realistically choose from whom they buy. This is often the case, for instance, for car owners who must buy gasoline, people who must buy groceries, bank account and credit card owners, etc. In this Letter, we investigate the dynamics of a trust game on a population of agents who face this restriction, and form an adaptive network of interactions Zimmermann and Eguíluz (2005); Pacheco et al. (2006); Szabó and Fáth (2007); Li et al. (2007); Gross and Blasius (2008); Lee et al. (2011a, b); Zhang et al. (2011); Ben-Naim et al. (2006). We identify the emergence of an effective cartel-like dynamics, where agents share low values of value for money, to the overall benefit of the sellers and detriment of the buyers. This cartel dynamics emerges without any explicit collusion among the agents, who react independently in order to maximize their payoff. In this dynamical phase, the evolution of the average value for money in the population is marked by very large fluctuations, and high degree of unpredictability, with aperiodic behavior and very broad spectral densities. These variations are a result of a never-ending tug-of-war between sellers and buyers, where buyers seek the best sellers, who in turn compete among themselves, while at the same time benefiting collectively from uniformly low value for money. This type of dynamics can be directly compared to the time evolution of certain commodity prices such as gasoline, which is known to fluctuate considerably between gas stations Eckert (2011); Maskin and Tirole (1988); Noel (2007), both in space and time, sometimes with multiple price changes within a single day, without any apparent connection to the fluctuation of crude oil prices. Our model provides a conceptual explanation of the origin of such fluctuations, which does not require the explicit collusion among the sellers as a necessary element driving price changes.
Our model is defined as follows. We consider a population of agents, where each agent has two simultaneous roles: donator (e.g. a buyer) and rewarder (e.g. a seller). To each agent we assign a value for money variable . This can be interpreted, for instance, as the quality of a sold product or service. Each agent is forced to choose exactly rewarders to whom it must donate 111We considered also the variant where the number of rewarders is randomly distributed according to a Poisson with average . The results were qualitatively very similar, with the only noticeable deviation being slightly different critical values marking the dynamical phase transition.. This forms a network of nodes, where the adjacency matrix describes the donators’ choices. Each agent has a donator and a rewarder payoff, and , respectively, defined as,
| (1) | ||||
| (2) |
where is the number of donators who choose agent (the in-degree of ). Eq. 1 can be interpreted simply as the overall satisfaction a customer has with his buying choices, and Eq. 2 as the overall profit a business makes, which is assumed proportional to how many customers it has, , and to the complement of the value for money it provides, . We assume these payoff values correspond to continued interactions between players, instead of single isolated events (e.g. repeated games after an unspecified number of rounds), and are accumulated on a time scale which is much faster than the strategy update dynamics. The strategies of each agent correspond to their chosen value for money , and their choice of rewarders. These strategies are updated dynamically as follows. At each time step, a agent is randomly chosen. With probability its rewarder strategy is updated, otherwise its donator strategy is updated. The actual strategy updates are performed according to the following rules:
-
1.
Donator update. For the agent , a random, currently chosen rewarder is selected, so that , and compared with another rewarder , with , randomly chosen among the entire population. If , then the rewarder is replaced, i.e. and .
-
2.
Rewarder update. For the agent , another agent is randomly selected from the population. If , then its value for money is copied, i.e. .
Thus the donator strategies are updated by simple comparison, and the rewarder strategies are updated by replication. This is so chosen, since it is always better for a donator to switch to a better rewarder, whereas it is not a priori obvious which is the best value for money a rewarder should select: If the value for a given agent is lowered, the higher will be its payoff immediately, but on the other hand, the larger is the likelihood it will lose donators as soon as they update their strategies. Conversely, if the value of is increased, it will decrease the rewarders payoff immediately, but it may attract more donators in the future, which will then cause an increased payoff. Replication based on payoff automatically chooses the strategies which are more successful at a given stage, and is thus the most commonly adopted scenario in evolutionary game theory Sigmund (2010).
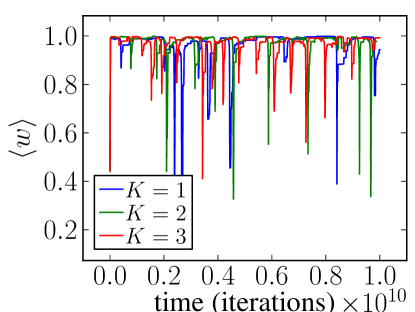
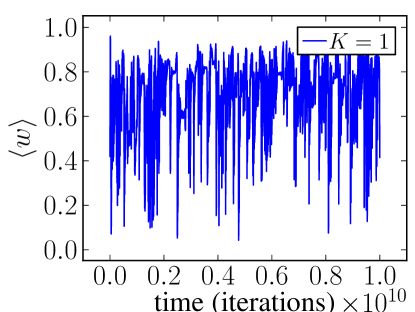
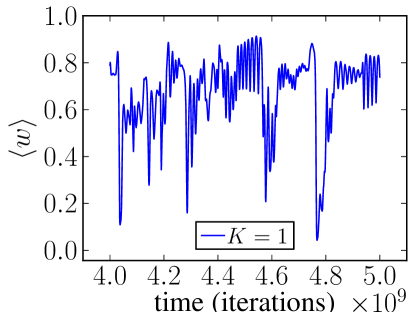
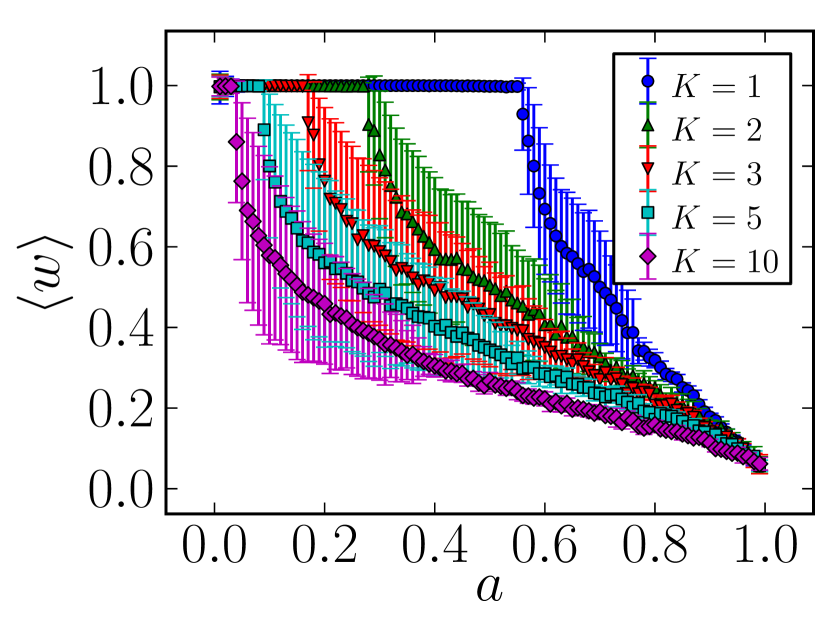
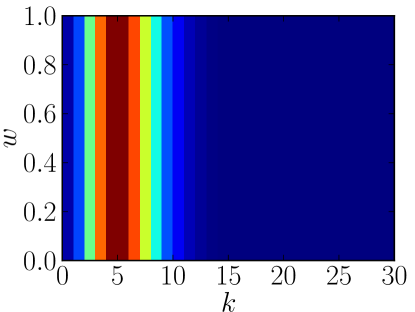
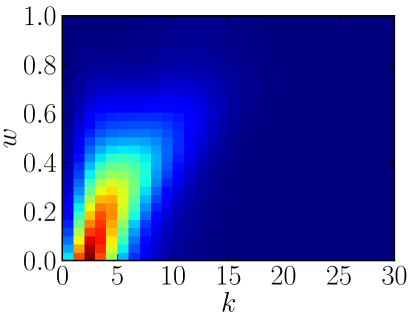
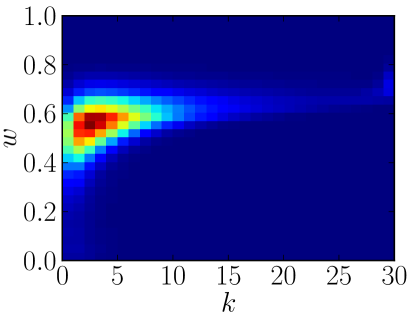
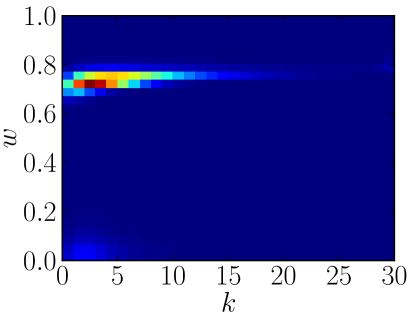
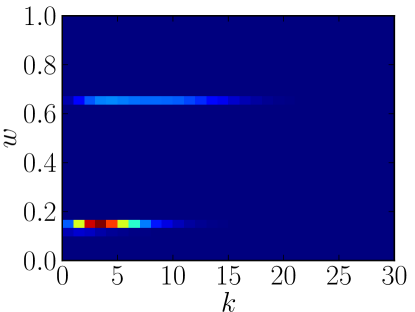
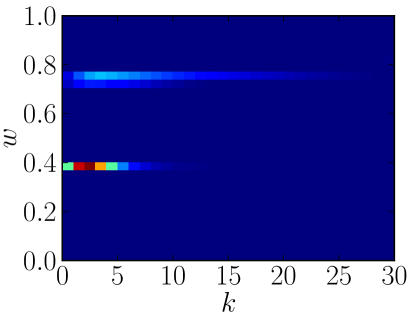
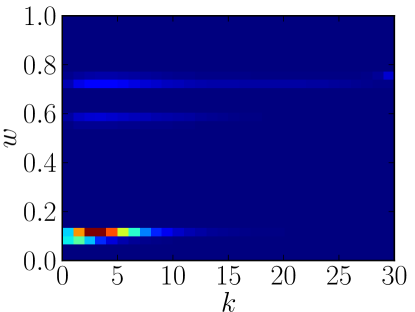
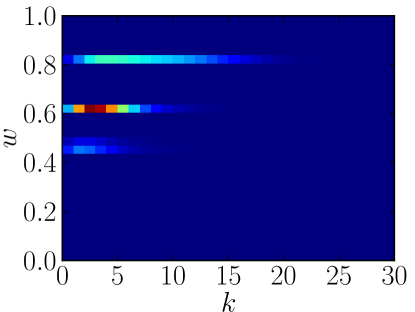
We investigate the dynamics of this model by simulating a population of agents, as well as obtaining some properties analytically in the limit . In order to avoid absorbing states where a single value for money is fixated on the entire population, we introduce a small noise probability that at each time step a randomly chosen agent acquires a random value of . The dynamics will depend strongly on the parameter , which controls the relative speed with which rewarders update their strategies, when compared to donators. If this value is too low, the donators will react fast enough to changes in available value for money, selecting those with higher values, and only these agents will have a larger rewarder payoff, and thus the dynamics will settle on a stable fixed point where the entire population has the same value of , witch tends asymptotically to one, as can be seen is Fig. 1a. In this situation all rewarders will on average receive the same number of donators, which will be distributed according to a Poisson. This is the ideal scenario for donators, but the worst possible for rewarders, since their average payoff values reach their maximum and minimum values, respectively. However, as the remaining panels of Fig. 1 show, this situation changes as is increased. For values of , where is a critical value depending on , the average value for money fluctuates around values smaller than one, since the rewarders are quick enough to copy low values of , so that there are few higher values of left in the population, before the donators have a chance to react. The values of remain low since there are no other options for the donators to choose from. This is an emergent cartel-like dynamical phase, since all rewarders have settled on a range of values which is beneficial to the entire population of rewarders, and detrimental to the population of donators, which are left with a restricted choice. However the values of are not quite stable and fluctuate tremendously, due to influence of the donators and the always ongoing competition between rewarders.
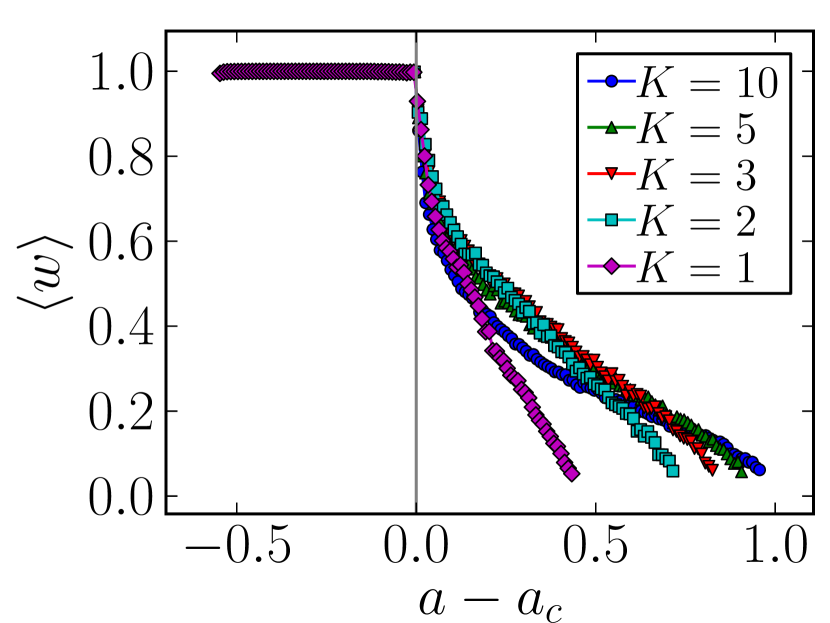
In Fig. 2a can be seen the phase diagram for diverse values of , which show the emergence of the cartel phase at a critical value of , after which the ceases to be stable. The stability of this fixed point can be accessed by a linear stability analysis: If this fixed point is perturbed by the inclusion of a small fraction of agents with a lower value of , the time evolution of the probability density of agents with this value and in-degree is given by,
| (3) |
where is a Poisson distribution with average , and terms of order were neglected (see Eq. 4 below for the full master equation). The first term of Eq. 3 corresponds simply to the probability of rewarders adopting the invading strategy, whereas the second term accounts for the probability of agents with the invading strategy losing donators. Eq. 3 is a linear system, and thus can be written in the form , where are the individual variables, and is a matrix corresponding to the right-hand side of Eq. 3. If the value of is large enough so that the real part of an eigenvalue of becomes larger than zero, , the fixed point ceases to be stable. By numerically computing , one can find the value of for which . These values predict exactly the transition point, as Fig. 2b shows.
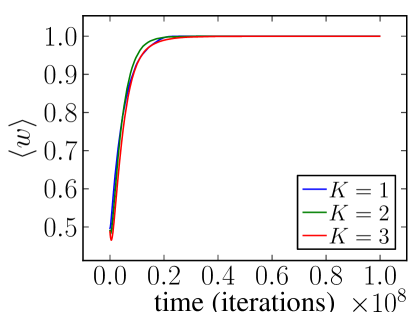
(a)
(b)
(c)
(d)
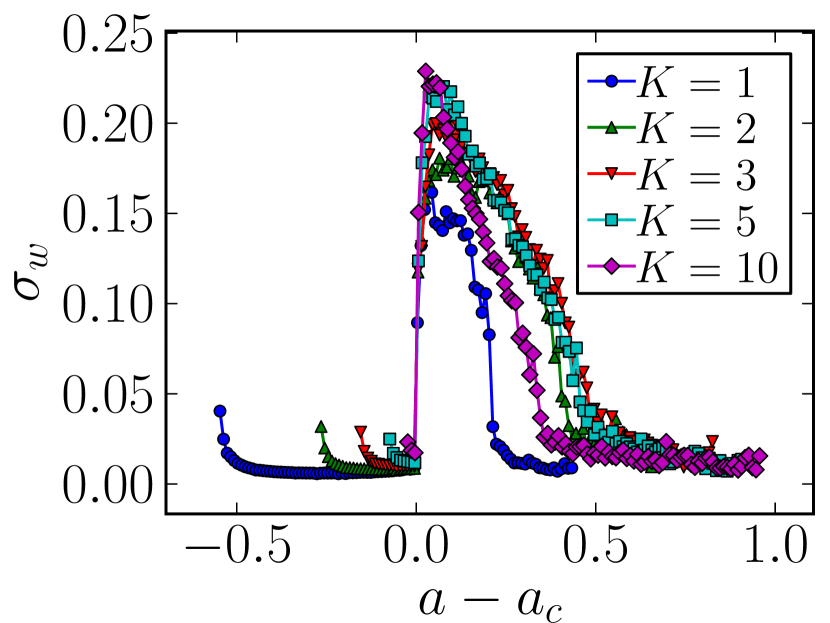
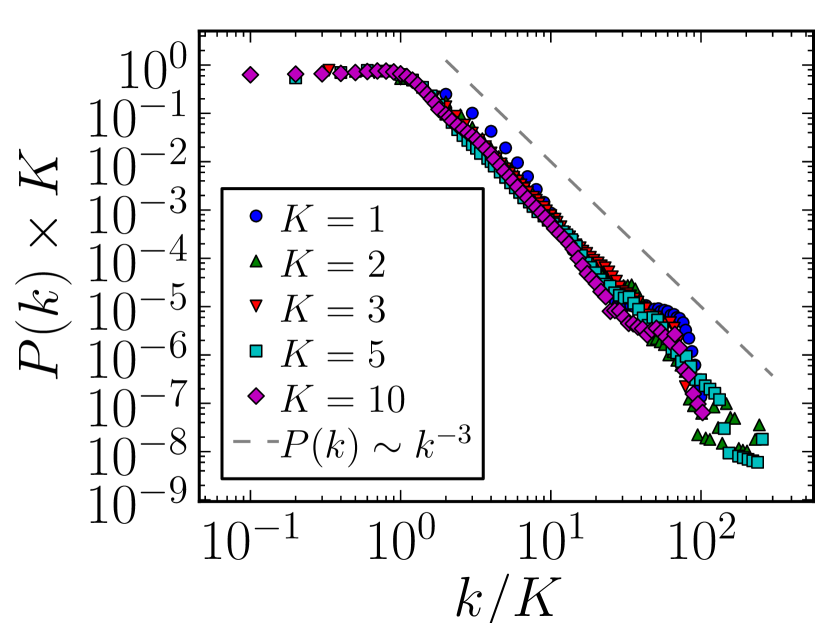
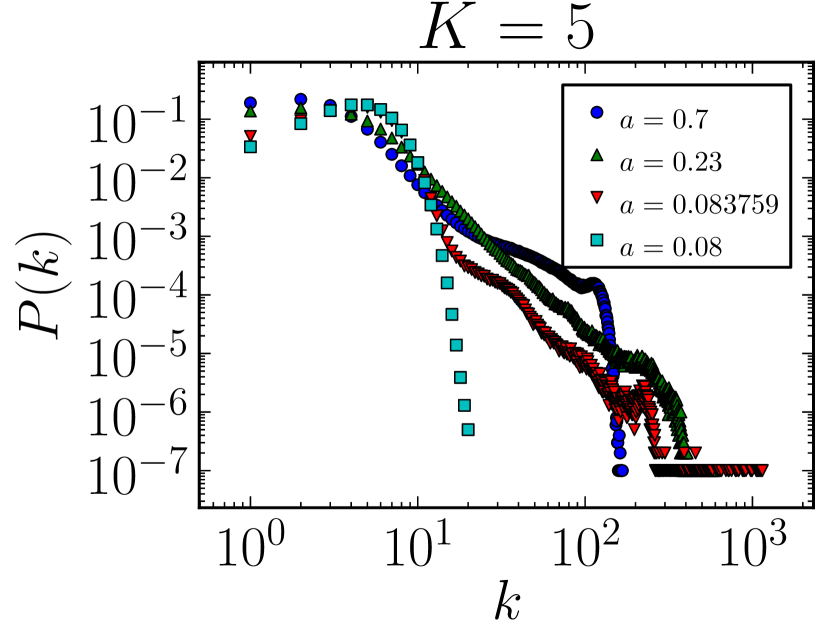
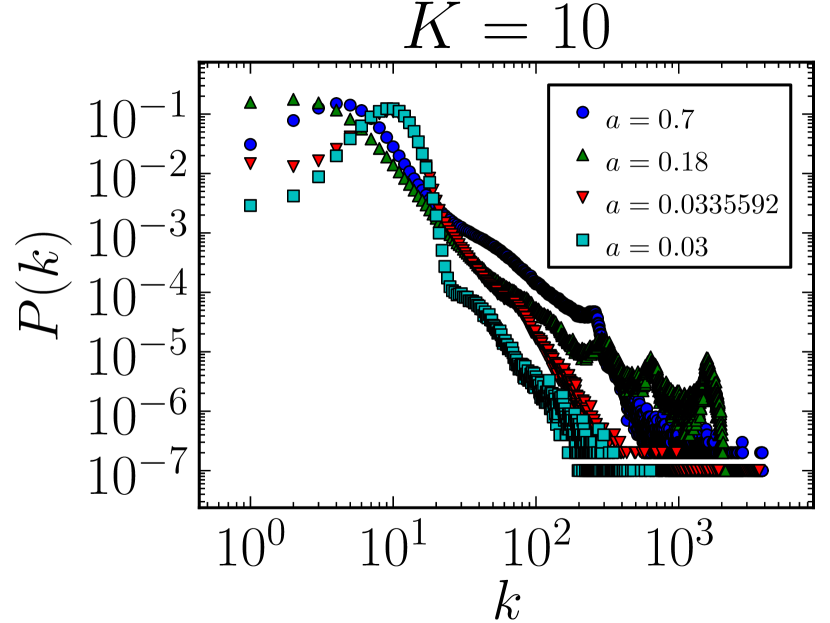
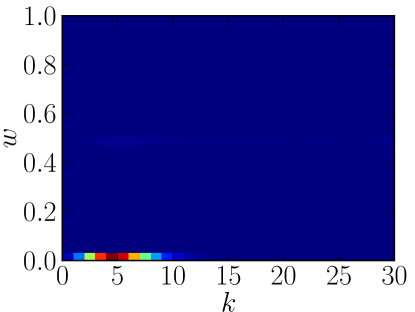
Exactly at the critical value , the oscillations of show typical critical behavior, with sharp jumps from the average value close to one, corresponding to repeated successful invasions of low value for money, which disappear after a relatively short time. Interestingly, the variance of the average value over time, , is largest not exactly at the critical point, but at values close to it, as Fig. 3a shows. Exactly for the values of for which is maximum, one obtains an universal behavior for the in-degree distribution of agents (accumulated over the entire history), which exhibits a power law tail of the form (see Fig. 3b). For larger values of the fluctuations diminish but remain significant. Indeed the distributions are broad for almost the entire parameter space, as the remaining panels of Fig. 3 show.
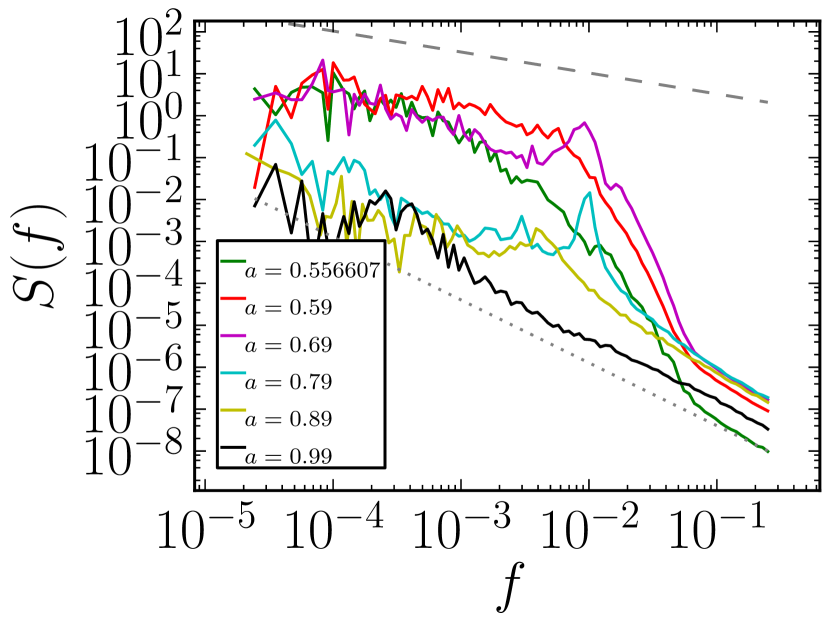
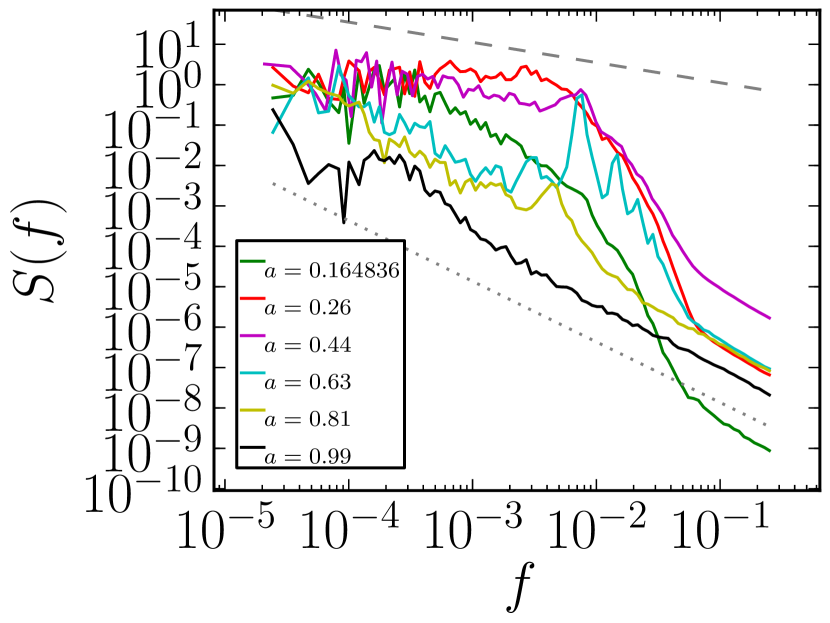
A visual analysis of the temporal evolution of the values of cannot reveal the precise characteristics of the fluctuations, e.g. whether it is aperiodic or quasi-periodic. In Fig. 4 is shown the spectral density of the time series, revealing very broad spectra, compatible with aperiodic behavior. For values of close to , a spectrum is clearly identified, with . For lower values of , the spectrum is divided roughly into lower and high frequency regions, with stronger fluctuations at lower frequencies. The lower-frequency spectrum is significantly broad, and is compatible with a decay, with exponents in the range .
(a)
(b)
The exact dynamics which give rise to the observed fluctuations can be explored more closely by specifying the full master equation which describes the behavior of the system in the limit . For practical reasons, we assume now that the values of must be chosen from a discrete set of elements distributed uniformly in the range. Taking the limit , one recovers the exact same model as before. One can describe the time evolution of the probability of observing a agent with value for money and in-degree as,
| (4) |
where and describe the rewarder replication and donator comparison dynamics, respectively. The term is defined as,
| (5) |
where . The first term in Eq. 5 corresponds to the probability of randomly selected agent with a lower or equal payoff selecting as the new strategy, and the second term to the probability of an agent with strategy finding another agent with higher or equal payoff and a different value . The term describes the change in which is due to donators selecting different rewarders, and is given by,
| (6) |
where and . The fist two terms in Eq. 6 correspond to the probability of a rewarder with strategy losing a donator due to a comparison with a random rewarder with a higher or equal value . The two remaining terms describe the converse probability of a rewarder receiving a donator from another rewarder with value . The time evolution of for is shown in Fig. 5, starting from a random configuration where all values of are equally probable, and the in-degree distribution is a Poisson for all values of . Initially, the mass of the distribution shifts to lower values of as agents adopt a value for money with a larger payoff. Simultaneously, the upper left portion of the distribution increases in mass, since the rewarders with larger receive more donators. Eventually the payoff of the rewarders with high and will be large enough to drive the entire distribution upwards. At this point, all rewarders will receive approximately the same number of donators, and the system will become susceptible to an invasion of low value for money. Due to the same dynamics as before, the new front of low value for money will move upwards in the axis, prompting the eventual appearance of yet another front, and so on. Although this corresponds to cycles of average value for money, the whole dynamics is aperiodic, and is not easy to predict when the next front will come, and how it will interact with the preceding ones. This dynamics of succeeding fronts proceeds indefinitely, and the system never settles on a fixed point.
In conclusion, we have developed a minimal model of a trust game played on a population of agents, which displays an emergent cartel-like behavior, with large fluctuations of value for money. As mentioned previously, this model provides a qualitative explanation for the price fluctuation of certain commodity prices, such as gasoline. As many empirical studies have shown Eckert (2011), the price of gasoline fluctuates between gas stations. The average price for a given city often exhibits daily variations, and sometimes fluctuates within the same day. The average price often rises very fast, and decay more slowly. This type of oscillation is called Edgeworth price cycles Maskin and Tirole (1988), and is predicted by simple models involving two companies, which change their strategy at each round, reacting to the strategy played by the other company at the previous round Maskin and Tirole (1988); Noel (2007). This model, however, is not applicable in situations involving many companies. Our model not only assumes that there are many sellers, but also it incorporates the behavior of the buyers explicitly. The resulting oscillations which we observe are a result of the competition in the entire market, not the steady state behavior of very few companies which observe each other directly. Furthermore, it sheds light on the question of market regulation. It is often discussed if the observed fluctuations are a result of collusion among the gas companies, who attempt to increase the gas prices in unison Eckert (2011). Although this is certainly a possibility, our model shows that an explicit coordinated behavior among sellers is not an indispensable requirement for a cartel-like behavior.
We acknowledge the support of the DFG under contract INST 144/242-1 FUGG.
References
- Berg et al. (1995) J. Berg, J. Dickhaut, and K. McCabe, Games and Economic Behavior 10, 122–142 (1995).
- McCabe et al. (2003) K. A. McCabe, M. L. Rigdon, and V. L. Smith, Journal of Economic Behavior & Organization 52, 267–275 (2003).
- Sigmund (2010) K. Sigmund, The Calculus of Selfishness: (Princeton University Press, 2010).
- Zimmermann and Eguíluz (2005) M. G. Zimmermann and V. M. Eguíluz, Physical Review E 72, 056118 (2005).
- Pacheco et al. (2006) J. M. Pacheco, A. Traulsen, and M. A. Nowak, Physical Review Letters 97, 258103 (2006).
- Szabó and Fáth (2007) G. Szabó and G. Fáth, Physics Reports 446, 97 (2007).
- Li et al. (2007) W. Li, X. Zhang, and G. Hu, Physical Review E 76, 045102 (2007).
- Gross and Blasius (2008) T. Gross and B. Blasius, Journal of The Royal Society Interface 5, 259 (2008).
- Lee et al. (2011a) S. Lee, P. Holme, and Z. Wu, Physical Review Letters 106, 028702 (2011a).
- Lee et al. (2011b) S. Lee, P. Holme, and Z. Wu, Physical Review E 84, 061148 (2011b).
- Zhang et al. (2011) C. Y. Zhang, J. L. Zhang, G. M. Xie, and L. Wang, The European Physical Journal B 80, 217 (2011).
- Ben-Naim et al. (2006) E. Ben-Naim, F. Vazquez, and S. Redner, The European Physical Journal B - Condensed Matter and Complex Systems 49, 531 (2006).
- Eckert (2011) A. Eckert, Journal of Economic Surveys (2011), DOI: 10.1111/j.1467-6419.2011.00698.x.
- Maskin and Tirole (1988) E. Maskin and J. Tirole, Econometrica 56, 571 (1988).
- Noel (2007) M. D. Noel, The Journal of Industrial Economics 55, 69 (2007).
- Note (1) We considered also the variant where the number of rewarders is randomly distributed according to a Poisson with average . The results were qualitatively very similar, with the only noticeable deviation being slightly different critical values marking the dynamical phase transition.