11email: joanna.skilton@mpi-hd.mpg.de 22institutetext: X-ray and Observational Astronomy Group, Department of Physics and Astronomy, University of Leicester, LE1 7RH, UK 33institutetext: School of Physics and Astronomy, University of Leeds, LS2 9JP, UK 44institutetext: CSIRO Astronomy and Space Science, P.O. Box 76, Epping, NSW 1710, Australia
Constraints on the non-thermal emission from Carinae’s blast wave of 1843
Non-thermal hard X-ray and high-energy (HE; 1 MeV E 100 GeV) -ray emission in the direction of Carinae has been recently detected using the INTEGRAL, AGILE and Fermi satellites. This emission has been interpreted either in the framework of particle acceleration in the colliding wind region between the two massive stars or in the very fast moving blast wave which originates in the historical 1843 “Great Eruption”. Archival Chandra data has been reanalysed to search for signatures of particle acceleration in Carinae’s blast wave. No shell-like structure could be detected in hard X-rays and a limit has been placed on the non-thermal X-ray emission from the shell. The time dependence of the target radiation field of the Homunculus is used to develop a single zone model for the blast wave. Attempting to reconcile the X-ray limit with the HE -ray emission using this model leads to a very hard electron injection spectrum with 1.8, harder than the canonical value expected from diffusive shock acceleration.
Key Words.:
Acceleration of particles, stars:binaries, stars:individual: Carinae, gamma-rays:stars, X-rays:stars1 Introduction
Carinae is a binary system composed of a massive primary (, Car A) and a less massive secondary (, Car B) star (see e.g. Nielsen et al. 2007) which orbit each other in 2022.7 1.3 days (Damineli et al. 2008a). Carinae experienced a historical outburst (the “Great Eruption”) in the 19th century and ejected 12 of gas which moves outwards at an average speed of 650 km s-1 (Smith et al. 2003) forming the “Homunculus Nebula”. Recent observations show that Carinae is surrounded at a distance of 0.25 pc by a very fast moving blast wave ( km s-1) produced in the giant outburst of 1843 (also known as the “Great Eruption”) (Smith 2008). This blast wave currently overruns the “Outer Ejecta” a ring-like structure of material which originates from an ejection of mass from Carinae years ago (Walborn et al. 1978). This fast-moving material mimics a low-energy supernova remnant (SNR) shell (Smith 2008), with a blast wave moving into the ISM with velocities comparable to the historical supernovae RCW 86 (Vink et al. 2006) and SN 1006 (Vink 2005).
There is evidence for the presence of relativistic particles in Carinae. The existence of non-thermal X-ray emission was recently reported by the INTEGRAL collaboration (Leyder et al. 2008). In the high energy (HE; 1 MeV 300 GeV) domain, a source spatially coincident with the Carinae position was reported by the AGILE and Fermi collaborations (Tavani et al. 2009; Abdo et al. 2009, 2010). Within the measured positional uncertainties of INTEGRAL and Fermi-LAT, particle acceleration via the diffusive shock acceleration (DSA) process is possible in the colliding wind region (CWR) of Carinae and/or in the expanding blast wave of the Great Eruption of 1843 (see Ohm et al. 2010, for a detailed modelling). The absence of significant variability in the 50 keV and MeV-GeV regime is surprising in a colliding wind binary (CWB) picture, particularly during periastron passage where a collapse of the CWR is expected (see e.g. Parkin et al. 2009, and references therein) and hence no particle acceleration should occur. The blast-wave scenario provides a good explanation of the observed emission because of the existence of an extended emission region, thus explaining the lack of significant variability of the source. While Fermi and INTEGRAL do not provide sufficient angular resolution to resolve the blast wave, X-ray observations with the current generation of instruments should provide resolved images of the region. However there is likely to be some confusion of the possible non-thermal X-ray shell with thermal emission from the Outer Ejecta (see Seward et al. 2001, for more details). In this work, archival Chandra X-ray data have been analysed to search for signatures of accelerated particles in the blast-wave region.
2 Chandra data
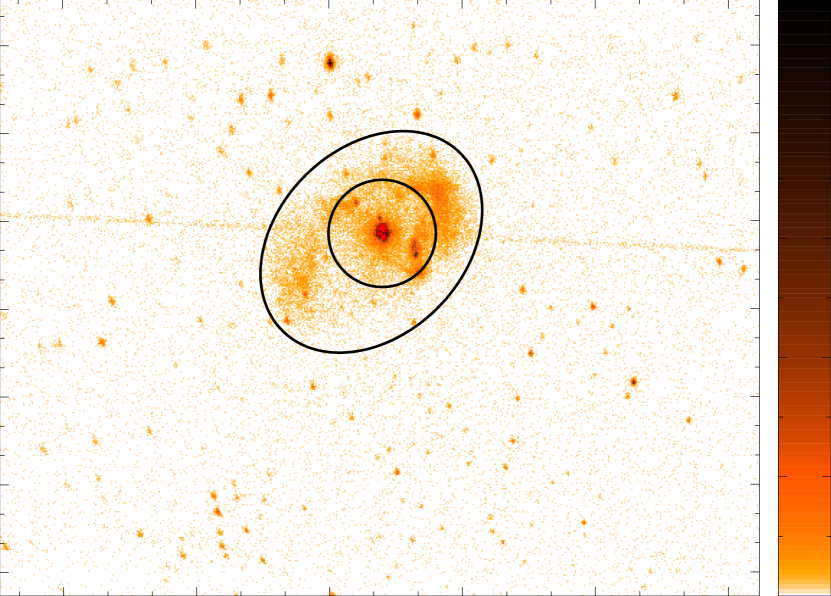
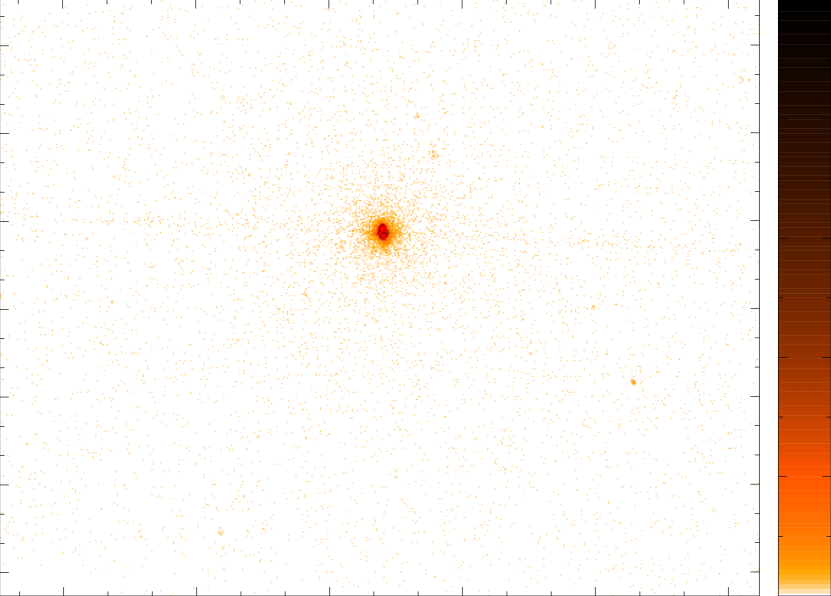
An 88.2 ks Chandra ACIS-I observation (obs ID 6402) of the Trumpler 16 region, taken in August 2006 was reprocessed using the most recent version of the calibration files. Data processing and reduction was performed using the Chandra CIAO (v4.3) software package and CALDB (v4.4.3). The data were unaffected by soft-proton flares and so the full observation time was available for analysis. Standard procedures were followed and images (count-maps) were created in two energy bands; 0.3 keV – 5 keV and 5 keV – 10 keV and are shown in Figure 1. The extended emission attributed to the expanding ejecta around Carinae can be seen clearly in the low-energy image. The high-energy image however is dominated by the bright point-like emission from Carinae itself. Several other low-significance sources are detected above 5 keV, see Leyder et al. (2010) for details.
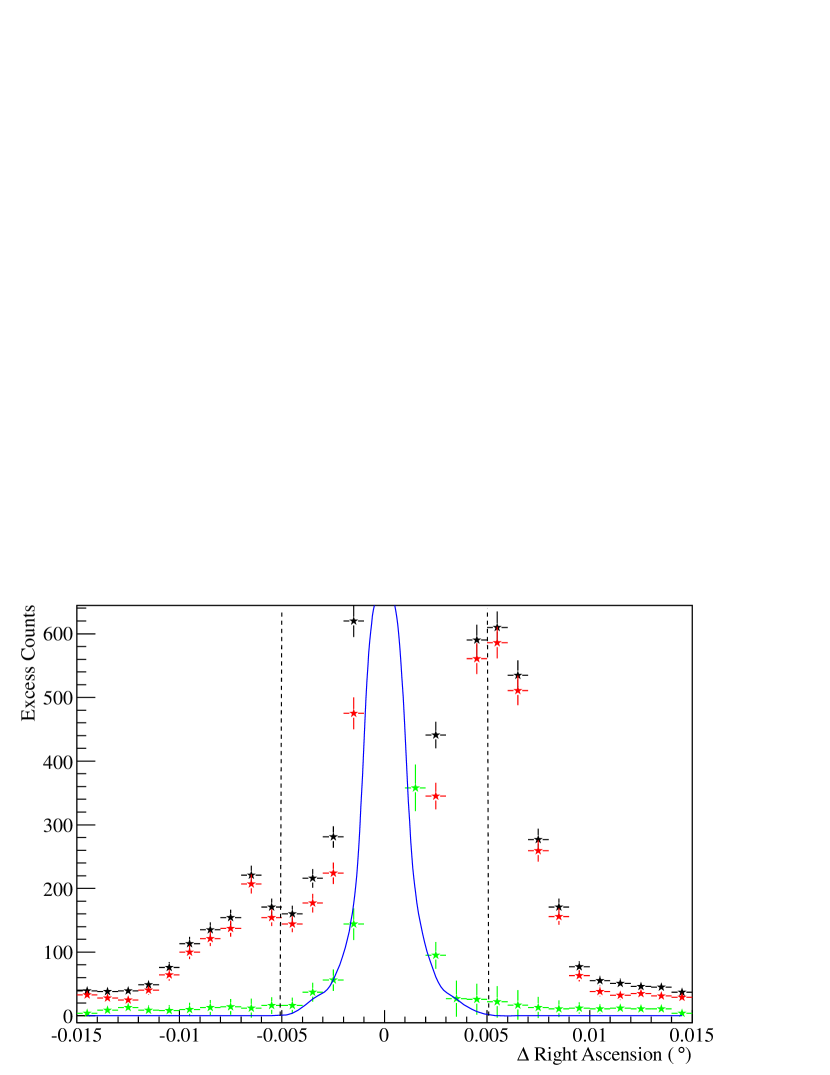
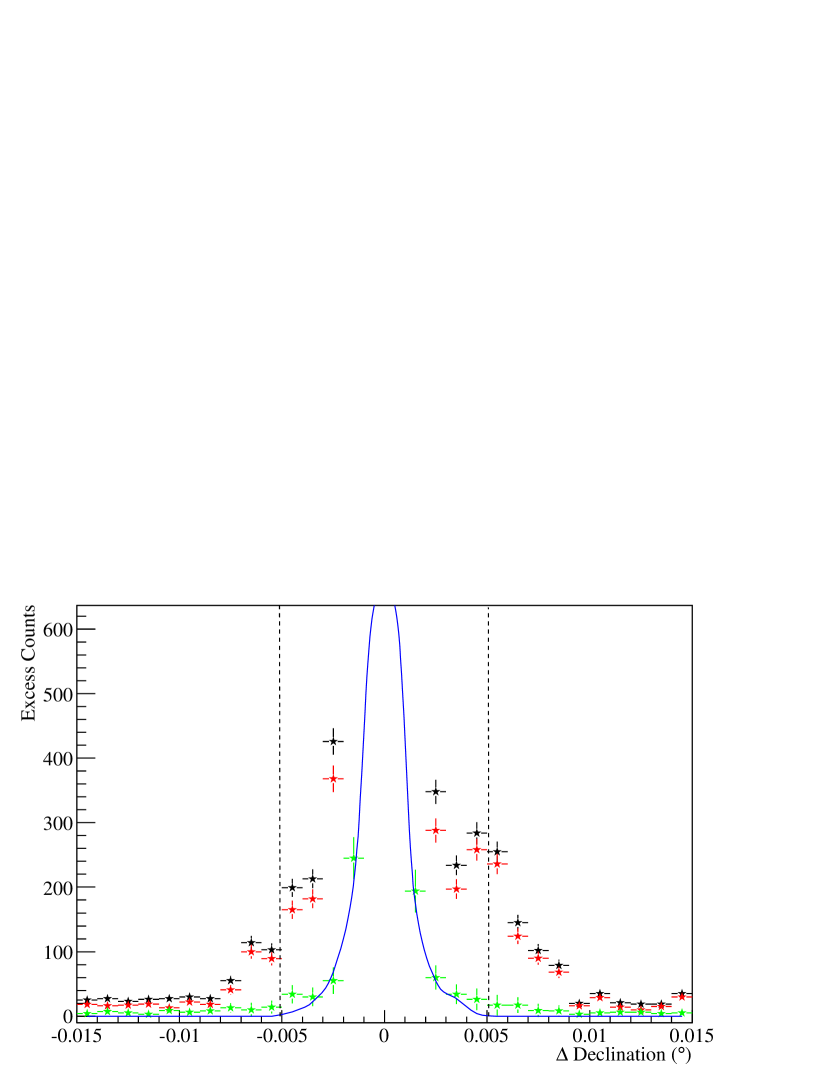
Slices in Right Ascension and Declination were made through the low and high energy images and through a simulated image of the Chandra-ACIS PSF (created at the same chip-location as Carinae in this observation). The slice regions were 7′′ wide and the projections are shown in Figure 2. It is clear to see that there is little emission above the PSF in the high energy map (green points) from the Carinae region.
The flux from the shell was estimated from the elliptical region shown in Figure 1. A circular region (also shown in Figure 1) centred on the position of Carinae with a radius of 0.305′ was excluded from the flux calculation. The background was estimated from a large elliptical region to the south west of the “on region”. All point sources were removed from the background region before extracting the flux. The background-subtracted flux from the shell in the 5-10 keV band was calculated to be 4.310-13erg cm-2s-1. No spectral analysis of the region has been attempted and so this value represents the upper limit on the non-thermal flux from the ejecta.
 |
 |
3 Fermi-LAT data
The hypothesis that particle acceleration is occurring in the expanding ejecta surrounding Carinae suggested by Ohm et al. (2010) was based on an analysis of the first 11 months of Fermi-LAT observations. More recent analyses of increased data sets are now available and are used here to constrain the model of Ohm et al. (2010).
An analysis including 21 months of Fermi-LAT data has been presented by Farnier et al. (2011). This analysis reveals two components of the HE emission; a low-energy part (hereafter L-component) which is best described by a power-law with spectral index and exponential cut-off at GeV, and a second, high-energy component (hereafter H-component) extending to GeV, best described by a pure power law with index . No temporal variability in either component is reported in Farnier et al. (2011). However, some variability in the H-component is reported by Walter & Farnier (2011). Farnier et al. (2011) have proposed that the Fermi-H component results from the interaction of accelerated protons and nuclei. This interpretation is attractive in the sense that accelerated protons can have a higher maximum acceleration energy and suffer less from losses than electrons. We follow this approach in this discussion attributing the two components to electrons (L-component) and protons (H-component) in the blast wave.
4 Origin of the HE -ray emission
The properties of the HE -ray emission from the region in and around Carinae are extremely challenging to interpret within the framework of any current model. In particular, for models in which the emission originates in the CWR, the lack of observed variability for the bulk of the emission is hard to reconcile with the dramatic changes seen at other wavelengths during periastron passage (see Damineli et al. 2008b, and references therein) and the very short cooling time of relativistic particles in the system (Farnier et al. 2011; Bednarek & Pabich 2011). The outer blast-wave scenario proposed in Ohm et al. (2010) provides a promising alternative in the sense that short timescale variability is not expected. However, the Chandra observations presented here place rather tight constraints on this scenario with important consequences for shock acceleration in systems of this type. Here we present these constraints and the refined model of the blast wave emission and discuss the more general implications of our results.
 |
 |
4.1 Improved Blast Wave Model
The single-zone, time-dependent numerical model used in Ohm et al. (2010) and described in detail in Hinton & Aharonian (2007) has been modified here such that the radiation field energy density of the Homunculus nebula, which had been assumed to be static is now modelled as a function of time. The Homunculus is illuminated from the inside by the star Carinae with the (bolometric) luminosity . This starlight is reprocessed by dust in the optically thick nebula into IR light. In the steady-state case, its own luminosity , but shifted to the IR band. Its thermal time scale, , is given by , with being the thermal energy of the Homunculus nebula. For a mass of the Homunculus nebula of and a temperature of 260 K (Gehrz & Smith 1999) is found to be about erg. Using erg s-1 (Cox et al. 1995) leads to a thermal timescale of the order of a few weeks. This value is much smaller than the age of the Homunculus nebula and therefore, assuming a steady flux from the star Carinae, a (pseudo-) steady state is a reasonable assumption. Any luminosity change of the star Carinae would hence be followed by a corresponding luminosity change of the Homunculus. The temperature of the radiation field at the location of the (expanding) ejecta is given by the Stefan Boltzmann law:
where, is the time-dependent radius of the Homunculus. Due to the mass of the expelled material follows free expansion with being the velocity of the ejecta of the Homunculus. Hence, the time dependent radiation field only depends on the evolution of the position of the blast wave with respect to Carinae, the luminosity of Carinae and the temperature of the radiation field. Based on the historical light curve of Humphreys et al. (1999), and the fact that the IR emission is simply reprocessed star-light, we assume that the integrated luminosity of the nebula in IR is linearly rising with Eta Car visible magnitude .
4.2 Application to the data
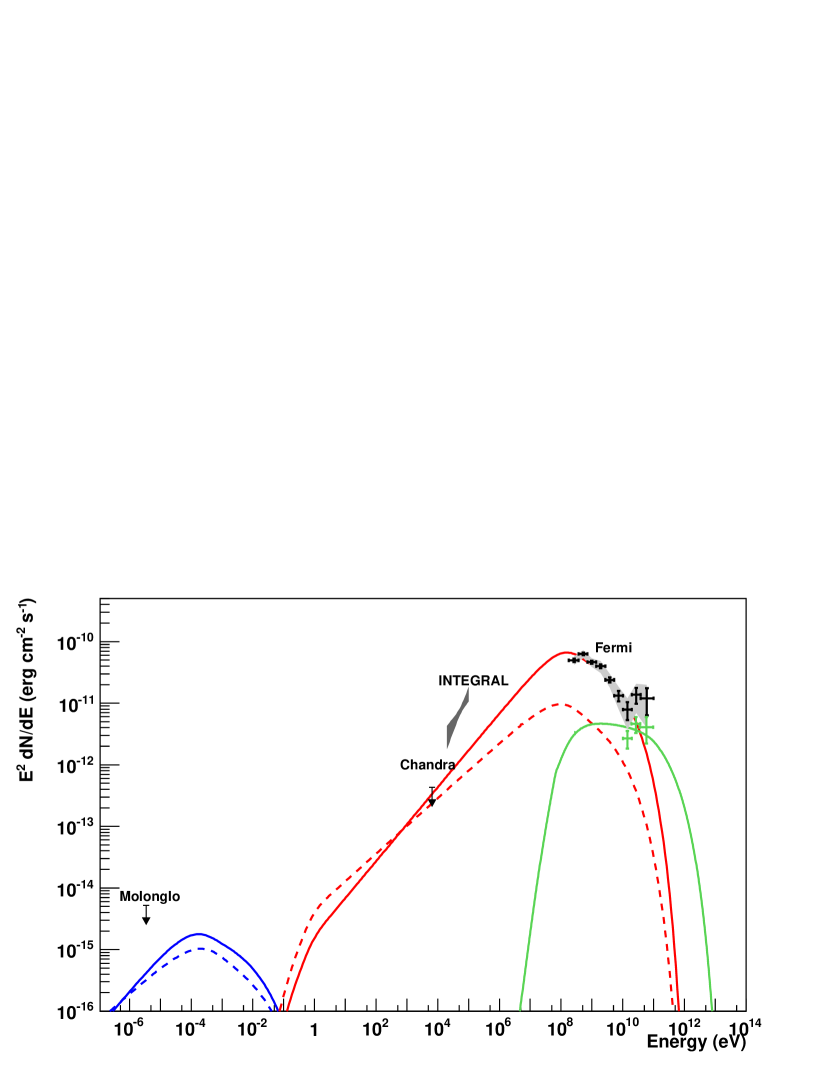
Fig. 3 shows the -ray spectral energy distribution which is produced by electrons accelerated in the blast wave and interacting with the time-dependent radiation field of the Homunculus nebula. The X-ray upper limits presented in this work restrict the model considerably. The spectral index of the accelerated electrons is constrained by the Chandra limit to be rather hard (). This value is much harder than the canonical value () expected from diffusive shock acceleration, but could be realised in very strong shocks or in shocks which are modified e.g. by the pressure of the accelerated particle population. Using a magnetic field strength of 10 G (as used in Ohm et al. 2010), the total energy in electrons for this model would be erg, representing only a very small fraction () of the total kinetic energy in the blast wave of erg which is in principle available for particle acceleration. For a slightly higher magnetic field strength of G, and a spectral index of , the energy in electrons has to be smaller than in order to agree with the X-ray limit. However, this would imply that the vast majority of the HE -ray emission does not originate in the blast wave. Given these findings, the fraction of energy in non-thermal electrons compared to the total kinetic energy in the blast wave is even lower compared to the model presented before. The association of the soft -ray emission detected by INTEGRAL from the Carinae region (Leyder et al. 2008) with the blast wave is problematic due to the sharp, low energy cutoff required for consistency with the Chandra limits presented both here and in Leyder et al. (2010). It seems likely that this hard X-ray emission is associated with the CWB as suggested by Leyder et al. (2010) rather than the blast wave.
Ohm et al. (2010) concluded that hadrons were less likely responsible for the single-component HE -ray emission revealed in the first 11 months of Fermi-LAT data. This conclusion was derived from two factors; the presence of HE emission at MeV (below the MeV threshold energy for production) and the fact that the maximum energy of protons as indicated by the curvature in the Fermi spectrum lay well below the expected maximum acceleration energy associated with either the age or size of the system. It has also been argued (Farnier et al. 2011; Bednarek & Pabich 2011) that the density of target material for pp interaction and subsequent -decay -ray production would be too low in the Carinae region.
The new Fermi-LAT data reveal the two-component nature of the HE emission, and present a good case that the H-component may be of hadronic origin (Walter & Farnier 2011). The variability detected in the H-component point to an origin of at least part of this H-component flux in the colliding wind region. However it is likely that some part of this H-component originates from protons accelerated in the blast wave surrounding Carinae. Such emission would be non-variable and would contribute to the total flux of the H-component. Scaling the total flux in the H-component down by a factor of three (representing the decrease in flux in the high-energy Fermi component found by Walter & Farnier 2011, see green data points in Fig. 3) and using the available target material density of cm-3 leads to the requirement of erg of energy in hadronic cosmic rays in the region. This represents % of the kinetic energy of the blast wave, given the uncertainties in the kinetic energy estimates in the blast wave of 4-10 x 1049 erg (Smith et al. 2003) – conditions that can reasonably be met.
5 Summary and conclusions
We have re-analysed archival Chandra data and placed limits on the non-thermal X-ray emission from the expanding ejecta surrounding Carinae. The single-zone numerical model of Ohm et al. (2010) has been adapted to account for the time-varying radiation field and to fit to recent Fermi-LAT HE -ray data. The two-component nature of the HE emission is best explained by electrons (L-component) and protons (H-component) respectively. An attempt to reconcile the new limit on the non-thermal X-ray emission from the shell with the Fermi L-component data leads to a rather hard electron injection index of 1.8. A steady hadronic emission component originating in the blast wave, at a flux level approximately one third of the total H-component, can be explained using reasonable numbers for the energy in cosmic rays, and the target density in the blast wave region and the maximum proton energy.
Acknowledgements
SO acknowledges the support of the Humboldt foundation by a Feodor-Lynen research fellowship.
References
- Abdo et al. (2010) Abdo, A. A., Ackermann, M., Ajello, M., et al. 2010, VizieR Online Data Catalog, 2188, 80405
- Abdo et al. (2009) Abdo, A. A., Ackermann, M., Ajello, M., et al. 2009, ApJS, 183, 46
- Bednarek & Pabich (2011) Bednarek, W. & Pabich, J. 2011, ArXiv e-prints 1104.1275
- Cox et al. (1995) Cox, P., Mezger, P. G., Sievers, A., et al. 1995, A&A, 297, 168
- Damineli et al. (2008a) Damineli, A., Hillier, D. J., Corcoran, M. F., et al. 2008a, MNRAS, 384, 1649
- Damineli et al. (2008b) Damineli, A., Hillier, D. J., Corcoran, M. F., et al. 2008b, MNRAS, 384, 1649
- Farnier et al. (2011) Farnier, C., Walter, R., & Leyder, J. 2011, A&A, 526, A57+
- Gehrz & Smith (1999) Gehrz, R. D. & Smith, N. 1999, in Astronomical Society of the Pacific Conference Series, Vol. 179, Eta Carinae at The Millennium, ed. J. A. Morse, R. M. Humphreys, & A. Damineli, 251
- Hinton & Aharonian (2007) Hinton, J. A. & Aharonian, F. A. 2007, ApJ, 657, 302
- Humphreys et al. (1999) Humphreys, R. M., Davidson, K., & Smith, N. 1999, PASP, 111, 1124
- Leyder et al. (2008) Leyder, J., Walter, R., & Rauw, G. 2008, A&A, 477, L29
- Leyder et al. (2010) Leyder, J., Walter, R., & Rauw, G. 2010, A&A, 524, A59+
- Nielsen et al. (2007) Nielsen, K. E., Corcoran, M. F., Gull, T. R., et al. 2007, ApJ, 660, 669
- Ohm et al. (2010) Ohm, S., Hinton, J. A., & Domainko, W. 2010, ApJ, 718, L161
- Parkin et al. (2009) Parkin, E. R., Pittard, J. M., Corcoran, M. F., Hamaguchi, K., & Stevens, I. R. 2009, MNRAS, 394, 1758
- Seward et al. (2001) Seward, F. D., Butt, Y. M., Karovska, M., et al. 2001, ApJ, 553, 832
- Smith (2008) Smith, N. 2008, Nature, 455, 201
- Smith et al. (2003) Smith, N., Gehrz, R. D., Hinz, P. M., et al. 2003, AJ, 125, 1458
- Tavani et al. (2009) Tavani, M., Sabatini, S., Pian, E., et al. 2009, ApJ, 698, L142
- Vink (2005) Vink, J. 2005, in AIPCS, Vol. 774, X-ray Diagnostics of Astrophysical Plasmas: Theory, Experiment, and Observation, ed. R. Smith, 241–251
- Vink et al. (2006) Vink, J., Bleeker, J., van der Heyden, K., et al. 2006, ApJ, 648, L33
- Walborn et al. (1978) Walborn, N. R., Blanco, B. M., & Thackeray, A. D. 1978, ApJ, 219, 498
- Walter & Farnier (2011) Walter, R. & Farnier, C. 2011, in ICRC proceedings