Discovery of the benchmark metal poor T8 dwarf BD+01 2920B
Abstract
We have searched the WISE first data release for widely separated (10,000AU) late T dwarf companions to Hipparcos and Gliese stars. We have discovered a new binary system containing a K-band suppressed T8p dwarf WISEP J1423+0116 and the mildly metal poor ([Fe/H]=0.380.06) primary BD+01 2920 (Hip 70319), a G1 dwarf at a distance of 17.2pc. This new benchmark has =68055K and a mass of . Its spectral properties are well modelled except for known discrepancies in the and bands. Based on the well determined metallicity of its companion, the properties of BD+01 2920B imply that the currently known T dwarfs are dominated by young low-mass objects. We also present an accurate proper motion for the T8.5 dwarf WISEP J075003.84+272544.8.
keywords:
surveys - stars: low-mass, brown dwarfs1 Introduction
An accurate understanding of the physics of ultra-cool atmospheres ( 2300K) is a major and ongoing challenge for theory (e.g. Allard et al. 1997). Complex molecular opacities (e.g. Barber et al. 2006), condensate clouds and their properties (e.g. Allard et al. 2001), and non-equilibrium chemistry (i.e. vertical transport or mixing; Saumon et al. 2007) are significant sources of uncertainty in the models. However, it is crucial to improve our understanding if we are to effectively measure the properties of substellar populations (brown dwarfs and giant planets) and study their formation and evolution (e.g. Bate et al. 2002; Goodwin & Whitworth 2007; Stamatellos et al. 2007; Sumi et al. 2011).
Building on the samples of L (2300K–1500K) and T dwarfs (1500K–500K) (Kirkpatrick 2005) identified in the Two-Micron All Sky Survey (Skrutskie et al. 2006), the DENIS survey (Epchtein et al. 1997) and the Sloan Digital Sky Survey (York et al. 2000), a new generation of infrared surveys is expanding our search-space into much greater volumes. The UKIRT Infrared Deep Sky Survey (UKIDSS; Lawrence et al. 2007) is sensitive to mid L – mid T dwarfs out to 100pc over 15% of the sky. The VISTA surveys (e.g. the Viking and VHS surveys) will expand this coverage to 50% of the sky in the next few years. For the latest T dwarfs (T8-9; e.g. Warren et al. 2007; Burningham et al. 2008; Delorme et al. 2008; Lucas et al. 2010; Burningham et al. 2011c) the sensitivities of these surveys are matched by those of the Wide-field Infrared Survey Explorer (WISE; Wright et al. 2010), probing to distances of 15–25pc. And for even lower temperatures (500K) an increased mid-/near-infrared flux ratio is allowing WISE to uncover the new Y dwarf class in the 300–500K range (Cushing et al. 2011). Together these surveys are characterising a rapidly growing population in the near- and mid-infrared (e.g. Lodieu et al. 2007; Pinfield et al. 2008; Burningham et al. 2010b; Reylé et al. 2010; Kirkpatrick et al. 2011).
With sensitivity to a growing field L-, T- and Y- dwarf search-space it is becoming feasible to search for multiple systems (e.g. Burningham et al. 2009a; Zhang et al. 2010; Burningham et al. 2010a; Day-Jones et al. 2011; Murray et al. 2011; Burningham et al. 2011a; Leggett et al. 2010c) or moving group associations (e.g. Clarke et al. 2010; Gálvez-Ortiz et al. 2010). The physical properties (mass, age and metallicity) of such objects can be constrained through association with more readily characterisable stellar companions or moving group members, establishing them as benchmark objects that can test the theory or more directly map physical properties onto spectral characteristics (e.g. Pinfield et al. 2006). Indeed, by searching for even rarer benchmarks with better physical constraints which span a more extreme range of properties, it will be possible to provide the strongest tests for the model atmospheres, a goal that absolutely requires sensitivity to large volumes.
In this paper we present a search of the WISE first data release for widely separated late T dwarf companions to stars with known parallaxes. Section 2 describes our WISE sample selection, and Section 3 the method used to identify candidate binary associations. Sections 4 and 5 present our spectroscopic and additional photometric data, and in Section 6 we derive candidate proper motions. Section 7 statistically assesses the expected level of false positives in our search, and Sections 8, 9 and 10 discuss the properties and characteristics of a newly discovered benchmark system. Conclusions and future work are in Section 11.
2 WISE sample
We identified candidate mid-T and later type objects in the WISE Preliminary Data Release source catalogue, which we accessed via the NASA/IPAC Infrared Science Archive’s catalogue query engine. We performed a series of all-sky searches using structured query language input to select sources with constraints on signal-to-noise and colour, and with detections in various combinations of bands chosen to optimise sensitivity to late T dwarfs. We always required a detection in the W2-band with signal-to-noise (SNR) of at least 10. If - and -band detections are available then we require 2.0 to select spectral types of T5 (Kirkpatrick et al. 2011; Mainzer et al. 2011). If - and -band detections are available then we require 2.5 in order to avoid dusty galaxies such as ULIRGS, LINERS and obscured AGN (Wright et al. 2010). As well as our WISE-band detection requirements we also made use of the WISE catalogue cross-match with the 2MASS point source catalogue, to divide our searches into objects that are detected in 2MASS (within 3 arcseconds of the WISE position) and those that are not. For 2MASS detected objects we required that either 2.5 or 3.5 so as to remove L and early T dwarfs. The full complement of searches and the number of sources identified in each is shown in Table 1.
The search requiring detection in only the -band will be the most sensitive to faint objects with red WISE colours since the WISE sensitivity limits (all-sky 5- Vega limits are =16.5, =15.5, =11.2, =7.9; Wright et al. 2010) mean that objects with 2 will generally only be detected in for =14.5-15.5 (i.e. at least 75% of the survey volume). The other multi-band combinations cover the full range of detection/non-detection combinations that might be expected for T dwarfs.
For comparison, the recent large-scale WISE search made by Kirkpatrick et al. (2011) overlaps significantly with our search-space. However, they use a slightly bluer 1.5 selection, and where we require SNR10 in the -band they require at least 8 separate detections (SNR3) in the individual exposures.
| WISE detection? | Colours | Selected | Candidate | Selected | Candidate | |||
| sourcesd | companionsd,e | sourcesf | companionsf | |||||
| nb | Yc | n | n | - | 2418 | 12(3) | 289 | 0 |
| Y | Y | n | n | 2.0 | 5622 | 35(1) | 1330 | 0 |
| Y | Y | Y | n | 2.0 | 1721 | 9(1) | 283 | 0 |
| 2.5 | ||||||||
| Y | Y | Y | Y | 2.0 | 1018 | 2 | 1642 | 0 |
| 2.5 | ||||||||
| n | Y | Y | n | 2.5 | 174 | 0 | 54 | 0 |
| n | Y | Y | Y | 2.5 | 272 | 0 | 54 | 0 |
| a signal-to-noise always 10 (w2snr10). | ||||||||
| b Non-detections defined as (wmpro is null or wsigmpro is null). | ||||||||
| c Detections defined as (wmpro is not null and wsigmpro is not null). | ||||||||
| d 2MASS non detections (tmasskey is null). | ||||||||
| e The numbers in brackets are for candidates that passed visual inspection. | ||||||||
| f 2MASS detections with 2.5 or 3.5. | ||||||||
3 Identifying candidate binary systems
To identify candidate binary systems we cross-matched our candidate late-T sample with a list of potential primary stars with measured parallax distances, and imposed separation constraints on the potential binary pairings as well as absolute magnitude constraints on the candidate T dwarfs (where we assumed a common distance for components). The list of potential primary stars was made by combining together the latest Hipparcos catalogue (van Leeuwen 2007) with the most recent version of the catalogue of nearby stars (Gliese & Jahreiss 1991). Hipparcos provides astrometric measurements (in position, parallax, and annual proper motion) with uncertainties in the range 0.7-0.9 milliarcsec (mas) for stars brighter than =9. The catalogue is on the ICRS reference system and has proper motions consistent with an inertial system at the level of 0.25mas/yr. The Third Catalogue of Nearby Stars (CNS3) contains information on all known stars within 25 parsecs based on an extensive literature search during almost four decades.
We required on-sky angular separation of candidate pairs to be 300 arcseconds to reduce contamination from random alignments, and physical separation of 10,000AU (where we use the distance of the primary to convert angular separation into a physical line-of-sight separation), since the great majority of known wide ultracool stellar companions have separations below this limit (e.g. Zhang et al. 2010; Faherty et al. 2010). In addition we use the known distance of each candidate primary to estimate the that the T dwarf candidate would have at this distance, and reject any associations where the T dwarf candidate would have 11.5 (i.e. targeting late T dwarf companions, e.g. Fig 4 of Leggett et al. 2010a, where is a good proxy for ). The candidate T dwarf components of the possible binary systems are distributed within our WISE source selections as summarised in Table 1. These T dwarf candidates were visually inspected using the WISE image server at the NASA/IPAC Infrared Science Archive, and candidates rejected if the source did not appear point-like in any of the bands, formed part of a blended structure, or was clearly an artefact (e.g. part of a diffraction spike).
Five candidate binary systems passed visual inspection. One -only detected candidate remains an unconfirmed interesting candidate without any additional survey data (e.g. UKIDSS, VISTA) to facilitate proper motion measurements. The other 4 are listed below:
- •
-
•
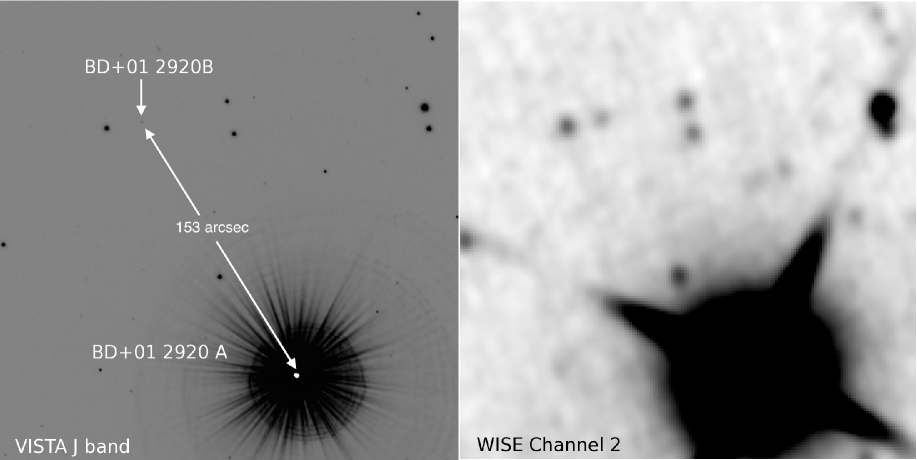
WISEP J142320.86+011638.1 (WISEP J1423+0116) is a -only detected candidate 153 arcseconds from the star Hip 70319 (BD+01 2920), a G1V star at 17.2pc. It was not identified by Kirkpatrick et al. (2011) because it is only detected in 7 separate exposures in the WISE Preliminary Data Release. This T dwarf is the main subject of this paper.
-
•
WISEP J145715.85-212207.6 is a detected candidate near the system Gl 570ABC (Hip 73182 and Hip 73184), a K4V+M1.5V+M3V triple system. This candidate is a known (discovered in 2MASS) T8 member of the multiple system (Burgasser et al. 2000). The WISE catalogue does not list the source as a 2MASS detection because its high proper motion leads to the WISE and 2MASS positions being separated by more than 3 arcseconds.
- •
Figure 1 shows - (VISTA) and -band images for WISEP J1423+0116, and indicates its separation from the nearby high proper motion star Hip 70319 (BD+01 2920).
4 Spectroscopy
Near-infrared spectroscopy of WISEP J1423+0116 (BDB; see Section 7) was obtained using the Gemini Near InfraRed Spectrograph (GNIRS; Elias et al. 2006) mounted on the Gemini-North telescope on the night of 16th May 2011. The target was observed in cross-dispersed mode capturing the full 0.8–2.5 region with a 1.0 slit delivering a resolving power of R. The data were reduced using GNIRS routines in the Gemini IRAF package (Cooke & Rodgers 2005), using the nearby F5V star Hip 63976 for telluric correction. The telluric standard spectrum was divided by a black-body spectrum of an appropriate after removing hydrogen lines by interpolating the local continuum. The rectified standard spectrum was then used to correct for telluric absorption and to provide relative flux calibration. The overlap regions between the orders in the , and bands agreed well suggesting that the relative flux of the orders is well calibrated. The resulting spectra are shown in Figure 2.
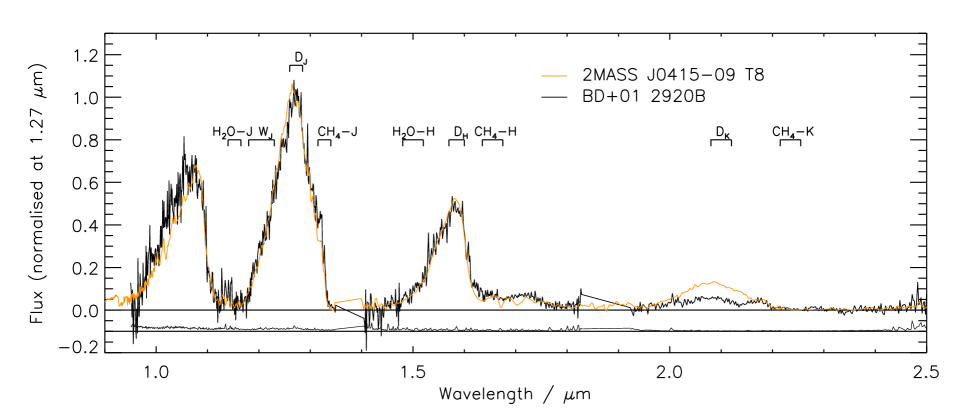
In Figure 2 we compare our GNIRS spectrum of the new T8 with that of the T8 spectral template 2MASS J04151954-0935066 from Burgasser et al. (2006b). The close similarity of the spectra over most of the wavelength range argues strongly for T8 classification, which is reflected in the values found for the spectral typing flux ratios (see Table 2). Although the new T8 closely traces the T8 template over the range, it displays a considerably more depressed -band flux, which is interpreted as due to strong collisionally induced absorption by H2 (CIA H2; Saumon et al. 1994). Increased CIA H2 is typically attributed to higher pressure atmospheres arising from lower-metallicity and/or high-gravity (e.g. Burgasser et al. 2002; Knapp et al. 2004; Liu et al. 2007). For this reason we assign the type T8p to WISEP J1423+0116, where the ’p’ suffix denotes it is peculiar, alluding to the poor match with the template in the band.
5 New photometry
Database photometry of WISEP J1423+0116 was obtained from the WISE Preliminary Data Release catalogue, the WFCAM Science Archive (UKIDSS Large Area Survey) and the VISTA Science Archive (VIKING proprietary data access). In addition, observations were taken at the Telescopio Nazionale Galileo (tng) and with the Spitzer Space Telescope in its warm phase.
Near-infrared photometry was measured using the Near Infrared Camera Spectrometer (nics; Baffa et al. 2001) at the 3.58-m optical/infrared tng located on La Palma, on the night of the 7th of May 2011 for the H band and the night of the 10th of June 2011 for the Y band. The data were obtained in large field mode, with a pixel scale of 0.25 arcsec/pixels and a field of view of 4.24.2 arcmins. The data were processed using the nics science pipeline snap provided by the tng. -band observations consisted of a 50 point jitter pattern with individual 10s exposures and 6 co-adds per jitter point, accumulating to a total exposure time of 50 minutes. In the -band a 10 point jitter was used for the same exposure time and co-adds, resulting in a total exposure time of 10 minutes. We calibrated each image onto the mko system using 30 field stars in the frame.
Warm-Spitzer photometric data were obtained for WISEP J1423+0116 on the 21st August 2011, via the Cycle 7 GO program 70058. Individual frame times were 30 s repeated six times, with a 16-position spiral dither pattern, for a total integration time of 48 min in each of the and bands. The post-basic-calibrated-data mosaics generated by version 18.18.0 of the Spitzer pipeline were used to obtain aperture photometry. The photometry was derived using a 7-arcsec aperture and the aperture correction was taken from the IRAC handbook. The error is estimated by the larger of either the variation with the sky aperture or the error implied by the uncertainty images.
Tables 3 and 4 contain the available photometry and colours, respectively, for the T dwarf. We present WISE photometry where the signal-to-noise is positive and note that the and magnitudes are brightness upper limits. The near infrared photometry is on the Mauna-Kea Observatory system (Leggett et al. 2006) except for the TNG -filter, which is slightly different (=1.02, FWHM=0.13) to the MKO filter (=1.02, FWHM=0.10). In the absence of a measured -band magnitude we have determined a synthetic colour using our GNIRS spectra and a spectrum of Vega (Bohlin & Gilliland 2004) both convolved with the response functions for the pass-bands (e.g. Hewett et al. 2006). This synthetic colour (see Table 4) combined with the -band magnitude produced our band estimate. For the mid infrared photometry we note that while similar to and , the Spitzer [3.6] and [4.5] bands have some significant differences (see Fig 2 of Mainzer et al. 2011). There are multiple measurements of -, - and -band photometry, though no evidence of variability is seen (to within the uncertainties) in the photometric brightness.
| Source | (snr) or | (snr) or | (snr) | |||||
| WISE | 17.75(1.5)b | 14.760.09(11.8) | 12.21(0.8)b | - | ||||
| UKIDSS LAS | 19.510.14 | 18.760.12 | ||||||
| VISTA VIKING | 19.690.05 | 18.710.05 | ||||||
| TNG | 19.750.22 | 19.140.20 | ||||||
| Synthetic Estimate | (18.960.15) | (19.890.33) | ||||||
| Spitzer | 16.770.03 | 14.710.01 | ||||||
| a Photometry is on the MKO system except for the TNG filter (see text). | ||||||||
| b 95% confidence brightness upper limit. | ||||||||
| 0.980.07 | -0.380.23 | -0.930.36a | -1.270.34a | 2.77b | 2.55b | 3.950.10c | 4.380.22 | 2.060.03 | 4.430.20 |
|---|---|---|---|---|---|---|---|---|---|
| a Synthetic photometry (see text). | |||||||||
| b 95% confidence limit. | |||||||||
| c Using the higher signal-to-noise VISTA -band magnitude. | |||||||||
6 Proper motions
We measured the proper motion of WISEP J1423+0116 using a VISTA VIKING image of April 2010 and two UKIDSS images from May 2008 (with lower signal-to-noise of 6). This avoids using the larger point-spread-functions inherent in the WISE images (6.5 arcsecs in ). The base-line between the two near infrared epochs was 1.89 years. We took the measured x,y coordinates from the standard CASU pipeline reductions of all images and using 59 objects within 4 arcminutes of the target, transformed the UKIDSS frames onto the standard coordinate system of the VIKING frame using a simple linear model. The relative proper motion for all objects were found from linear fits to the standard coordinates at the different epochs. A correction to an absolute system was estimated from the median difference between measured relative proper motions and 6 SDSS objects in the field with proper motions in the catalog of Munn et al. (2004). The derived proper motion for WISEP J1423+0116 was corrected for an assumed parallax of 50mas (see Section 7), and final uncertainties are based on the formal uncertainties of the measured coordinates combined with an additional allowance for the centroiding accuracy in the low signal-to-noise LAS image (0.5 pixels estimated using Monte Carlo techniques) leading to a proper motion uncertainty of 50 mas/yr. The proper motion of WISEP J1423+0116 is mas yr-1, mas yr-1, which is within 0.7 of the Hipparcos proper motion vector of Hip 70319 (BD+01 2920; mas yr-1, mas yr-1). These objects are thus a common proper motion pair.
We also measured the proper motion of WISEP J075003.84+272544.8 using two UKIDSS LAS J-band epochs with a baseline of 2 years. We applied a second order polynomial transformation between the two epoch images to correct for any non-uniformity in the focal plane. Seventeen reference stars (18.1) were used, distributed around the target (with at least 3 per quadrant) with separations within 2 arcminutes. A correction was applied to an absolute system using apparent proper motions of nearby galaxies. The uncertainties were calculated using the standard deviations in the RA/Dec residuals of sources deemed to have insignificant motion ( 45 milli-arcseconds) between epochs. The proper motion of WISEP J075003.84+272544.8 is mas yr-1, mas yr-1. By comparison, Kirkpatrick et al. (2011) used astrometric fits to multiple WISE observations to derive a proper motion (mas yr-1, mas yr-1) with much larger uncertainties. Their value of is consistent with our new measurement, however their value of is too large at the level of 2. Although there also happens to be a nearby Hipparcos star (Hip 38228), it has a low proper motion (mas yr-1, mas yr-1) and the T dwarf is not a common proper motion companion since its motion differs at a level 28.
7 Confirming binarity
To estimate the probability that WISEP J1423+0116 and BD+01 2920 may be a line-of-sight association as opposed to a genuine binary, we have performed a statistical analysis to estimate the expected number of chance alignments in our search. We used the Burningham et al. (2010b) luminosity function constraints to estimate the number of T6-9 dwarfs expected in the WISE first data release. In a sample with 15 (akin to our signal-to-noise requirement) we expect to detect T71 and T9 dwarfs out to distances () of 25 and 15pc respectively, in the 57% sky coverage of the WISE first release. We adjusted the Burningham luminosity function to add back in the correction made for unresolved binarity (3-45%), since this removed T dwarfs from their magnitude limited samples, and estimate an expected 28-251 T71 dwarfs and 26-111 T9 dwarfs in the WISE selection using this luminosity function. We then summed the volume in which line-of-sight associated stars may be found using a set of cones (one per T dwarf) each with its apex at the observer and a T dwarf in the centre of it’s base (using a base radius of 10,000AU to match our search criteria). Since the number of T dwarfs is proportional to D3 and the volume of a cone is proportional to D (where D is distance), the average cone volume will be of the maximum cone volume (where is the base area of a cone ). The total cone volume for T6–9 dwarfs was thus estimated to be 2.0–14.6pc3.
The luminosity function of Reid et al. (2007) for the 8pc and 20pc samples leads to a stellar density of 0.062–0.076 stars pc-3, and we thus expect 0.12–1.11 light-of-sight associations between stars and T dwarfs in our WISE selection. Amongst our five candidates we find that one of them (WISEP J075003.84+272544.8) is in fact a line-of-sight association with a lack of common proper motion. This is consistent with our estimates above. An additional candidate was identified without proper motion, though the above statistic does not provide any further indications on the likelihood that this candidate may be genuine.
We must also assess these common proper motion systems for the chance that common proper motions are aligned by random chance. Using the proper motion and direction of WISEP J1423+0116 we estimated this probability using a Hipparcos sample, downloading the proper motions of Hipparcos stars within 45 degrees of the WISEP J1423+0116/BD+01 2920 pair, and with distances from 10–40pc (the photometric distance range of a T81 dwarf with 18.7 allowing for possible unresolved binarity). We counted the fraction of stars with proper motion within 55mas yr-1 (1) of the T dwarf motion, and thus estimate a chance of 1.3% that this high proper motion pair could be common proper motion by random chance. We therefore expect no more than 0.0015–0.014 false positive common proper motion systems in the search that we have made, and conclude that all three of the common proper motion systems that we identified are genuine binaries. This includes the two previously reported systems and the association between WISEP J1423+0116 and BD+01 2920, which becomes the binary system BD+01 2920AB.
8 Properties of BD+01 2920A
A search of the literature reveals multiple studies of the primary star BD+01 2920A. It is a nearby high proper motion G1 dwarf (0.9M⊙) with thin disk kinematics. There is no evidence of any debris disk or low-mass companions (including giant planets), and it has low activity. BD+01 2920A is a mildly metal poor star, with a metallicity in the metal poor tail of the disk distribution rather than in the halo regime. With one exception previous estimates of [Fe/H] are in the range -0.380.06 (only Lebreton et al. 1999, gives a slightly higher metallicity of -0.20 dex). The range of age constraints covers 2.3–14.4 Gyr. This differs slightly from the range quoted by Lawler et al. (2009) who give a lower limit of 3.5 Gyr. The difference is due to the estimate of 2.27 Gyr from do Nascimento et al. (2010), and we here adopt an inclusive age range. The properties of BD+01 2920A are summarised in Table 5 and references therein.
| BD+01 2920A (Hip 70319) | |
|---|---|
| R.A. (J2000) | 14 23 15.285 |
| Dec (J2000) | +01 14 29.65 |
| PMαcosDec | mas/yr |
| PMDec | mas/yr |
| Spectral type/class | G1V |
| 58.20.5 mas (1) | |
| Distance | 17.20.2 pc |
| 1.180.03 | |
| Vr | 19.6 0.3 km/s(2-4) |
| Space motion | UVW = 22, 15, 39 (5-8) |
| Population | Thin disk (9,10) |
| 5750 100 K (3,7,8,11-21) | |
| 4.45 0.05 dex (3,7,12,16-18,20-24) | |
| Mass | 0.87 0.07 M⊙ (3,13,23) |
| Fe/H | -0.38 0.06 dex (3,6-8,10,12,14-18,20-29) |
| Age | 2.3 – 14.4 Gyr (3,5,8,10,12,13,15,23,26,30-32) |
| v | 1–2 km/s (3,12,13) |
| Activity | Low activity star (33) |
| Debris disk | None (15) |
| Close in companions | No 70-75MJup at 20-250AU (34) |
| No giant planets | |
| (100m/s) at 5AU (24,35-39) | |
| 1 van Leeuwen (2007), 2 Gontcharov (2006), 3 Valenti & Fischer (2005) | |
| 4 Latham et al. (2002), 5 Holmberg et al. (2009), 6 Ramírez et al. (2007) | |
| 7 Mishenina et al. (2004), 8 Nordström et al. (2004), 9 Borkova & Marsakov (2004) | |
| 10 Ibukiyama & Arimoto (2002), 11 Casagrande et al. (2010), 12 Takeda et al. (2010) | |
| 13 do Nascimento et al. (2010), 14 Holmberg et al. (2007), 15 Lawler et al. (2009) | |
| 16 Luck & Heiter (2006), 17 Shi et al. (2004), 18 Mashonkina et al. (2007) | |
| 19 Kovtyukh et al. (2003), 20 Giridhar & Goswami (2002), 21 Cayrel de Strobel et al. (2001) | |
| 22 Wu et al. (2011), 23 Takeda et al. (2007b), 24 Heiter & Luck (2003) | |
| 25 Mashonkina & Gehren (2001), 26 Rocha-Pinto & Maciel (1998), 27 Karataş et al. (2005) | |
| 28 Borkova & Marsakov (2005), 29 Haywood (2001), 30 Wright et al. (2004) | |
| 31 Barry (1988), 32 Takeda et al. (2007a), 33 Hall et al. (2007) 34 Carson et al. (2009) | |
| 35 Halbwachs et al. (2003), 36 Halbwachs et al. (2000), 37 Cumming et al. (1999) | |
| 38 Endl et al. (2002), 39 Nidever et al. (2002) | |
9 Properties of BD+01 2920B
9.1 Bolometric flux
We estimate the bolometric flux () of the new T8p companion BD+01 2920B following a similar method to that outlined in Burningham et al. (2009a), by combining our spectrum (flux calibrated by our follow-up photometry) with model spectra (to allow us to estimate the flux contributions from regions outside our near-infrared spectral coverage). We have scaled the region of the models to match the flux level in our spectrum, and we have used the Spitzer 3.6 and 4.5 photometry to scale the and regions respectively (the transmission profiles of the Spitzer filters cross at 3.95 at a transmission level of 1%). To avoid biasing our derived flux estimate with our choice of model, we have produced estimates using Solar and [M/H] metallicity BT Settl models (Allard et al. 2011) that bracket the likely range of gravities and for our target (; K). We take the scatter in the estimates resulting from different model choices as a reflection of the systematic uncertainty introduced by the atmospheric models. We have used a Monte Carlo method to determine the uncertainty in each estimate due to the noise in the photometry used for scaling the models and the noise in our GNIRS spectrum. Our final estimate of is the median of our estimates using different model extensions, whilst the uncertainty is the sum in quadrature of the systematic uncertainty and the mean random uncertainty. This results in a determination of Wm-2.
9.2 Luminosity, mass, radius, and effective temperature
The luminosity of BD+01 2920B was derived from the bolometric flux and the distance. The on-sky separation of the BD+01 2920AB components leads to a tangential separation of 0.01 pc. This is negligible compared with the uncertainty in the parallax distance of the primary (0.2 pc) and we can therefore assume that the T dwarf is at the same distance as BD+01 2920A (17.20.2 pc). Taking the uncertainties associated with the bolometric flux and distance into account leads to the determination of W, or . To determine the of BD+01 2920B we estimate its radius using the COND evolutionary models (Baraffe et al. 2003). These models reproduce the main trends of observed methane dwarfs in near-infrared color-magnitude diagrams, though are only available for solar metallicity.
We used linear interpolation between the model isochrones to estimate a range of possible mass, radii and surface gravity for BD+01 2920B consistent with an age range of 2–10 Gyr. Accounting for the uncertainties in the measured luminosity we obtained a mass range of 0.019–0.047 M⊙ ( MJup), a radius range 0.0800.099 R⊙ (0.80–0.99 RJup), and a surface gravity range of . The corresponding temperature (from luminosity and radius) is K. A summary of the properties of BD+01 2920B is given in Table 6.
| BD+01 2920B (WISEP 1423+0116) | |
|---|---|
| R.A. (J2000) | 14 23 20.86 |
| Dec (J2000) | +01 16 38.1 |
| PMαcosDec | mas yr-1 |
| PMDec | mas yr-1 |
| Spectral type | T8p |
| Separation | 153 arcsecs |
| 2630 AU a | |
| (1.610.17)10-16 W b | |
| 1.180.02a | |
| 18.510.04 a | |
| 17.530.05 a | |
| 17.960.20 a | |
| 18.710.33 a,c | |
| 15.590.04 a | |
| 13.530.02 a | |
| 5.83 0.05 a | |
| 0.38 0.06 dex d | |
| Mass | 0.019–0.047 M⊙ e |
| 20-50 MJup e | |
| Radius | 0.080–0.099 R⊙ e |
| 0.80–0.99 RJup e | |
| 4.68–5.30 dex e | |
| 68055 K f | |
| a Inferring a distance of 17.20.2pc from BD+01 2920A. | |
| b Integrating measured flux from and adding a | |
| theoretical correction at other wavelengths (see text). | |
| c Synthetic photometry used (see text). | |
| d Inferred from BD+01 2920A. | |
| e Constraints derived from structure models as a function of | |
| luminosity for ages 2–10 Gyr. | |
| f Derived from the luminosity and radius constraints. | |
Observations of transiting very low-mass stars and brown dwarfs with mass20 MJup (Pont et al. 2005b, a; Deleuil et al. 2008; Bouchy et al. 2011b; Anderson et al. 2011; Johnson et al. 2011) are all consistent with the COND mass-radius model data (see fig 10 of Bouchy et al. 2011a). These systems are solar metallicity to within the uncertainties, though some of these uncertainties are significant. The effects of metallicity on sub-stellar radii are a little unclear. Burrows et al. (2011) present evolutionary models with a spread in radius (at a given mass and age) of 10–25%, with higher-metallicity (higher-cloud-thickness) atmospheres giving larger radii. However, a comparison between KOI-423b and CoRoT-3b suggests the converse trend. KOI-423b orbits a metal poor star ([Fe/H]=0.10) and is a relatively large (1.22) brown dwarf (18 MJup), whereas CoRoT-3 is a solar metallicity star ([Fe/H]=-0.020.06) hosting a smaller (1.010.07RJup) brown dwarf (22MJup). Given this uncertainty in the radius-metallicity trend, we do not attempt to make a metallicity correction to our radius estimate. We note however that our COND radius constraint already includes an uncertainty at the level of 25%, comparable with the size of the theoretical trends suggested by the Burrows et al. (2011) models for a metallicity difference of 1.0 dex.
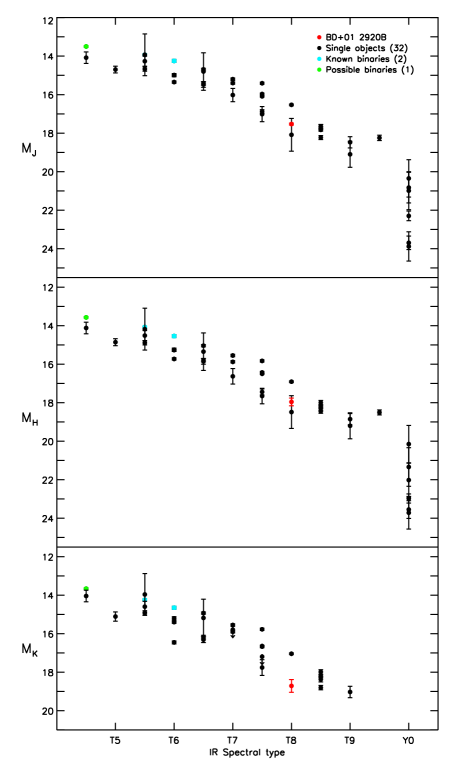
As an additional caveat we note that our determination relies on an assumption that the object is single, and not an unresolved binary. Unresolved binarity would lead to lower for each unresolved component. If BD+01 2920B is an equal luminosity unresolved binary the of each component would be a factor 0.8 less ( with similar radii for the components). For unequal luminosity components the brighter component would be closer to 680K with the fainter one 540K. Observations suggest (e.g. Burgasser et al. 2005) that the binary fraction of brown dwarfs (resolved at 0.1 arcsec resolution) in widely separated stellar – brown dwarf multiples is notably higher (4515 per cent) than that of field brown dwarfs (187 per cent), and unresolved binaries can also have separation closer than 0.1 arcseconds (see Burningham et al. 2009a, and references therein). In Figure 3 we show BD+01 2920B in absolute magnitude () spectral type diagrams, along with the known population of late T and Y dwarfs (see caption). The -band suppression is evident in the plot, though we also note that there is no clear indication that the object is an unresolved binary (e.g. with components of near equal brightness) in the and plots. We cannot with high confidence however, rule out the possibility that BD+01 2920B is an unresolved binary.
10 A metal poor benchmark T8 dwarf
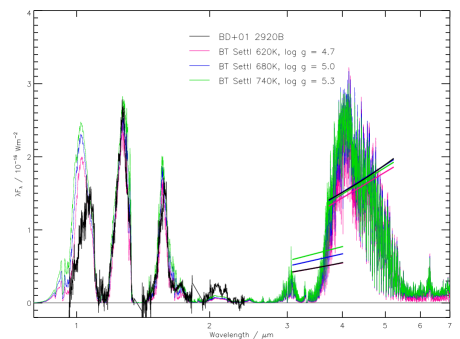
We now assess some implications of this benchmark system under the assumption that it is a single object, and through comparison of its spectrum and colours to theoretical predictions and other ultra-cool objects. In Figure 4 we compare our flux calibrated GNIRS spectrum of BDB and warm-Spitzer photometry to mildly metal poor BT Settl models (Allard et al. 2010) for our derived properties, each scaled to their corresponding radii and the known distance to the primary star. The BT Settl atmospheric model grid spans the cool stellar to substellar temperature regime using the BT2 water line-list (Barber et al. 2006) and the reference Solar abundances of Asplund et al. (2009). In these models dust formation, cloud behaviour and vertical mixing are parameterised with reference to the 2D radiation hydrodynamic simulations of Freytag et al. (2010). The band suppression that is predicted by the models for high-gravity and metal poorer brown dwarfs is seen in our GNIRS spectrum of this benchmark T dwarf, although the models predict this effect to be stronger than is seen in this case. Similarly poor matches to the observed band spectroscopy have been seen in other benchmark systems (e.g. Burningham et al. 2009b, 2011b), so it is reasonable to interpret this as a deficiency in the model atmospheres, although its origin is not yet understood. It is noteworthy that the band spectrum which has also been proposed as diagnostic of metallicity variations (Burgasser et al. 2006a) is also poorly matched by the models. The model atmospheres provide good matches to the flux in the and bands, despite known deficiencies in the methane line lists in these regions. The model predictions for the [3.6] and [4.5] fluxes are consistent with those that we have observed, and it interesting to note that in the [3.6] band, the 620K, , model fits the data best, whilst in the [4.5] band the two warmer models provide the best match.
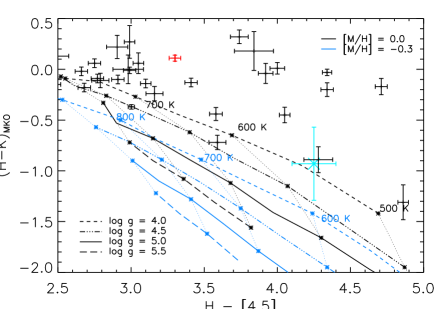
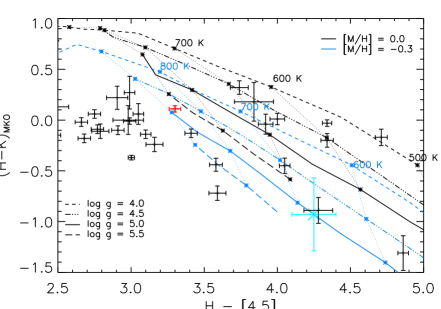
In Figure 5 we have plotted synthetic colours in and for the BT Settl models along with colours of late T dwarfs from Leggett et al. (2010b) with MKO and IRAC photometry, and BDB. It can be seen that BD+01 2920B lies in a similar region as other suspected mildly metal-poor T7.5/8 dwarfs 2MASS0939 and SDSS1416B, which have Teff 500-700K (e.g. Burningham et al. 2010a; Leggett et al. 2010a). The effect of the poor match between the models and the data in the band is highlighted by the non-coincidence of the models and the observations in this colour space for the T dwarfs with the reddest colours. However, the models correctly predict the colours for the young benchmark Ross 458C. To provide an alternative comparison between the models and the data we have shifted the model colours such that they match the observed colours for BDB for the parameters derived in Section 9. Figure 6 compares these adjusted model colours to the same T dwarfs shown in Figure 5. This plot broadly reproduces the result of Leggett et al. (2010b), where it was noted that the majority of the coolest T dwarfs appear to have low-gravity and/or high-metallicity, suggesting that the sample is dominated by young low-mass brown dwarfs (ages Gyr). However, we note that the sources with bluer lie well below the adjusted model tracks in Figure 6, including the young benchmark Ross 458C (for which ; Burningham et al. 2011a), which highlights that a simple offset correction to the models is not sufficient to allow the properties of the T dwarf population to be reliably assessed through reference to these model colours. The similar temperature of these two benchmarks (K), but wide separation in Figures 5 and 6 highlights the important roles that gravity and metallicity play in determining the colours for cool T dwarfs.
11 Conclusions and future work
Our cross-match between the WISE first data release and the Hipparcos and Gliese catalogues has resulted in the discovery of a new late T binary companion (BDB) and the re-discovery of two previously known systems. WISE (in combination with UKIDSS and VISTA) is thus effectively probing an increased volume of very low temperature parameter-space for benchmark companions. There are also significant advantages that the primary star BDA is a nearby G dwarf rather than one of the more numerous M dwarfs in the solar neighbourhood, and its lower metallicity provides a crucial test for the effects of reduced metal content on models atmospheres. The metallicities and abundances of bright Sun-like stars can be studied with much more confidence and in much greater detail than those of M dwarfs, and late T dwarfs in such systems offer the opportunity not only to test cool brown dwarf atmosphere physics, but also to potentially study brown dwarf abundances.
In the near future, high resolution imaging (e.g. adaptive optics) observations of BDB will be important to constrain multiplicity on a 0.1 arcsec (1.7AU) separation scale. A close binary would be able to provide future dynamical masses (since the orbital period would be just a few years). Higher resolution spectroscopy would also be able to assess multiplicity at closer separation, and confirmation of a single object nature would validate the approach taken here to determination the physical properties of this benchmark object. The existing constraints on the physical properties of BDB will be improved as we develop a better understanding of how brown dwarf radii depend on composition. This will be aided by an increasing number of transiting brown dwarfs from Kepler and other transit surveys (e.g. Borucki et al. 2011; Pinfield et al. 2005), and improved metallicity measurements for this sample.
We can expect additional late T benchmarks in the future all-sky WISE data release, and a more encompassing search of WISE, UKIDSS and VISTA (including at wider angular separations) should yield an expanded population of benchmarks across the full T dwarf range. As greater survey volumes are searched for benchmark brown dwarfs we can also expect to identify systems with more accurately known ages. Evolved subgiants for example are less numerous that their main sequence counterparts, but evolutionary model comparisons can provide more accurate age constraints (e.g. 10%; Pinfield et al. 2006). And as the range of well measured benchmarks expands into greater parameter-space we will have the opportunity to comprehensively test the atmosphere models by directly mapping the benchmark population’s spectral variations/trends onto a grid of tightly constrained physical properties.
Acknowledgments
This publication makes use of data products from the Wide-field Infrared Survey Explorer, which is a joint project of the University of California, Los Angeles, and the Jet Propulsion Laboratory/California Institute of Technology, funded by the National Aeronautics and Space Administration. The UKIDSS project is defined in Lawrence et al. (2007). UKIDSS uses the UKIRT WFCAM (Casali et al. 2007) and a photometric system described in Hewett et al. (2006). The pipeline processing and science archive are described in Irwin et al. (2004) and Hambly et al. (2008). Based on observations obtained at the Gemini Observatory, which is operated by the Association of Universities for Research in Astronomy, Inc., under a cooperative agreement with the NSF on behalf of the Gemini partnership: the National Science Foundation (United States), the Science and Technology Facilities Council (United Kingdom), the National Research Council (Canada), CONICYT (Chile), the Australian Research Council (Australia), Ministério da Ciência, Tecnologia e Inovação (Brazil) and Ministerio de Ciencia, Tecnología e Innovación Productiva (Argentina). This work made use of data obtained on Gemini projects GN-2011A-Q-73. Based in part on observations made for the VIKING survey, using VISTA at the ESO Paranal Observatory under programme ID 179.A-2004. The VISTA Data Flow System pipeline processing and science archive are described in Irwin et al (2004) and Hambly et al (2008). Based on observations made with the Italian Telescopio Nazionale Galileo (A22TAC96) operated on the island of La Palma by the Fundación Galileo Galilei of the INAF (Istituto Nazionale di Astrofisica) at the Spanish Observatorio del Roque de los Muchachos of the Instituto de Astrofisica de Canarias. DP, NL, PL, MCG and ZZ have received support from RoPACS during this research and JG is supported by RoPACS, a Marie Curie Initial Training Network funded by the European Commission’s Seventh Framework Programme. NL is funded by the national program AYA2010-19136 funded by the Spanish ministry of science and innovation. SKL is supported by the Gemini Observatory, which is operated by AURA, on behalf of the international Gemini partnership of Argentina, Australia, Brazil, Canada, Chile, the United Kingdom, and the United States of America. ADJ is supported by a Fondecyt Postdoctorado under project number 3100098. JSJ is supported by a Fondecyt Postdoctorado under project number 3110004 and partial support from Centro de Astrofísica FONDAP 15010003, the GEMINI-CONICYT FUND and from the Comité Mixto ESO-GOBIERNO DE CHILE. This research has made use of the SIMBAD database, operated at CDS, Strasbourg, France.
References
- Allard et al. (1997) Allard F., Hauschildt P. H., Alexander D. R., Starrfield S., 1997, ARA&A, 35, 137
- Allard et al. (2001) Allard F., Hauschildt P. H., Alexander D. R., Tamanai A., Schweitzer A., 2001, ApJ, 556, 357
- Allard et al. (2010) Allard F., Homeier D., Freytag B., 2010, ArXiv e-prints
- Allard et al. (2011) Allard F., Homeier D., Freytag B., 2011, PTRSA, accepted
- Anderson et al. (2011) Anderson D. R. et al., 2011, ApJ, 726, L19
- Asplund et al. (2009) Asplund M., Grevesse N., Sauval A. J., Scott P., 2009, ARA&A, 47, 481
- Baffa et al. (2001) Baffa C. et al., 2001, A&A, 378, 722
- Baraffe et al. (2003) Baraffe I., Chabrier G., Barman T. S., Allard F., Hauschildt P. H., 2003, A&A, 402, 701
- Barber et al. (2006) Barber R. J., Tennyson J., Harris G. J., Tolchenov R. N., 2006, MNRAS, 368, 1087
- Barry (1988) Barry D. C., 1988, ApJ, 334, 436
- Bate et al. (2002) Bate M. R., Bonnell I. A., Bromm V., 2002, MNRAS, 332, L65
- Bohlin & Gilliland (2004) Bohlin R. C., Gilliland R. L., 2004, AJ, 127, 3508
- Borkova & Marsakov (2004) Borkova T. V., Marsakov V. A., 2004, Astronomy Letters, 30, 148
- Borkova & Marsakov (2005) Borkova T. V., Marsakov V. A., 2005, Astronomy Reports, 49, 405
- Borucki et al. (2011) Borucki W. J. et al., 2011, ApJ, 736, 19
- Bouchy et al. (2011a) Bouchy F. et al., 2011a, A&A, 533, A83
- Bouchy et al. (2011b) Bouchy F. et al., 2011b, A&A, 525, A68
- Burgasser et al. (2006a) Burgasser A. J., Burrows A., Kirkpatrick J. D., 2006a, ApJ, 639, 1095
- Burgasser et al. (2006b) Burgasser A. J., Geballe T. R., Leggett S. K., Kirkpatrick J. D., Golimowski D. A., 2006b, ApJ, 637, 1067
- Burgasser et al. (2002) Burgasser A. J. et al., 2002, ApJ, 564, 421
- Burgasser et al. (2000) Burgasser A. J. et al., 2000, ApJ, 531, L57
- Burgasser et al. (2005) Burgasser A. J., Kirkpatrick J. D., Lowrance P. J., 2005, AJ, 129, 2849
- Burningham et al. (2011a) Burningham B. et al., 2011a, MNRAS, 414, 3590
- Burningham et al. (2011b) Burningham B. et al., 2011b, MNRAS, 414, 3590
- Burningham et al. (2010a) Burningham B. et al., 2010a, MNRAS, 404, 1952
- Burningham et al. (2011c) Burningham B. et al., 2011c, MNRAS, 414, L90
- Burningham et al. (2008) Burningham B. et al., 2008, MNRAS, 391, 320
- Burningham et al. (2009a) Burningham B. et al., 2009a, MNRAS, 395, 1237
- Burningham et al. (2009b) Burningham B. et al., 2009b, MNRAS, 395, 1237
- Burningham et al. (2010b) Burningham B. et al., 2010b, MNRAS, 406, 1885
- Burrows et al. (2011) Burrows A., Heng K., Nampaisarn T., 2011, ApJ, 736, 47
- Carson et al. (2009) Carson J. C., Hiner K. D., Villar, III G. G., Blaschak M. G., Rudolph A. L., Stapelfeldt K. R., 2009, AJ, 137, 218
- Casagrande et al. (2010) Casagrande L., Ramírez I., Meléndez J., Bessell M., Asplund M., 2010, A&A, 512, A54
- Cayrel de Strobel et al. (2001) Cayrel de Strobel G., Soubiran C., Ralite N., 2001, A&A, 373, 159
- Clarke et al. (2010) Clarke J. R. A. et al., 2010, MNRAS, 402, 575
- Cooke & Rodgers (2005) Cooke A., Rodgers B., 2005, in Astronomical Society of the Pacific Conference Series, Vol. 347, Astronomical Data Analysis Software and Systems XIV, P. Shopbell, M. Britton, & R. Ebert, ed., pp. 514–+
- Cumming et al. (1999) Cumming A., Marcy G. W., Butler R. P., 1999, ApJ, 526, 890
- Cushing et al. (2011) Cushing M. C. et al., 2011, ArXiv e-prints
- Day-Jones et al. (2011) Day-Jones A. C. et al., 2011, MNRAS, 410, 705
- Deleuil et al. (2008) Deleuil M. et al., 2008, A&A, 491, 889
- Delorme et al. (2008) Delorme P. et al., 2008, A&A, 482, 961
- do Nascimento et al. (2010) do Nascimento J. D., da Costa J. S., de Medeiros J. R., 2010, A&A, 519, A101
- Elias et al. (2006) Elias J. H., Joyce R. R., Liang M., Muller G. P., Hileman E. A., George J. R., 2006, in Presented at the Society of Photo-Optical Instrumentation Engineers (SPIE) Conference, Vol. 6269, Society of Photo-Optical Instrumentation Engineers (SPIE) Conference Series
- Endl et al. (2002) Endl M., Kürster M., Els S., Hatzes A. P., Cochran W. D., Dennerl K., Döbereiner S., 2002, A&A, 392, 671
- Epchtein et al. (1997) Epchtein N. et al., 1997, The Messenger, 87, 27
- Faherty et al. (2010) Faherty J. K., Burgasser A. J., West A. A., Bochanski J. J., Cruz K. L., Shara M. M., Walter F. M., 2010, AJ, 139, 176
- Freytag et al. (2010) Freytag B., Allard F., Ludwig H., Homeier D., Steffen M., 2010, A&A, 513, A19+
- Gálvez-Ortiz et al. (2010) Gálvez-Ortiz M. C. et al., 2010, MNRAS, 409, 552
- Giridhar & Goswami (2002) Giridhar S., Goswami A., 2002, Bulletin of the Astronomical Society of India, 30, 501
- Gliese & Jahreiss (1991) Gliese W., Jahreiss H., 1991, NASA STI/Recon Technical Report A, 923, 33932
- Gontcharov (2006) Gontcharov G. A., 2006, Astronomy Letters, 32, 759
- Goodwin & Whitworth (2007) Goodwin S. P., Whitworth A., 2007, A&A, 466, 943
- Halbwachs et al. (2000) Halbwachs J. L., Arenou F., Mayor M., Udry S., Queloz D., 2000, A&A, 355, 581
- Halbwachs et al. (2003) Halbwachs J. L., Mayor M., Udry S., Arenou F., 2003, A&A, 397, 159
- Hall et al. (2007) Hall J. C., Lockwood G. W., Skiff B. A., 2007, AJ, 133, 862
- Haywood (2001) Haywood M., 2001, MNRAS, 325, 1365
- Heiter & Luck (2003) Heiter U., Luck R. E., 2003, AJ, 126, 2015
- Hewett et al. (2006) Hewett P. C., Warren S. J., Leggett S. K., Hodgkin S. T., 2006, MNRAS, 367, 454
- Holmberg et al. (2007) Holmberg J., Nordström B., Andersen J., 2007, A&A, 475, 519
- Holmberg et al. (2009) Holmberg J., Nordström B., Andersen J., 2009, A&A, 501, 941
- Ibukiyama & Arimoto (2002) Ibukiyama A., Arimoto N., 2002, A&A, 394, 927
- Johnson et al. (2011) Johnson J. A. et al., 2011, ApJ, 730, 79
- Karataş et al. (2005) Karataş Y., Bilir S., Schuster W. J., 2005, MNRAS, 360, 1345
- Kirkpatrick (2005) Kirkpatrick J. D., 2005, ARA&A, 43, 195
- Kirkpatrick et al. (2011) Kirkpatrick J. D. et al., 2011, ArXiv e-prints
- Knapp et al. (2004) Knapp G. R. et al., 2004, AJ, 127, 3553
- Kovtyukh et al. (2003) Kovtyukh V. V., Soubiran C., Belik S. I., Gorlova N. I., 2003, A&A, 411, 559
- Latham et al. (2002) Latham D. W., Stefanik R. P., Torres G., Davis R. J., Mazeh T., Carney B. W., Laird J. B., Morse J. A., 2002, AJ, 124, 1144
- Lawler et al. (2009) Lawler S. M. et al., 2009, ApJ, 705, 89
- Lawrence et al. (2007) Lawrence A. et al., 2007, MNRAS, 379, 1599
- Lebreton et al. (1999) Lebreton Y., Perrin M.-N., Cayrel R., Baglin A., Fernandes J., 1999, A&A, 350, 587
- Leggett et al. (2010a) Leggett S. K. et al., 2010a, ApJ, 710, 1627
- Leggett et al. (2010b) Leggett S. K. et al., 2010b, ApJ, 710, 1627
- Leggett et al. (2006) Leggett S. K. et al., 2006, MNRAS, 373, 781
- Leggett et al. (2010c) Leggett S. K., Saumon D., Burningham B., Cushing M. C., Marley M. S., Pinfield D. J., 2010c, ApJ, 720, 252
- Liu et al. (2007) Liu M. C., Leggett S. K., Chiu K., 2007, ApJ, 660, 1507
- Lodieu et al. (2007) Lodieu N. et al., 2007, MNRAS, 379, 1423
- Lucas et al. (2010) Lucas P. W. et al., 2010, MNRAS, 408, L56
- Luck & Heiter (2006) Luck R. E., Heiter U., 2006, AJ, 131, 3069
- Mainzer et al. (2011) Mainzer A. et al., 2011, ApJ, 726, 30
- Mashonkina & Gehren (2001) Mashonkina L., Gehren T., 2001, A&A, 376, 232
- Mashonkina et al. (2007) Mashonkina L., Korn A. J., Przybilla N., 2007, A&A, 461, 261
- Mishenina et al. (2004) Mishenina T. V., Soubiran C., Kovtyukh V. V., Korotin S. A., 2004, A&A, 418, 551
- Munn et al. (2004) Munn J. A. et al., 2004, AJ, 127, 3034
- Murray et al. (2011) Murray D. N. et al., 2011, MNRAS, 414, 575
- Nidever et al. (2002) Nidever D. L., Marcy G. W., Butler R. P., Fischer D. A., Vogt S. S., 2002, ApJS, 141, 503
- Nordström et al. (2004) Nordström B. et al., 2004, A&A, 418, 989
- Pinfield et al. (2008) Pinfield D. J. et al., 2008, MNRAS, 390, 304
- Pinfield et al. (2006) Pinfield D. J., Jones H. R. A., Lucas P. W., Kendall T. R., Folkes S. L., Day-Jones A. C., Chappelle R. J., Steele I. A., 2006, MNRAS, 368, 1281
- Pinfield et al. (2005) Pinfield D. J., Jones H. R. A., Steele I. A., 2005, PASP, 117, 173
- Pont et al. (2005a) Pont F., Bouchy F., Melo C., Santos N. C., Mayor M., Queloz D., Udry S., 2005a, A&A, 438, 1123
- Pont et al. (2005b) Pont F., Melo C. H. F., Bouchy F., Udry S., Queloz D., Mayor M., Santos N. C., 2005b, A&A, 433, L21
- Ramírez et al. (2007) Ramírez I., Allende Prieto C., Lambert D. L., 2007, A&A, 465, 271
- Reid et al. (2007) Reid I. N., Cruz K. L., Allen P. R., 2007, AJ, 133, 2825
- Reylé et al. (2010) Reylé C. et al., 2010, A&A, 522, A112
- Rocha-Pinto & Maciel (1998) Rocha-Pinto H. J., Maciel W. J., 1998, MNRAS, 298, 332
- Saumon et al. (1994) Saumon D., Bergeron P., Lunine J. I., Hubbard W. B., Burrows A., 1994, ApJ, 424, 333
- Saumon et al. (2007) Saumon D. et al., 2007, ApJ, 656, 1136
- Scholz (2010) Scholz R.-D., 2010, A&A, 515, A92
- Shi et al. (2004) Shi J. R., Gehren T., Zhao G., 2004, A&A, 423, 683
- Skrutskie et al. (2006) Skrutskie M. F. et al., 2006, AJ, 131, 1163
- Stamatellos et al. (2007) Stamatellos D., Hubber D. A., Whitworth A. P., 2007, MNRAS, 382, L30
- Sumi et al. (2011) Sumi T. et al., 2011, Nature, 473, 349
- Takeda et al. (2007a) Takeda G., Ford E. B., Sills A., Rasio F. A., Fischer D. A., Valenti J. A., 2007a, ApJS, 168, 297
- Takeda et al. (2010) Takeda Y., Honda S., Kawanomoto S., Ando H., Sakurai T., 2010, A&A, 515, A93
- Takeda et al. (2007b) Takeda Y., Kawanomoto S., Honda S., Ando H., Sakurai T., 2007b, A&A, 468, 663
- Valenti & Fischer (2005) Valenti J. A., Fischer D. A., 2005, ApJS, 159, 141
- van Leeuwen (2007) van Leeuwen F., 2007, A&A, 474, 653
- Warren et al. (2007) Warren S. J. et al., 2007, MNRAS, 381, 1400
- Wright et al. (2010) Wright E. L. et al., 2010, AJ, 140, 1868
- Wright et al. (2004) Wright J. T., Marcy G. W., Butler R. P., Vogt S. S., 2004, ApJS, 152, 261
- Wu et al. (2011) Wu Y., Singh H. P., Prugniel P., Gupta R., Koleva M., 2011, A&A, 525, A71
- York et al. (2000) York D. G. et al., 2000, AJ, 120, 1579
- Zhang et al. (2010) Zhang Z. H. et al., 2010, MNRAS, 404, 1817