Human behavior in Prisoner’s Dilemma experiments suppresses network reciprocity
Abstract
During the last few years, much research has been devoted to strategic interactions on complex networks. In this context, the Prisoner’s Dilemma has become a paradigmatic model, and it has been established that imitative evolutionary dynamics lead to very different outcomes depending on the details of the network. We here report that when one takes into account the real behavior of people observed in the experiments, both at the mean-field level and on utterly different networks the observed level of cooperation is the same. We thus show that when human subjects interact in an heterogeneous mix including cooperators, defectors and moody conditional cooperators, the structure of the population does not promote or inhibit cooperation with respect to a well mixed population.
pacs:
87.23.Kg, 89.65.-s, 89.75.-k, 64.60.AqIn recent years, the physics of complex systems has widened its scope by considering interacting many-particle models where the interaction goes beyond the usual concept of force. One such line of research that has proven particularly interesting is evolutionary game theory on graphs Szabó and Fáth (2007); Roca et al. (2009a), in which interaction between agents is given by a game while their own state is described by a strategy subject to an evolutionary process Hofbauer and Sigmund (1998); Gintis (2009). A game that has attracted a lot of attention in this respect is the Prisoner’s Dilemma (PD) Rapoport and Guyer (1966); Axelrod (1984), a model of a situation in which cooperative actions lead to the best outcome in social terms, but where free riders or non-cooperative individuals can benefit the most individually. In mathematical terms, this is described by a payoff matrix (entries correspond to the row player’s payoffs and C and D are respectively the cooperative and non-cooperative actions)
|
(1) |
with (temptation to free-ride) and (detriment in cooperating when the other does not).
In a pioneering work, Nowak and May Nowak and May (1992) showed that the behavior observed in a repeated Prisoner’s Dilemma was dramatically different on a lattice than in a mean-field approach: Indeed, on a lattice the cooperative strategy was able to prevail by forming clusters of alike agents who outcompeted defection. Subsequently, the problem was considered in literally hundreds of papers Szabó and Fáth (2007), and very many differences between structured and well-mixed (mean-field) populations were identified, although by no means they were always in favor of cooperation Hauert and Doebeli (2004); Sysi-Aho et al. (2005). In fact, it has been recently realized that this problem is very sensitive to the details of the system Roca et al. (2009a, b), in particular to the type of evolutionary dynamics Hofbauer and Sigmund (2003) considered. For this reason experimental input is needed in order to reach a sound conclusion about what has been referred to as ‘network reciprocity’.
In this Letter, we show that using the outcome from the experimental evidence to inform theoretical models, the behavior of agents playing a PD is the same at the mean field level and in very different networks. To this end, instead of considering some ad hoc imitative dynamics Nowak and May (1992); Helbing (1992); Szabó and Töke (1998), our players will play according to the strategy recently uncovered by Grujić et al. Grujić et al. (2010) in the largest experiment reported to date about the repeated spatial PD, carried out on a lattice as in Nowak and May’s paper Nowak and May (1992) with parameters and .
The results of the experiment were novel in several respects. First, the population of players exhibited a rather low level of cooperation (fraction of cooperative actions in every round of the game in the steady state), hereafter denoted by . Most important, however, was the unraveling of the structure of the strategies. The analysis of the actions taken by the players showed a heterogeneous population consisting of “mostly defectors” (defected with probability larger than 0.8), a few “mostly cooperators” (cooperated with probability larger than 0.8), and a majority of so-called moody conditional cooperators. This last group consisted of players that switched from cooperation to defection with probability and from defection to cooperation with probability , being the fraction of cooperative actions in player ’s neighborhood in the previous iteration. Conditional cooperation, i.e., the dependency of the chosen strategy on the amount of cooperation received, had been reported earlier in related experiments Fischbacher et al. (2001) and observed also for the spatial repeated PD at a smaller scale Traulsen et al. (2010). The new ingredient revealed in Grujić et al.’s experiment Grujić et al. (2010) was the dependence of the behavior on the own player’s previous action, hence the reason to call them “moody”. Recent experiments about the multiplayer repeated PD confirm this observation Grujic et al. (2011).
To study how the newly unveiled rules influence the emergence of cooperation in an structured population of individuals, we first report results from numerical simulations of a system made up of individuals who play a repeated PD game according to the experimental observations. To this end, we explored the average level of cooperation in four different network configurations: a well-mixed population in which the probability that a player interacts with any other one is the same for all players, a square lattice, an Erdös-Renyi (ER) graph and a Barabási-Albert (BA) scale-free (SF) network. It is worth mentioning that the dependence on the payoff matrix only enters through the parameters describing the players’ behavior (, , , and the fractions of the three types of players). Once these parameters are fixed the payoffs do not enter anywhere in the evolution, as this is only determined by the variables , the local fractions of cooperative actions within each player’s neighborhood. Thus there is no possibility to explore the dependence on the payoffs because we lack a connection between them and the behavioral parameters.
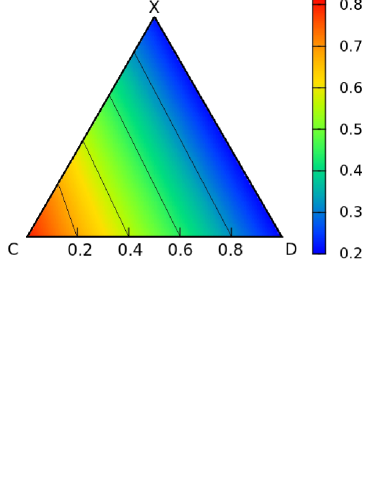
In Fig. 1 we present our most striking result. The figure represents, in a color-coded scale, the average level of cooperation as a function of the fraction of mostly cooperators, , and mostly defectors, , for a BA network of contacts. The same plots but for the rest of topologies explored (lattice and ER graphs) produce indistinguishable results with respect to those shown in the figure. We therefore conclude that the average level of cooperation in the system does not depend on the underlying structure. This means that, under the assumption that the players follow the behavior of the experiment in Grujic et al. (2011), there is no network reciprocity, i.e., no matter what the network of contacts looks like, the observed level of cooperation is the same. This latter finding is in stark contrast to most previous results coming out from numerical simulations of models in which many different updating rules —all of them based upon the relative payoffs obtained by the players— have been explored.
The previous numerical findings can be recovered using a simple mean-field approach to the problem. Let the fractions of the three types of players be , and , for mostly cooperators, mostly defectors, and moody conditional cooperators, respectively, with the obvious constraint . Denoting by the cooperation probability at time for strategy of the repeated PD we have
| (2) |
where and are known constants [in our case , ]. The probability of cooperation for conditional players in the next time step can be obtained as
| (3) |
where the first term in the right hand side considers the probability that a conditional cooperator keeps playing as a cooperator, whereas the second terms stands for the situation in which a moody conditional cooperator switched from defection to cooperation. Asymptotically
From Eq. (3),
| (4) |
thus (2) implies (with the replacement )
| (5) |
where
| (6) |
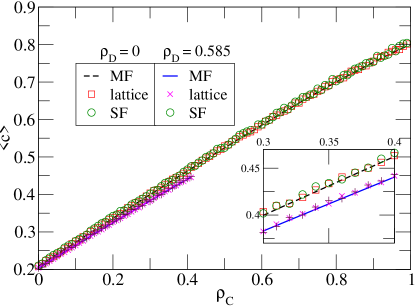
are functions of . From Eq. (5) it follows that the curves of constant are straight lines in the simplex. Figure 1 clearly demonstrates this fact: The straight lines are plots of Eq. (5) for different values of . It can be seen that they are parallel to the color stripes, and that the values of they correspond to accurately fit those of the simulations. Figure 2 depicts the curve vs. for two different values of , as obtained from Eq. (5) and compared to simulations. This figure illustrates the excellent quantitative agreement between the mean-field result and the simulation results. The match between the analytical and numerical results is remarkable, as it is the fact that the result does not depend on the underlying topology. This is the ultimate consequence of the lack of network reciprocity: the cooperation level on any network can be accurately modeled as if individuals were playing in a well-mixed population.
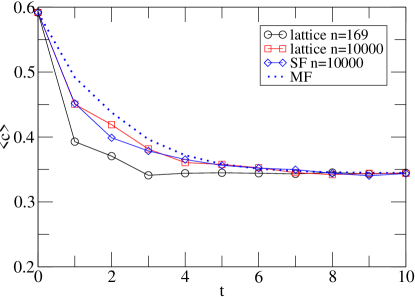
The steady state is reached after a rather short transient, as illustrated by Figure 3. This figure compares the approach of the cooperation level to its stationary state as obtained iterating Eq. (3) and from numerical simulations on different networks with different sizes. The initial cooperation level has been set to , close to the value observed in the experiment of Ref. Grujić et al. (2010). The transient does exhibit a weak dependence on the underlying topology and specially on the network size, but for the largest simulated size () the curves are all very close to the mean-field prediction.
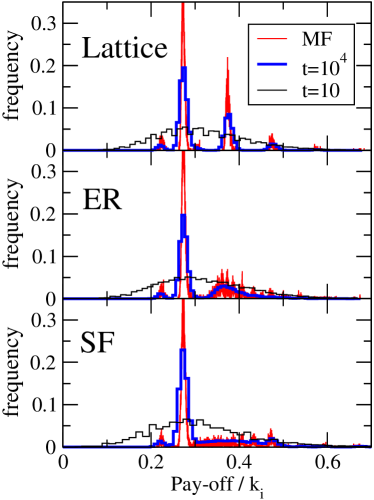
The only observable on which the topology does have a strong effect is the payoff distribution among players. Figure 4 shows these distributions for the three studied topologies, and at two different times —short and long. Smooth at short times, this distribution peaks around certain values at long times. This reflects the fact that payoffs depend on the number of neighbors of different types around a given player, which yields a finite set of values for the payoffs (the centers of the peaks). These numbers occur with different probabilities (determining the height of the peaks), according to the distribution
| (7) |
where is the degree distribution of the network and , but it is understood that . The standard convention is assumed that the multinomial coefficient whenever , or .
The approach to a stationary distribution of payoffs exhibits a much longer transient. This is due to the fluctuations in the payoffs arising from the specific actions (cooperate or defect) taken by the players. These fluctuations damp out as the accumulated payoffs approach their asymptotic values. Thus, the peak widths shrink proportionally to . In fact, one can show that the probability density for the distribution of payoffs for strategy can be approximated as
| (8) |
where , the mean payoff per neighbor received by a strategist against a cooperator is
with , and the average cooperation level in the neighborhood of the focal player and its variance are
The approximate total payoff distribution, , is compared in Fig. 4 with the results of the simulations for the longest time.
Summarizing, in this work we have shown both analytically and through numerical simulations that if we take into account the way in which humans are experimentally found to behave when facing social dilemmas on lattices, no evidence of network reciprocity is obtained. In particular, we have argued that if the players of a Prisoners’ Dilemma adopt an update rule that only depends on what they see from their neighborhood, then cooperation drops to a low level —albeit nonzero— irrespective of the underlying network. Moreover, we have shown that the average level of cooperation obtained from simulations is very well predicted by a mean-field model, and it is found to depend only on the fractions of different strategists. Additionally, we have also shown that the underlying network of contacts does manifest itself in the distribution of payoffs obtained by the players, and has a slight influence on the transient behavior.
To conclude, it is worth mentioning that our results only make sense when applied to evolutionary game models aimed at mimicking human behavior in social dilemmas. The independence on the topology seems to reflect the fact that humans update their actions according to a rule that ignores relative payoffs. Interestingly, absence of network reciprocity has also been observed in numerical simulations using best response dynamics roca2009 , an update rule widely used in economics that does not take into account the neighbors’s payoffs. This suggests that the result that networks do not play any role in the repeated PD may be general for any dynamics that does not take neighbors’ payoffs into account. We want to stress that the same kind of models thought of in a strict biological context are ruled by completely different mechanisms which do take into account payoff (fitness) differences. Therefore, in such contexts lattice reciprocity does play its role. In any case, our results call for further experiments that uncover what rules are actually governing the behavior of players engaged in this and other social dilemmas.
J. A. C. and A. S. acknowledge grants MOSAICO, PRODIEVO and Complexity-NET RESINEE (Ministerio de Ciencia e Innovación, Spain) and MODELICO-CM (Comunidad de Madrid, Spain). Y. M. was partially supported by Spanish MICINN (Ministerio de Ciencia e Innovación) projects FIS2008-01240 and FIS2009-13364-C02-01, by the FET-Open project DYNANETS (grant no. 233847) funded by the European Commission and by Comunidad de Aragón (Spain) through the project FMI22/10.
References
- Szabó and Fáth (2007) G. Szabó and G. Fáth, Phys. Rep. 446, 97 (2007).
- Roca et al. (2009a) C. P. Roca, J. A. Cuesta, and A. Sánchez, Phys. Life Rev. 6, 208 (2009a).
- Hofbauer and Sigmund (1998) J. Hofbauer and K. Sigmund, Evolutionary Games and Population Dynamics (Cambridge University Press, Cambridge, 1998).
- Gintis (2009) H. Gintis, Game theory evolving (Princeton University Press, Princeton, 2009), 2nd ed.
- Rapoport and Guyer (1966) A. Rapoport and M. Guyer, General Systems 11, 203 (1966).
- Axelrod (1984) R. Axelrod, The Evolution of Cooperation (Basic Books, New York, 1984).
- Nowak and May (1992) M. A. Nowak and R. M. May, Nature 359, 826 (1992).
- Hauert and Doebeli (2004) C. Hauert and M. Doebeli, Nature 428, 643 (2004).
- Sysi-Aho et al. (2005) M. Sysi-Aho, J. Saramäki, J. Kertész, and K. Kaski, Eur. Phys. J. B 44, 129 (2005).
- Roca et al. (2009b) C. P. Roca, J. A. Cuesta, and A. Sánchez, Phys. Rev. E 80, 046106 (2009b).
- Hofbauer and Sigmund (2003) J. Hofbauer and K. Sigmund, Bulletin of the American Mathematical Society 40, 479 (2003).
- Helbing (1992) D. Helbing, Physica A 181, 29 (1992).
- Szabó and Töke (1998) G. Szabó and C. Töke, Phys. Rev. E 58, 69 (1998).
- Grujić et al. (2010) J. Grujić, C. Fosco, L. Araujo, J. A. Cuesta, and A. Sánchez, PLoS ONE 5, e13749 (2010).
- Fischbacher et al. (2001) U. Fischbacher, S. Gächter, and E. Fehr, Econ. Lett. 71, 397 (2001).
- Traulsen et al. (2010) A. Traulsen, D. Semmann, R. D. Sommerfeld, H.-J. Krambeck, and M. Milinski, Proc. Nat. Acad. Sci. USA 107, 2962 (2010).
- Grujic et al. (2011) J. Grujic, B. Eke, A. Cabrales, J. A. Cuesta, and A. Sánchez (2011), preprint.
- (18) C. P. Roca, J. A. Cuesta and A. Sánchez, Eur. Phys. J. B 71, 587 (2009).