Asymptotic Giant Branch Variables in the Galaxy and the Local Group
Abstract
AGB variables, particularly the large amplitude Mira type, are a vital step on the distance scale ladder. They will prove particularly important in the era of space telescopes and extremely large ground-based telescopes with adaptive optics, which will be optimized for infrared observing. Our current understanding of the distances to these stars is reviewed with particular emphasis on improvements that came from Hipparcos as well as on recent work on Local Group galaxies. In addition to providing the essential calibration for extragalactic distances Gaia may also provide unprecedented insight into the poorly understood mass-loss process itself.
1 Introduction
I will be discussing Asymptotic Giant Branch (AGB) variables, with a strong emphasis on the pulsating stars with the largest amplitudes: the Mira variables. My main intention is to convince you that these stars offer a huge potential as distance calibrators for distant resolved stellar populations. Under many circumstances they will be a great deal better than Cepheids, but if they are to be used effectively then it is essential that we use the opportunity offered by Gaia to calibrate them properly. The very large, but variable, size together with significant spatial asymmetries expected for these stars will offer some special challenges in the interpretation of the information we will get from Gaia.
Mass loss, and indeed most aspects of AGB phase evolution, remain poorly understood. Our interest in Gaia and AGB stars is therefore two-fold: (1) there is empirical evidence, as discussed below, that Mira variables are good distance indicators and we require the Gaia calibration of local Miras to put this to use in distant galaxies; (2) the detailed observations by Gaia of atmospheric and dust shell structures of Miras will potentially provide invaluable insight into the mass-loss process and into AGB evolution.
2 Mira Variables and their Evolutionary Status
Mira variables are distinguished by their large pulsation amplitudes ( or 0.9, mag). They are late-type stars with spectra that are dominated by molecular absorption features in the optical and near-infrared (e.g. TiO, ZrO, CN, , ) and by emission and/or absorption from dust grains (largely silicate or carbonaceous, depending on the C/O ratio) in the mid-infrared. Shock waves associated with the large amplitude pulsations result in emission lines at certain phases and, where the visible spectra can be observed, they are Me or Ce-type, or more rarely Se or Ke. Pulsation periods range from just under 100 days to over 2000 days, although by far the majority are in the 200 to 450 day range (Samus et al., 2009).
Stars in the approximate mass range evolve through the AGB after they experience core He-burning and before planetary nebula formation. Somewhat more massive stars may become super-AGB stars, but their evolution is less clear.
During the AGB most of the stellar energy originates from H-shell burning, although the occasional He-shell flash has a profound influence on the star, changing not only the luminosity and pulsation behaviour, but also provoking the dredge-up of carbon from the core that is responsible for changing the chemistry from O-rich to C-rich.
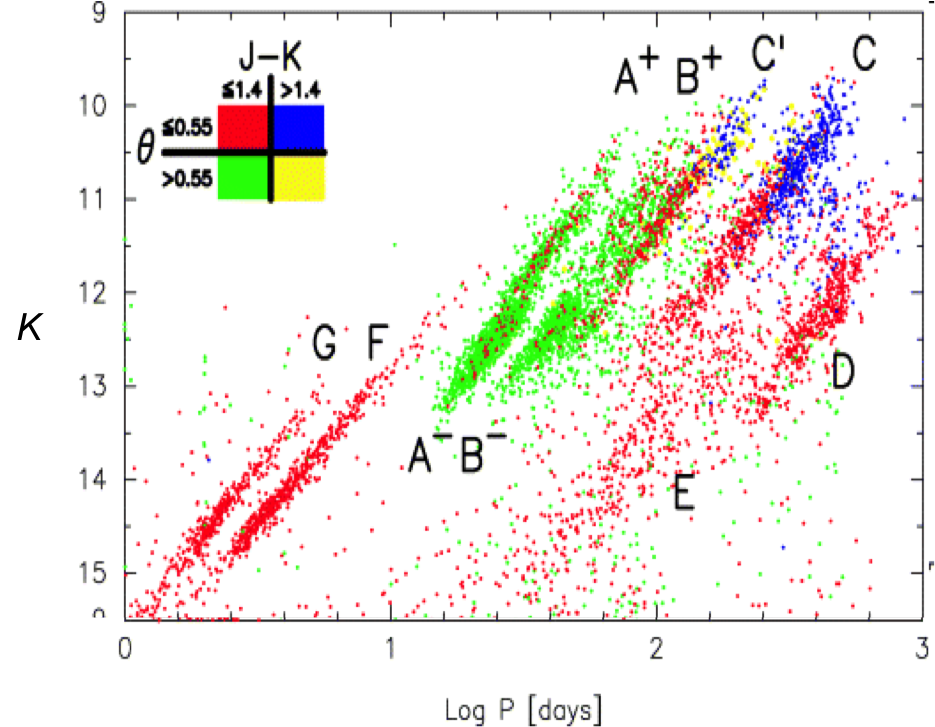
The Mira phase is relatively short lived, of the order of years for low mass stars, and is the evolutionary period during which the star is at its most luminous and experiencing its highest mass-loss rate. In general, as stars ascend the AGB they go through various stages of instability and will be observed as low amplitude, overtone pulsators before they become Miras. Of course He-shell flashes complicate this picture and it is possible that stars enter and leave the Mira phase more than once, although this is not certain. It has been demonstrated that AGB variables in the Large Magellanic Cloud (LMC) fall on a number of period luminosity (PL) relations (e.g. Wood (2000); Ita et al. (2004)), as illustrated in Fig. 1.
3 Miras and Cepheids - a Comparison
While there are a variety of ways for estimating the distances of galaxies, I don’t really need to remind this audience that the Cepheid variables have provided a really vital step in bridging the gap between the Local Group and distant unresolved systems. It is therefore interesting to examine under what circumstances Miras might prove as useful as or more so than, Cepheids.
The next generation of telescopes, in space and on the ground, will be operating primarily at infrared wavelengths. So it is in this spectral region that we should make the comparison and Table 1 shows the absolute and m magnitudes for Cepheids and Miras with various different pulsation periods. At the two types of variable are comparable, but as one goes to longer wavelengths the rising relative brightness of the Miras renders them increasingly attractive. Of course at m, much of the emission from Miras with P=380 days will originate from dust (e.g. Riebel et al., 2010).
As Miras belong to a somewhat older population than Cepheids they are found in elliptical and dwarf spheroidal galaxies. Within spiral galaxies the Miras are less concentrated in the spiral arms than are Cepheids and therefore less crowded and more easily resolved at large distances.
On the negative side, it could take longer to establish the period of a Mira, they are less regular than Cepheids, have larger amplitudes and are not as well understood.
| wavelength | variable | period | absolute |
|---|---|---|---|
| type | (day) | mag | |
| (2.2m) | Cep | 50 | |
| M | 380 | ||
| 8m | Cep | 50 | |
| M | 230 | ||
| M | 380 |
4 Period-Luminosity Relations for the Distance Scale
We tend to work with the PL relation at , PL(), because is reasonably easy to measure, the amplitude of the variability is less at than at shorter wavelengths (typically mag, mag and mag), it is less affected by circumstellar absorption than shorter wavelengths and less affected by circumstellar emission than longer wavelengths. However, the PL() relation clearly breaks down when there is significant circumstellar reddening. This occurs at very long periods for O-rich Miras, but over quite a large range of periods for C-rich stars (see also section 6).
The obvious alternative to the PL() relation is the bolometric PL relation. This has the advantage that it is independent of circumstellar reddening and that it can be more easily compared to models, i.e. it is arguably more fundamental. However, it is much more difficult to measure as it properly requires observations over a large range of wavelength and over a long period of time. There are short-cuts, for example by using colour-dependent bolometric corrections, but problems can arise because different methods give systematically different results (Whitelock et al., 2009a).
Exactly what is done depends on what one is trying to achieve and the type of data available, but in general remains preferable for determining distances, provided that is low or measurable (e.g. Matsunaga et al., 2009).
Figure 1 shows the PL() relations for giant branch and AGB variables in the LMC. The periods came from OGLE II and the -mags from the InfraRed Survey Facility (IRSF) at Sutherland in South Africa. Miras, the largest amplitude variables, are found mainly on sequence C with a very few on the long-period part of . Because the periods come from OGLE there is a bias towards relatively thin shelled sources that are bright in the red. If one looked at a group selected by IRAS or Spitzer, one would find many more stars that are fainter at .
Another example (Fig. 2) comes from Ita and Matsunaga (2011); it shows only the large amplitude (Mira) variables with periods from OGLE III and uses IR data from IRSF and the Spitzer satellite. The spectral type distinction is made on the basis of colour, with redder stars assumed to be C-rich. There are two points to recognize in this figure. First, many of the C stars, particularly the longer period ones, fall below the PL relation, and particularly so at shorter wavelengths. The reason for this is well understood: these are stars with dust shells that are sufficiently thick that they affect the -mag; the stars are red (their separation from the PL() relation will be proportional to ). At wavelengths longer than m the thick shells emit rather than absorb, and the points fall above the PL relations.
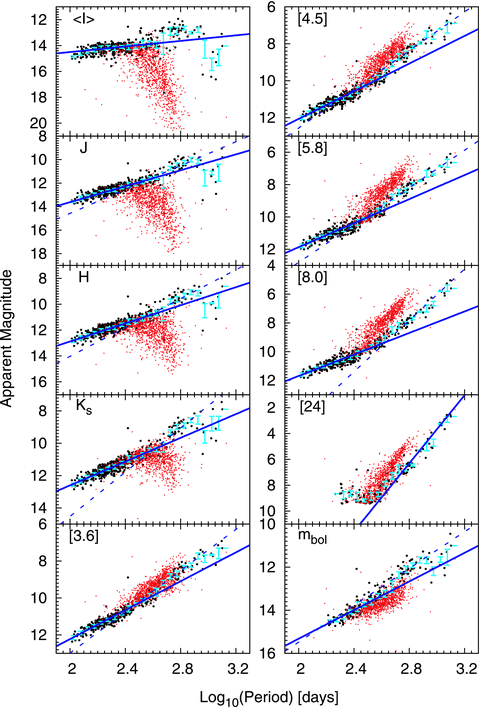
Secondly, at periods above about 400 days the O-rich stars show a lot of scatter in their magnitudes, and many of them fall above the PL relation. This was noted earlier by e.g., Feast et al. (1989). The reason for this is less clear, but it may be that the higher luminosity stars are undergoing hot bottom burning (HBB) (Whitelock et al., 2003) and therefore depart from the PL relation, which is consequence of the core-mass luminosity relation. There are much fainter long-period O-rich stars, as discussed by Whitelock et al. (2003), but these are too faint to be measured at by OGLE, they are, however, close to the bolometric PL relation.
Note that both Figs. 1 and 2 show a good deal of scatter because they illustrate single observations rather than mean magnitudes; i.e., the scatter does not represent the real scatter of the PL relation.
The behaviour of the long period stars is astrophysically very interesting, but adds to the complexity of using them for distance determination. It seems sensible to suggest that we should concentrate on stars with periods less than 400 days in distance calibration work.
The best PL relation for distance scale work is arguably that established by Whitelock et al. (2008), as illustrated in Fig. 3. This is based on multiply observed LMC sources whose status as C- or O-rich stars was spectroscopically determined. Very similar relations were established for the LMC by Ita and Matsunaga (2011) using a larger number of stars with single observations and also for NGC 5128 by Rejkuba (2004) for colour-selected O-rich stars with multiple observations. This comparison with Rejkuba also indicates that there is no significant difference in the slope of the PL relation in the very different environments of the LMC and NGC 5128.
Whitelock et al. (2008) also examined the PL relation zero-point calibration for various samples of Galactic stars, assuming that the slope of the PL relation determined for the LMC also applies to the Galaxy. They derive the zero-point, , of the PL relation of the form:
Their results are shown in Table 2, where the first column gives the number of stars used to derive the zero point.
The top part of the table describes O-rich stars the lower part C-rich stars. The first two lines of the O-rich list, and the first of the C-rich list, describe the results derived from the Hipparcos parallaxes. Note that an early paper (Whitelock and Feast, 2000) had identified short period red Miras as a kinematically different population from their long period counterparts, hence they were excluded from the Hipparcos results listed here. The selection of large amplitude stars ( mag) from the Hipparcos sample ensures that the stars are really Miras. Whitelock et al. (2008) quoted more detailed results, but those listed here are the preferred solutions.
The new result from Matsunaga et al. (2009) for Miras near the Galactic Centre is also included in this table. The Matsunaga et al. result will give a distance to the Galactic Centre of , if we assume, following Whitelock et al., that the distance modulus of the LMC is 18.39 (for consistency with the rest of the table).
What is seen for O-rich stars is good agreement between zero-points from various Galactic methods including Hipparcos, globular clusters, VLBI distances and the Galactic Centre. While there could be metallicity effects, it is clear that they must be small. There is also agreement for C-stars, but the sample is small and the uncertainties large.
| No. | stars included | ||
| 168 | –7.27 | 0.14 | Hipparcos , mag; excluding SP-red stars |
| 42 | –7.32 | 0.10 | Hipparcos , Miras + non-Miras with mag; high weight only |
| 5 | –7.08 | 0.17 | VLBI for OH-Miras |
| 11 | –7.34 | 0.13 | Globular cluster Miras (cluster distances from Hipparcos subdwarfs) |
| 29 | –7.04 | 0.11 | Miras in Galactic Bulge mag |
| –7.18 | 0.11 | Miras near the GC (Matsunaga et al., 2009) | |
| 31 | –7.15 | 0.06 | LMC O-rich Miras |
| 16 | –7.18 | 0.37 | Hipparcos , , hi weight C stars |
| 22 | –7.24 | 0.07 | LMC C-rich Miras |
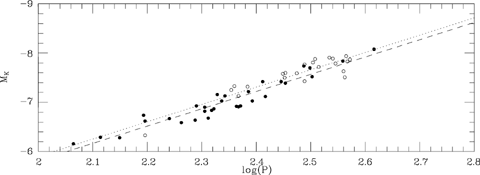
Figure 4 illustrates the PL() relation for O-rich Galactic stars with good individual parallax measurements. This is taken from Whitelock et al. (2008), but includes the recent parallax measurements made by VERA (Kurayama et al. (2005) for UX Cyg and Nyu et al. (2011) for SY Scl). The high luminosity long period point, UX Cyg (P=561), is interesting as this star may well be hot bottom burning.

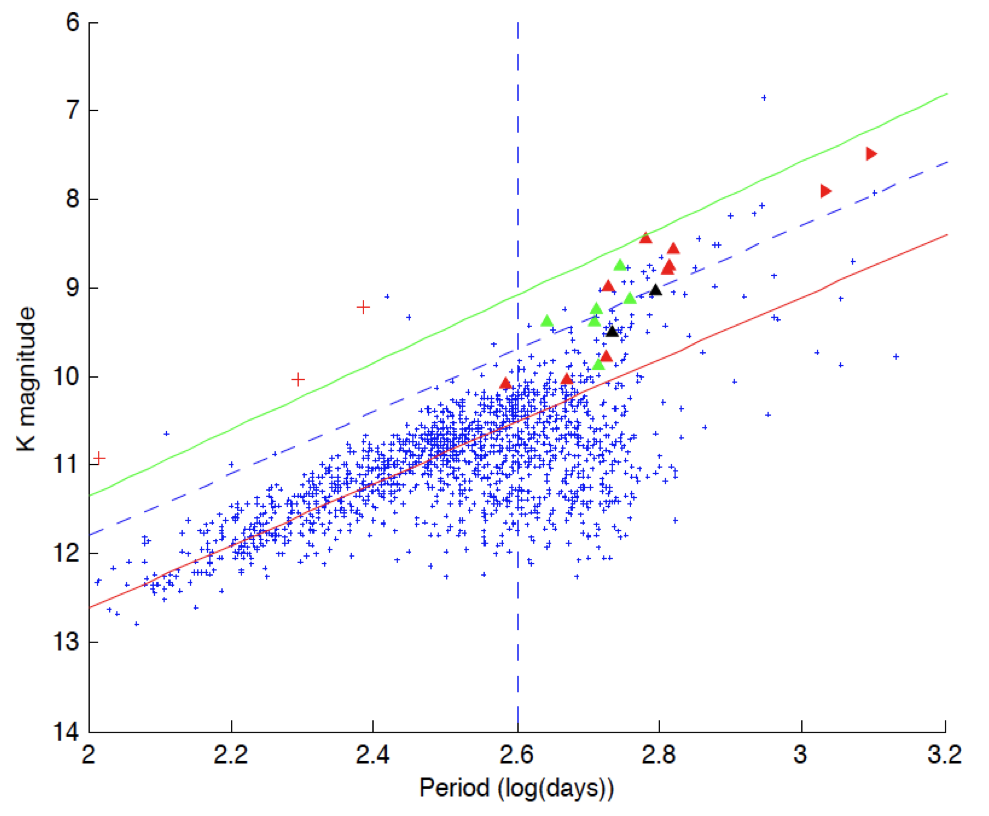
Figure 5 was prepared by Christoph Hagspihl, a student from the South African National Astrophysics and Space Science Programme (NASSP) as part of his research project. It shows the 2MASS magnitudes for Miras with periods from OGLE III. Some of the scatter will be due to the single observations, while the faint stars centred around will be the thick shelled C-stars discussed above in the context of Fig. 2. Superimposed on this are stars known to be hot bottom burning, from both the LMC and SMC (assuming a distance modulus difference of 0.4 mag), including three SR variables. The HBB sample includes stars with strong lithium absorption from Smith et al. (1995) and those with strong rubidium from García-Hernández et al. (2009). The HBB stars are among the most luminous stars for their period, but it remains possible that this is a selection effect - it is easier to get the high signal-to-noise and good resolution required to make the observation from luminous stars.
In this section I have concentrated on the PL() relation, as I believe that will be the most useful for distance calibration. There are occasions when we need to use the bolometric PL relation, as described below.
5 Local Group Galaxies
A group of us based at the South African Astronomical Observatory and the University of Cape Town, in collaboration with colleagues in Japan, have been observing Local Group galaxies in the near infrared, , using the 1.4m Infrared Survey Facility (Matsunaga this volume) at SAAO Sutherland.
To date we have published observations for 4 dwarf spheroidals, Fornax, Leo I, Sculptor and Phoenix, which have 17 Miras between them (Menzies et al. (2008), Whitelock et al. (2009b), Menzies et al. (2010), Menzies et al. (2011)). We have started work on NGC 6822, a barred dwarf irregular which has over 50 Miras. Much of the work on NGC 6822 was done by Francois Nsengiyumva, an MSc student.
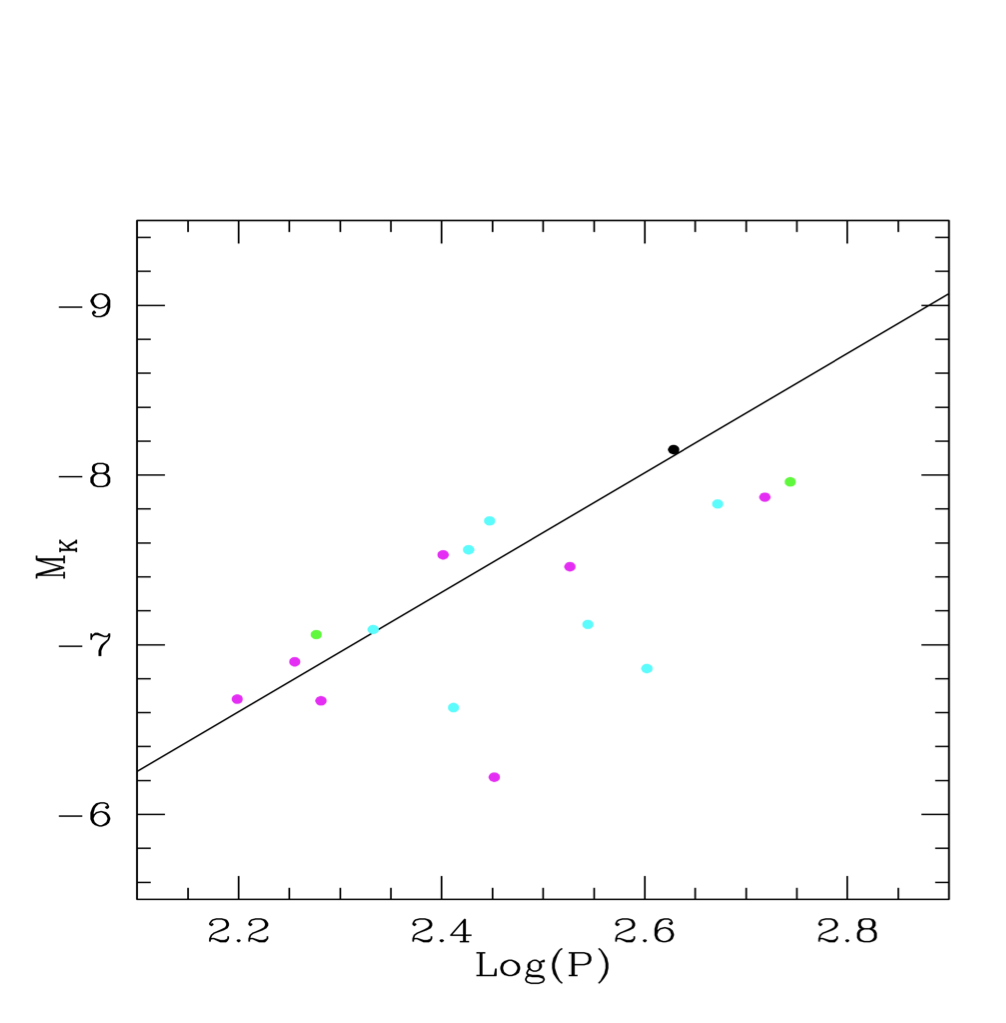
Figure 6 shows a combined PL() diagram for all of the dwarf spheroidals, calculated assuming an LMC distance modulus of 18.39 mag. If one changes the assumed distance to the LMC the points all move up or down in the diagram, but their relative positions remain unchanged. There is a good deal of scatter in this diagram and no clearly defined PL() relationship.
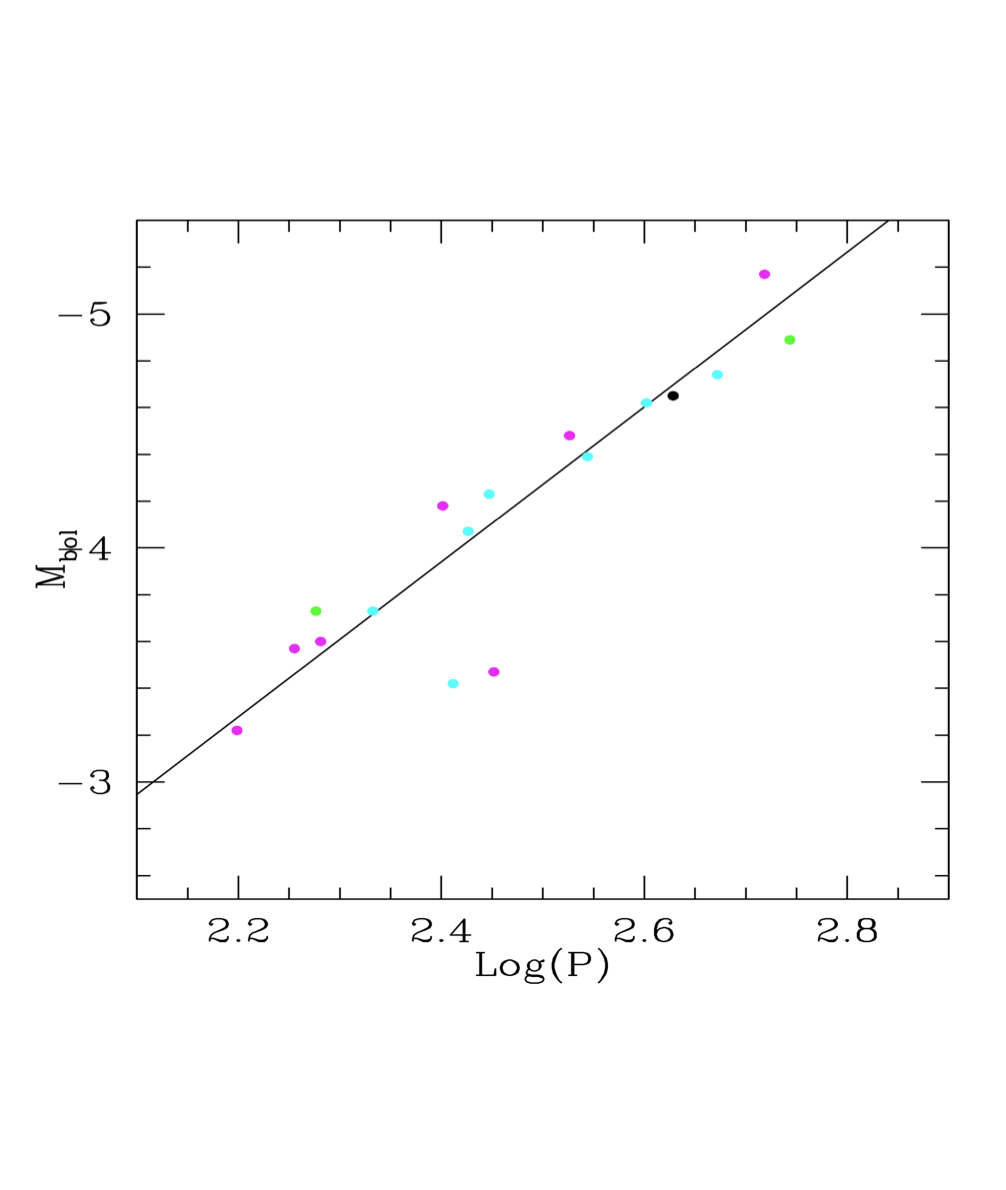
Where we have spectra for these stars we know them to be C-rich and on the basis of their colour we would anticipate that they are all C-rich. On this assumption bolometric magnitudes can be estimated using a colour-dependent bolometric correction (Whitelock et al. 2009). Figure 7 shows the resulting bolometric PL relation which, with the exception of two points, shows a tight relationship. This demonstrates that most of the scatter seen in Fig 6 was caused by circumstellar absorption of varying amounts.
It seems that these Local Group C-rich Miras exhibit thick dust shells rather more commonly than their Galactic or LMC counterparts. There are two possible explanations for the stars that fall below the bolometric PL relation. First, it may be that the bolometric correction, which was derived for Galactic C stars (Whitelock et al., 2006), does not apply to these short period thick shelled sources, which are not known in the Galaxy. Note in particular that the red side of the bolometric correction curve (Whitelock et al., fig. 15) is effectively a reddening locus. The dwarf spheroidals have some much shorter period, and presumably intrinsically hotter, stars with thick shells. The bolometric correction will not adequately work for these.
Alternatively, the faint stars are undergoing an obscuration event of the sort described below, which are known to be quite common among LMC (Whitelock et al., 2003) and Galactic (Whitelock et al., 2006) C stars. If the obscuration is clumpy, or non-uniform over the hemisphere, then again the bolometric correction will not give the correct bolometric magnitude.
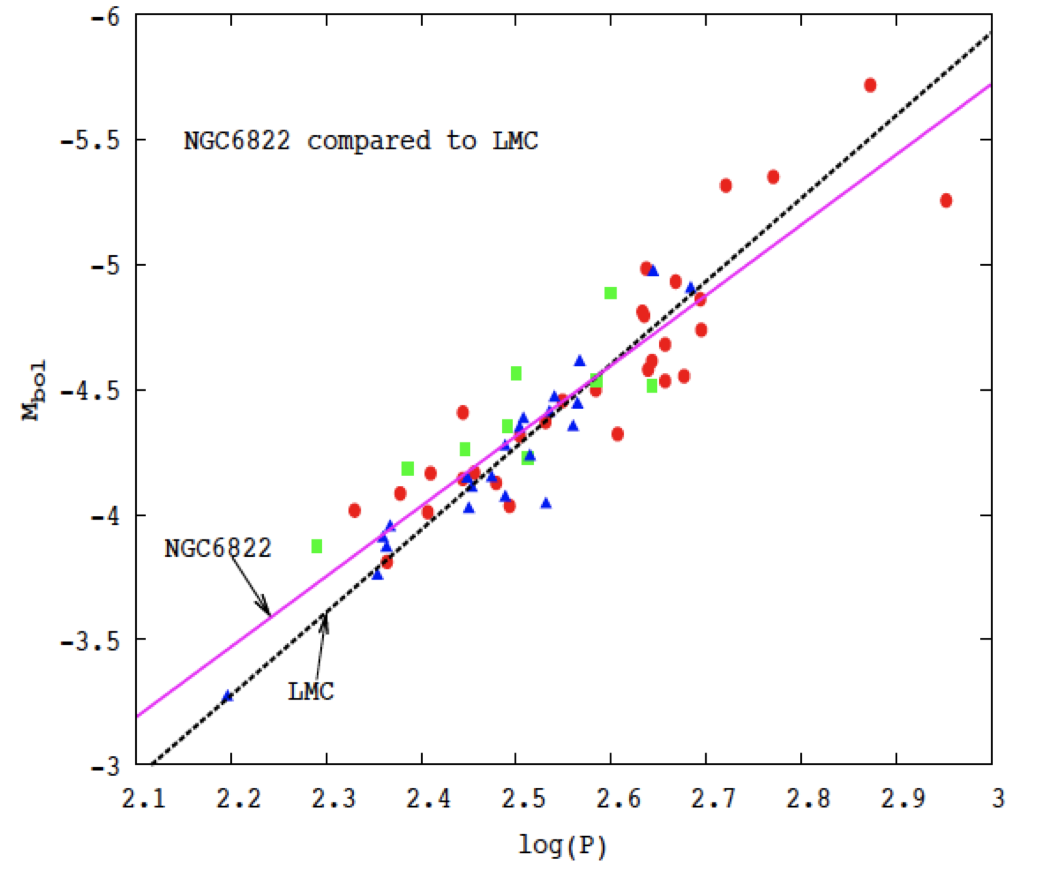
Figure 8 shows the bolometric PL relation for Miras and a few of the numerous SR variables in NGC 6822 (Nsengiyumva, 2010). All of the Miras in this diagram are thought to be C-rich, although there are also Miras in that galaxy which are probably O-rich. LMC Miras are shown for comparison, again assuming a distance modulus of 18.39 mag. This would put NGC 6822 at 23.43, comparable to published estimates. The LMC and NGC 6822 Miras show the same slope within the uncertainties.
6 Obscuration Events in C-rich Stars
Whitelock et al. (2006) noted that erratic mass-loss from C-rich Miras was common: one third of the well studied Miras exhibited the phenomenon, as did an unknown fraction of C-rich SR-variables. In an earlier detailed study of the 575-day Mira, II Lup, Feast et al. (2003) demonstrated that the mass loss was occurring in a similar way to that from R CrB stars. This involves the ejection of puffs of dust in random directions, rather than a uniform shell. It is also clear (Whitelock et al., 1997) that these ejections are not periodic.
This phenomenon, which has only recently been recognized, will complicate the derivation of bolometric magnitudes of these stars, as their shells cannot be assumed to be uniform. However, the work on Local Group galaxies discussed above suggests that a PL relation can be used to determine distances provided that several stars can be measured for any particular system.
7 Resolving circumstellar features with Gaia
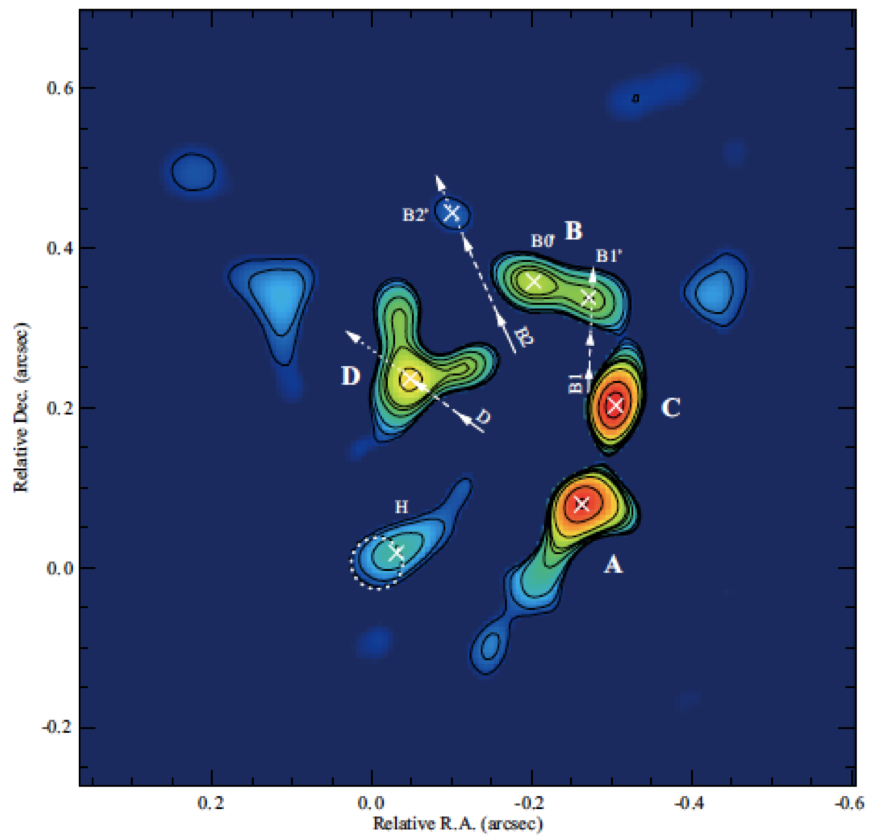
I would like to finish by discussing a different perspective and by suggesting that Gaia will potentially resolve considerable detail of the very extended atmospheres and shells of Miras. This will be of huge interest in its own right. CW Leo is one of the best-studied C-rich Miras with a pulsation period of 650 days. Leão et al. (2006) produced diffraction-limited images of it which showed extended structure with a central core of clumps whose position and luminosity vary (see Fig. 9). Gaia will presumably detect each separate clump, but the interpretation as they vary in brightness and move on the sky will be a challenge.
Mira variables are extremely large and have complex structured atmospheres. The problem is obvious when one recognizes that any plausible measure of the angular diameter of a Mira will be larger than its parallax, even if they are not all as complex as CW Leo. Typically the diameter of the star will be around 1 AU and the diameter of its dust shell will be about 1000AU, so for Gaia, Miras are not point sources.
I am not a Gaia expert, but this seems to me to pose both a challenge and an opportunity. The challenge in interpreting the parallax data is clear: interpreting the Gaia data will not be as simple as it will be for smaller stars. However, the Gaia data will also contain a wealth of information about the structure of the star which could potentially provide tremendous astrophysical insight. Interferometry from the VLT and Keck (Mennesson et al. (2002), Thompson et al. (2002)) has shown that Mira disks exhibit significant departures from uniformity. This may be related to the way in which they lose mass; it almost certainly varies with pulsation phase and it probably varies in other non-predictable ways. Can Gaia perhaps provide the critical insight into the relationship between pulsation and mass loss?
Acknowledgements I am grateful to John Menzies and Michael Feast for a critical reading of the manuscript and for discussions of various aspects of this paper. I also thank the National Research Foundation (NRF) for a research grant which supported this work.
References
- Feast et al. (2003) Feast, M.W., Whitelock, P.A., Marang, F.: Mon. Not. R. Astron. Soc. 346, 878 (2003). doi:10.1111/j.1365-2966.2003.07136.x
- Feast et al. (1989) Feast, M.W., Glass, I.S., Whitelock, P.A., Catchpole, R.M.: Mon. Not. R. Astron. Soc. 241, 375 (1989)
- García-Hernández et al. (2009) García-Hernández, D.A., Manchado, A., Lambert, D.L., Plez, B., García-Lario, P., D’Antona, F., Lugaro, M., Karakas, A.I., van Raai, M.A.: Astrophys. J. Lett. 705, 31 (2009). doi:10.1088/0004-637X/705/1/L31
- Ita and Matsunaga (2011) Ita, Y., Matsunaga, N.: Mon. Not. R. Astron. Soc. 412, 2345 (2011). doi:10.1111/j.1365-2966.2010.18056.x
- Ita et al. (2004) Ita, Y., Tanabé, T., Matsunaga, N., Nakajima, Y., Nagashima, C., Nagayama, T., Kato, D., Kurita, M., Nagata, T., Sato, S., Tamura, M., Nakaya, H., Nakada, Y.: Mon. Not. R. Astron. Soc. 347, 720 (2004). doi:10.1111/ j.1365-2966.2004.07257.x
- Kurayama et al. (2005) Kurayama, T., Sasao, T., Kobayashi, H.: Astrophys. J. Lett. 627, 49 (2005). doi:10.1086/432051
- Leão et al. (2006) Leão, I.C., de Laverny, P., Mékarnia, D., de Medeiros, J.R., Vandame, B.: Astron. Astrophys. 455, 187 (2006). doi:10.1051/0004-6361:20054577
- Matsunaga et al. (2009) Matsunaga, N., Kawadu, T., Nishiyama, S., Nagayama, T., Hatano, H., Tamura, M., Glass, I.S., Nagata, T.: Mon. Not. R. Astron. Soc. 399, 1709 (2009). doi:10.1111/j.1365-2966.2009.15393.x
- Mennesson et al. (2002) Mennesson, B., Perrin, G., Chagnon, G., du Coudé Foresto, V., Ridgway, S., Merand, A., Salome, P., Borde, P., Cotton, W., Morel, S., Kervella, P., Traub, W., Lacasse, M.: Astrophys. J. 579, 446 (2002). doi:10.1086/342671
- Menzies et al. (2010) Menzies, J.W., Whitelock, P.A., Feast, M.W., Matsunaga, N.: Mon. Not. R. Astron. Soc. 406, 86 (2010). doi:10.1111/ j.1365-2966.2010.16670.x
- Menzies et al. (2011) Menzies, J.W., Feast, M.W., Whitelock, P.A., Matsunaga, N.: Mon. Not. R. Astron. Soc. 414, 3492 (2011). doi:10.1111 /j.1365-2966.2011.18649.x
- Menzies et al. (2008) Menzies, J., Feast, M., Whitelock, P., Olivier, E., Matsunaga, N., da Costa, G.: Mon. Not. R. Astron. Soc. 385, 1045 (2008). doi:10.1111/j.1365-2966.2008.12907.x
- Nsengiyumva (2010) Nsengiyumva, F.: AGB Variables in NGC6822. Master’s thesis, University of Cape Town (2010)
- Nyu et al. (2011) Nyu, D., Nakagawa, A., Matsui, M., Imai, H., Sofue, Y., Omodaka, T., Kurayama, T., Kamohara, R., Hirota, T., Honma, M., Shibata, K.M., Kobayashi, H., Iwadate, K., Miyaji, T.: Publ. Astron. Soc. Jpn. 63, 63 (2011)
- Rejkuba (2004) Rejkuba, M.: Astron. Astrophys. 413, 903 (2004). doi:10.1051 /0004-6361:20034031
- Riebel et al. (2010) Riebel, D., Meixner, M., Fraser, O., Srinivasan, S., Cook, K., Vijh, U.: Astrophys. J. 723, 1195 (2010). 1007.5029. doi:10.1088/0004-637X/723/2/1195
- Samus et al. (2009) Samus, N.N., Durlevich, O.V., et al.: VizieR Online Data Catalog 10, 2025 (2009)
- Smith et al. (1995) Smith, V.V., Plez, B., Lambert, D.L., Lubowich, D.A.: Astrophys. J. 441, 735 (1995). doi:10.1086/175395
- Thompson et al. (2002) Thompson, R.R., Creech-Eakman, M.J., van Belle, G.T.: Astrophys. J. 577, 447 (2002). doi:10.1086/342147
- Whitelock and Feast (2000) Whitelock, P., Feast, M.: Mon. Not. R. Astron. Soc. 319, 759 (2000). doi:10.1046/j.1365-8711.2000.03742.x
- Whitelock et al. (2008) Whitelock, P.A., Feast, M.W., van Leeuwen, F.: Mon. Not. R. Astron. Soc. 386, 313 (2008). doi:10.1111/j.1365-2966.2008.13032.x
- Whitelock et al. (1997) Whitelock, P.A., Feast, M.W., Marang, F., Overbeek, M.D.: Mon. Not. R. Astron. Soc. 288, 512 (1997)
- Whitelock et al. (2003) Whitelock, P.A., Feast, M.W., van Loon, J.T., Zijlstra, A.A.: Mon. Not. R. Astron. Soc. 342, 86 (2003). doi:10.1046/j.1365-8711.2003.06514.x
- Whitelock et al. (2006) Whitelock, P.A., Feast, M.W., Marang, F., Groenewegen, M.A.T.: Mon. Not. R. Astron. Soc. 369, 751 (2006). doi:10.1111/j.1365-2966.2006.10322.x
- Whitelock et al. (2009a) Whitelock, P.A., Menzies, J.W., Feast, M.W., Matsunaga, N., Tanabé, T., Ita, Y.: Mon. Not. R. Astron. Soc. 394, 795 (2009a). doi:10.1111/j.1365-2966.2008.14365.x
- Whitelock et al. (2009b) Whitelock, P.A., Menzies, J.W., Feast, M.W., Matsunaga, N., Tanabé, T., Ita, Y.: Mon. Not. R. Astron. Soc. 394, 795 (2009b). doi:10.1111/j.1365-2966.2008.14365.x
- Wood (2000) Wood, P.R.: Proc. Astron. Soc. Aust. 17, 18 (2000)