Variable Stars in the Cetus dSph Galaxy: Population Gradients and Connections with the Star Formation History ††thanks: Based on observations made with ESO Telescopes at the Paranal Observatories under programme ID 081.D-0775.
Abstract
We investigate the variable star content of the isolated, Local Group, dwarf spheroidal galaxy (dSph) Cetus. Multi-epoch, wide-field images collected with the VLT/VIMOS camera allowed us to detect 638 variable stars (630 RR Lyrae stars and 8 Anomalous Cepheids), 475 of which are new detections. We present a full catalogue of periods, amplitudes, and mean magnitudes. Motivated by the recent discovery that the pulsational properties of the RR Lyrae stars in the Tucana dSph revealed the presence of a metallicity gradient within the oldest (10 Gyr old) stellar populations, we investigated the possibility of an analogous effect in Cetus. We found that, despite the obvious radial gradient in the Horizontal Branch (HB) and Red Giant Branch (RGB) morphologies, both becoming bluer on average for increasing distance from the center of Cetus, the properties of the RR Lyrae stars are homogeneous within the investigated area (out to r15), with no significant evidence of a radial gradient. We discuss this in connection with the star formation history (SFH) previously derived for the two galaxies. The observed differences between these two systems show that even systems this small show a variety of early evolutionary histories. These differences could be due to different merger or accretion histories.
keywords:
RR Lyrae variable – Local Group – galaxies: individual (Cetus dSph) – galaxies: stellar content1 Introduction
| Date | UT Start | Filter | Exposure Time | Seeing |
|---|---|---|---|---|
| (s) | () | |||
| 2008-07-28 | 08:54:08 | 500 | 0.50 | |
| 2008-07-28 | 09:03:18 | 500 | 0.50 | |
| 2008-07-28 | 09:12:29 | 500 | 0.50 | |
| 2008-07-28 | 09:23:51 | 500 | 0.45 | |
| 2008-07-28 | 09:37:30 | 500 | 0.50 | |
| 2008-07-28 | 09:46:40 | 500 | 0.50 | |
| 2008-07-28 | 09:55:51 | 500 | 0.55 | |
| 2008-07-28 | 10:07:13 | 500 | 0.55 | |
| 2008-08-04 | 06:40:03 | 500 | 0.55 | |
| 2008-08-04 | 06:49:15 | 500 | 0.55 | |
| 2008-08-04 | 06:58:25 | 500 | 0.55 | |
| 2008-08-04 | 07:10:18 | 500 | 0.55 | |
| 2008-08-04 | 07:21:45 | 500 | 0.55 | |
| 2008-08-04 | 07:30:56 | 500 | 0.50 | |
| 2008-08-04 | 07:40:06 | 500 | 0.55 | |
| 2008-08-04 | 07:51:28 | 500 | 0.50 | |
| 2008-08-04 | 08:03:08 | 500 | 0.55 | |
| 2008-08-04 | 08:12:18 | 500 | 0.55 | |
| 2008-08-04 | 08:21:30 | 500 | 0.55 | |
| 2008-08-04 | 08:32:54 | 500 | 0.50 | |
| 2008-08-05 | 06:57:57 | 500 | 0.60 | |
| 2008-08-05 | 07:07:07 | 500 | 0.60 | |
| 2008-08-05 | 07:16:18 | 500 | 0.65 | |
| 2008-08-05 | 07:27:39 | 500 | 0.55 | |
| 2008-08-05 | 07:37:49 | 500 | 0.55 | |
| 2008-08-05 | 07:50:53 | 500 | 0.60 | |
| 2008-08-05 | 08:00:04 | 500 | 0.60 | |
| 2008-08-05 | 08:09:14 | 500 | 0.60 | |
| 2008-08-05 | 08:20:38 | 500 | 0.65 | |
| 2008-08-05 | 08:33:40 | 500 | 0.60 | |
| 2008-08-05 | 08:42:50 | 500 | 0.65 | |
| 2008-08-05 | 08:52:01 | 500 | 0.65 | |
| 2008-08-05 | 09:03:22 | 500 | 0.55 | |
| 2008-08-05 | 09:16:36 | 500 | 0.55 | |
| 2008-08-05 | 09:25:47 | 500 | 0.60 | |
| 2008-08-05 | 09:34:58 | 500 | 0.65 | |
| 2008-08-05 | 09:46:20 | 500 | 0.60 | |
| 2008-08-06 | 07:14:09 | 500 | 0.55 | |
| 2008-08-06 | 07:23:20 | 500 | 0.50 | |
| 2008-08-06 | 07:32:30 | 500 | 0.50 | |
| 2008-08-06 | 07:44:04 | 500 | 0.50 | |
| 2008-08-06 | 07:56:44 | 500 | 0.50 | |
| 2008-08-06 | 08:05:55 | 500 | 0.45 | |
| 2008-08-06 | 08:15:06 | 500 | 0.50 | |
| 2008-08-06 | 08:26:30 | 500 | 0.45 | |
| 2008-08-06 | 08:38:11 | 500 | 0.55 | |
| 2008-08-06 | 08:47:22 | 500 | 0.55 | |
| 2008-08-06 | 08:59:30 | 500 | 0.55 | |
| 2008-08-06 | 09:08:41 | 500 | 0.55 | |
| 2008-08-06 | 09:17:51 | 500 | 0.55 | |
| 2008-08-06 | 09:29:15 | 500 | 0.55 | |
| 2008-08-07 | 08:37:59 | 500 | 0.50 | |
| 2008-08-07 | 08:47:09 | 500 | 0.50 | |
| 2008-08-07 | 08:56:20 | 500 | 0.55 | |
| 2008-08-07 | 09:07:41 | 500 | 0.55 | |
| 2008-08-07 | 09:20:18 | 500 | 0.60 | |
| 2008-08-07 | 09:29:28 | 500 | 0.65 | |
| 2008-08-07 | 09:38:39 | 500 | 0.65 | |
| 2008-08-07 | 10:01:25 | 500 | 0.65 | |
| 2008-08-08 | 05:19:34 | 500 | 0.80 | |
| 2008-08-08 | 05:28:44 | 500 | 0.80 | |
| 2008-08-08 | 05:37:54 | 500 | 0.75 | |
| 2008-08-08 | 05:49:21 | 500 | 0.80 |

The galaxies of the Local Group (LG) provide the opportunity to study galaxy evolution through the analysis of the resolved stellar populations. These can be investigated in great detail using complementary studies of: i) deep color-magnitude diagrams (CMD), with high fidelity photometry reaching the oldest main sequence turn-off (MSTO), which are crucial to derive the lifetime star formation history (SFH) of a stellar system (Holtzman et al., 1999; Dolphin, 2002; Gallart, Zoccali & Aparicio, 2005; Noël, 2008; Aparicio & Hidalgo, 2009; Noël et al., 2009; Cignoni & Tosi, 2010; Hidalgo et al., 2011); ii) the properties of variable stars, which are intrinsically connected to the properties of their corresponding stellar population (e.g., Gallart et al., 2004). For example, RR Lyrae stars are unambiguous tracers of old populations ( Gyr), and can provide independent constraints on the age and metallicity of the host (e.g., Bernard et al., 2008); iii) the spatial distributions of stellar populations, and the variation of properties with galactocentric distance, which are useful to constrain the mechanisms affecting dwarf galaxies at very early epochs (Stinson et al., 2009); iv) the chemical and kinematic properties provided by spectroscopy of individual stars, which can also reveal the presence of otherwise hidden stellar populations (e.g., Tolstoy et al., 2004). This wealth of information can be combined to derive a comprehensive picture of the evolution of stellar systems.
As part of the Hubble Space Telescope (HST) cycle 14 LCID project101010Local Cosmology from Isolated Dwarfs, http://www.iac.es/project/LCID, we obtained very deep CMDs (V 29 mag) of a sample of five isolated Local Group dwarfs representative of the dSph (Tucana and Cetus), dIrr (Leo A and IC 1613) and transition dIrr/dSph types (LGS 3). These observations allowed us to derive their lifetime SFHs (Cole et al. 2007, Monelli et al. 2010c, hereafter Paper II, Monelli et al. 2010b; Hidalgo et al. 2011), and to characterize the properties of their short period variables (Cetus and Tucana: Bernard et al. 2008, 2009, hereafter Paper I; LGS 3 and Leo A: Bernard 2009; IC 1613: Bernard et al. 2010).
In particular, Cetus and Tucana present an interesting pair of dwarf galaxies characterized by old (9 Gyr) and metal-poor (Z0.001) stars. Located at more than 700 kpc from both the Milky Way and M31, they are the two most isolated dSph galaxies in the LG. Despite their location, they do not host any intermediate-age or young population (Monelli et al., 2010b), and therefore they are outliers in the density-morphology relation (van den Bergh, 1999). Based on measurements of their radial velocities (Lewis et al., 2007; Fraternali et al., 2009), it is believed that they spent most of their life in isolation, and that they experienced at most one interaction with giant galaxies in the LG. For these reasons, Cetus and Tucana provide excellent laboratories to study the mechanisms affecting the early evolution of dSph systems.
Bernard et al. (2008) presented the intriguing case of Tucana, where strong gradients within the old population were observed in the properties of both the variable and the non-variable stars. Specifically, it was observed that:
a) The color spread of Tucana’s Red Giant Branch (RGB), especially for the brightest stars, is larger in the inner region than in the outskirts. This is due to the lack of red RGB stars in the outer region, where the RGB is predominantly populated at its blue edge;
b) the red part of Tucana’s HB is present in the inner region but is sparsely populated in the external one, while the blue part is present everywhere across the galaxy;
c) Tucana’s MSTO is thicker in the inner region than in the outer one, suggesting a larger age spread of the populations in the center of Tucana.
This empirical evidence indicates the presence of both age and metallicity gradients in Tucana. The MSTO region indicates that the oldest stars are present over the whole body of the galaxy, while the younger stars are more centrally concentrated, as commonly observed in Local Group galaxies, e.g., in Sculptor (Tolstoy et al., 2004) and Carina (Monelli et al., 2003). Additionally, the RGB and HB morphologies support the idea that the older stars are on average relatively metal-poor (blue RGB, bright blue HB), while the slightly younger stars show enhanced metallicities (red RGB, faint red HB).
These gradients also show up very clearly in the properties of the 358 RR Lyrae stars discovered in Tucana (Bernard et al., 2008). Thanks to the surprisingly large spread in the luminosity of the HB in the region of the instability strip, we studied two components, a bright one and a faint one, finding that they have different pulsational properties. The corresponding period-amplitude diagram discloses interesting features. We identified two distinct sequences corresponding to the fundamental mode RR Lyrae (RR), characterized by a different mean period and a different dispersion around the fit. In particular, we observed that the stars belonging to the brighter group have a longer mean period, as predicted by the non-linear theory of stellar pulsation (Bono et al., 1997). This was also obvious in the mean period of the first-overtone RR Lyrae stars (RR); the “bell-shaped” distribution is shifted toward longer periods for the brighter sample. According to the stellar evolution models, the luminosity of the HB is a function of the metal content of the stars, with the brighter stars more metal-poor than the fainter stars (Cassisi et al., 2004). Note that, despite the fact that stars evolve from the zero age HB locus to higher luminosities (Iben & Rood, 1970), this effect cannot account for the observed distribution of stars in the CMD of Tucana. The fainter, more metal-rich RR Lyrae stars were also found to be also more centrally concentrated than the brighter ones, thus supporting the idea that a younger, more metal-rich population is present in the center of Tucana, together with an older population.
Cetus, the other dSph of our sample, appears to host a more homogeneous sample of RR Lyrae stars (Paper I), with a well-defined period-amplitude relation with a small dispersion. This suggests that the evolutionary history of Cetus was different from that of Tucana. Indeed, this conclusion is supported both by the SFHs we derived for the two galaxies (Paper II), and by the analysis of the RGB bump (Monelli et al., 2010a). The SFH of Tucana displays a stronger initial burst at the oldest possible epochs ( 12.5 Gyr ago), while Cetus experienced a milder initial episode with the main peak delayed by 1 Gyr. Moreover, the RGB of Tucana shows two well defined RGB bumps, associated with two different populations of slightly different metallicity, in excellent agreement with the properties of the RR Lyrae stars. This feature is not present in our HST data of Cetus, again supporting a more uniform dominant population in this galaxy.
Unfortunately, the ACS field of view allows a very limited radial coverage of Cetus, 0.3% of the area inside the tidal radius. In contrast, Tucana was sampled well beyond its core radius, and partially out to the tidal radius. Despite this, Paper I showed that the morphology of the HB in Cetus changes with radius, with the red stars radial profile steeper than that of the blue stars. This again indicates that the younger stars are more centrally concentrated than the older, more uniformly distributed, stars.
In this paper, we investigate the occurrence of radial gradients in the old populations of Cetus using the properties of both RR Lyrae and non-variable stars, derived from wide-field observations collected using VIMOS at the VLT. The paper is organized as follows: §2 summarizes the data acquisition, reduction, and calibration. In §3 we describe the identification of variable stars and the derivation of their pulsational parameters. §4 and §5 summarize the properties of the RR Lyrae stars and Anomalous Cepheids detected, respectively. The radial gradients of both the variable stars and the non-variable stars are presented in §6. The discussion (§7) and our conclusions (§8) close the paper.
2 Data acquisition and reduction
The analysis of variable stars in the Cetus dSph galaxy presented in this paper is based on data collected in service mode using the VIMOS camera mounted on the VLT (ESO program 081.D-0775, P.I.: E. J. Bernard). The images were acquired during six nights between July 27 and August 08, 2008 (see Table 1 for a complete log). The observations were grouped in observing blocks (OBs) of 3 images in and 1 in of 500 s each. Unfortunately, the stringent constraints on seeing to reach the required photometric depth prevented the completion of the originally proposed project. We obtained 47 and 16 images (of the originally proposed 75 and 25 images), though with an excellent average seeing of 0.6. Therefore, the total exposure times are 23,500 and 8,000 sec in the and bands, respectively.


Because of the large gaps between the four VIMOS chips, the galaxy was centered in one of the quadrants (chip 4) to cover the center and most of its main body. This allowed sampling of the major and minor axes out to 15 from the center in the North-East direction, corresponding to 3.4 kpc at a distance of 78040 kpc (Paper I). The location of chip 4 also provided almost full coverage of the ACS field-of-view from Paper I. This allowed us to match the VIMOS and ACS photometry, from which we could estimate the completeness of the variable stars detected (see section 3.2), and compare the mean pulsational properties derived in the two surveys (see section 4.2).
We adopted the images processed by the ESO pipeline, and reduced independently each image of the four chips. The photometry was performed using DAOPHOT IV and ALLFRAME (Stetson, 1994). Individual PSFs were modeled using bright stars covering the whole image, in order to sample the shape variation across the field. Depending on the total number of stars in each chip, the average number of PSF stars ranges from to .
For each chip the input list of stars for ALLFRAME was created using the median image. Due to the heavy contamination of background galaxies, especially in the three external chips, particular attention has been devoted to clean the input list, both through visual inspection of the images and using the shape parameter provided by DAOPHOT (). However, the efficiency of the latter procedure is hampered by the strong variation of the PSF across the field, which causes the stars to be considerably elongated at the corners of the chips, as well as by crowding in the central chip. For these reasons, the final catalogs still contain a significant number of unresolved galaxies (see below).
In order to further clean the CMD from non-stellar sources we selected the stars based on their position in a color-color plane ( vs. ), as detailed in §2.2. To do this, we supplemented the present VIMOS data with images from the Subaru archive. These data consist of 10 images, each with exposure time of 240 s, collected with the Suprime Cam on Aug 2005. The typical seeing was of the order of 0.6, therefore homogeneous with that of the VIMOS observations. Despite the larger area covered by this instrument () compared to that of VIMOS (), the short time baseline of few hours did not allow us to use these data to extend the search for variable stars. Therefore, the data have been used only to build the color-color plane used to clean the CMD from foreground and background objects. The image pre-reduction was performed using the standard SDFRED1 pipeline available for the instrument. The PSF modeling and photometry were carried out following the same recipe as for the VIMOS data. Note that the four VIMOS chips overlap with different Subaru chips. Therefore, for the sake of simplicity, we ran four independent ALLFRAME analyses on the overlapping areas only.
2.1 Photometric Calibration
The photometric calibration was based on standard fields observed as part of the routine calibration plan that ESO offers for service mode observations. We selected the data collected during the night of August 3, 2008, since it was the only photometric night when two fields were observed (PG1633 and PG0231) at slightly different airmasses. One image per band per field was secured, with exposure time of 2 s. Unfortunately, the difference in airmasses (1.16 and 1.30) was too small to obtain a reliable estimate of the atmospheric extinction coefficients. For this reason, we adopted the mean coefficients for P81 from the VIMOS web page111111http://www.eso.org/observing/dfo/quality/VIMOS/qc/zeropoints.html.
We performed photometry with various apertures to establish the optimal one. The catalogues were then matched with the lists available on P.B. Stetson’s web page121212http://www3.cadc-ccda.hia-iha.nrc-cnrc.gc.ca/community/STETSON/standards/. After correcting for the airmass and exposure time, we estimated the calibration curves. Due to the low SNR of the VIMOS images, the B = Bstd – Bobs shows a relatively large dispersion, and since it was not possible to firmly establish any color dependency we estimated a simple zero-point to shift to the standard system. On the other hand, the = Vstd – Vobs presents a much smaller dispersion, and does not show any obvious color trend. Therefore, as for the -band we only applied a zero-point. Note that we repeated this procedure using the two standard fields separately, and then using all the stars together, obtaining the same results within the errors.

To apply this calibration to the individual catalogues of all the Cetus images, we applied the following steps. First, we picked two reference images, one for the B and one for the V band, both observed during the same night as the standard fields. We then rescaled each individual catalogue to the reference one. This was done applying a shift in magnitude, estimated using the brightest stars in common with the reference list. Once every catalogue had been homogenized to the photometric system of the reference images, we applied the calibration previously described to each of them.

Figure 1 shows the residuals for the stars in common between our photometry in the -band and that of McConnachie & Irwin (2006). There seems to be small offsets, which are different for each chip and most likely due to the poor quality of our standard field images. However, none of the results presented in this paper rely on high precision photometry. We thus consider the quality of this calibration to be sufficient for our purposes.
2.2 Color-Magnitude Diagram
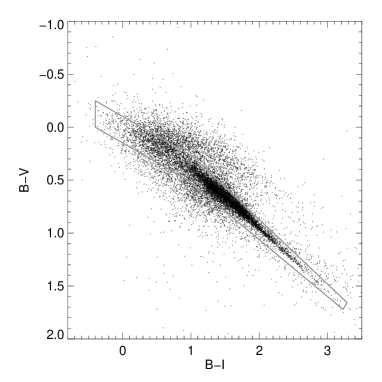
Figure 2 presents the ( vs. ) color-color diagram. We applied a cut in the sharpness parameter ( 0.3) and photometric error (, , 0.3 mag). Two sequences appear in this plane. The first is tight and well defined, extending from to . This is composed of Cetus RGB stars. The second one, less concentrated, is characterized by smaller for fixed , compared to the RGB stars. In this region, background galaxies are expected (e.g., Rocca-Volmerange, Tsalmantza & Kontizas, 2008). The plot also shows the area used to isolate the bona fide Cetus stars. The limits at the blue side have been fixed inspecting both the (, ) and (, ) CMD of chip 4, where the significant number of blue stars helped to define the locus occupied by the HB on the color-color plane. As a cross-check of our approach, we selected a sample of candidate blue HB stars and visually inspected them on both the VIMOS and Subaru images, concluding that 95% of them present a stellar profile, while the nature of only one object was unclear. Moreover, we verified that this selection did not affect the sample of variable stars: in fact, out the 638 detected variables, only one was lost probably due to its proximity to the Subaru chip edge.
Figure 3 shows the , CMD of the rejected (left) and selected (right) objects. In both cases, the CMD of the four chips is shown. The left panels show that very few Cetus RGB stars have been removed from chip 4, while no structures typical of the CMD of a stellar system are evident in the CMDs of chips 1,2,3. The right panels show that our photometry reaches 1.5 mag below the HB, down to mag, which is comparable in depth to the WFPC2 parallel observations presented in Paper I. The CMD of chip 4, centered on Cetus, shows that the RGB and the HB are the most evident features. The other panels show clear evidence of the presence of both the RGB and HB in chip 1 and chip 2, while these are only barely visible in chip 3. A residual component of blue, faint objects () is still present, and particularly evident in the outer chips. It is certainly possible that a number of background galaxies are still polluting the CMD, but other sources might be present.
First, we investigated the level of contamination from foreground Galactic stars, performing a few tests using both the TRILEGAL code131313http://stev.oapd.inaf.it/cgi-bin/trilegal (Girardi et al., 2005) and the Pisa Galactic Model code (Castellani et al., 2002). We verified that both codes predict a very small number of foreground objects (Galactic blue HB or white dwarf stars) in this region of the CMD (10 in the whole VIMOS field). This is not surprising, since the high Galactic latitude of Cetus () implies that a very small portion of Galactic disk is observed along the line of sight.

Alternatively, they could be stars belonging to Cetus. Based on the SFH results (Paper II) we can eliminate the possibility that Cetus hosts a significant population of intermediate-age to young main sequence stars (5 Gyr old). On the other hand, the analysis of the ACS CMD revealed the presence of a sizable population of Blue Stragglers (BSS; Monelli et al., 2012), estimated to be on the order of 5,000 stars in the whole galaxy body. These stars have colors and magnitudes similar to those of a 3 to 5 Gyr old population. However, it is important to note that the luminosity of the brightest BSSs is significantly fainter than the typical blue HB star. This means that, even if BSSs are certainly present (but are expected to be very few in the outer chips) they do not affect the HB nor the RGB morphology.
Finally, crowding is also expected to artificially shift objects outside the main Cetus sequences. A direct comparison of the VIMOS and ACS photometry is shown in Figure 4, where the CMD of the stars in common are presented. It is interesting to note how a number of very faint stars ( or fainter) are detected in the VIMOS field with significantly brighter magnitude. This is certainly due to the effect of crowding, which causes the blending of sources. This shows that at least some of the blue objects with 26 27 are the results of such a mechanism, even though the crowding in the outer regions is expected to be less important.
Overall, the selection performed in the color-color plane removed from the CMD an important fraction of contaminating field sources, at least at the magnitude level of the HB or brighter. The residual sources, whatever their nature, have negligible effect on the HB and RGB morphology. Therefore, we assume that the analysis presented in the following sections (see e.g. §6) is based on a bona fide sample of Cetus stars. However, we stress that the search for variable stars, detailed in the next section, was performed on the complete, unselected , VIMOS catalogue.
3 Variable stars
3.1 Identification and period search
The search for variable stars is based on the Stetson variability index (Stetson, 1996). Figure 5 shows the distribution of as a function of V-band magnitude for chip 4. Stars with at least 10 measurements in each band and 0.4 were considered candidate variables, and are shown as larger gray and black symbols. This value of the index was chosen in order to select most variables while keeping the number of false detections low. The location of the bona fide variable stars (see below), shown as black symbols, indicate that very few have 0.8. The three variables with 0.4 have very noisy light curves due to crowding but are known to be actual variables from the survey of Paper I. We discuss the completeness of our sample in section 3.2.
This process yielded 413, 538, 160, and 1020 candidates in the four chips. Unfortunately, these numbers include a large fraction of background galaxies, as described above, and careful visual inspection of the images and light curves was carried-out to reject false detections. Of these, 48, 22, 20, and 548 turned-out to be actual variable stars for which we could phase the light curve.
The search for periods was performed with the same algorithm as adopted in Paper I. It is based on the Fourier analysis (Horne & Baliunas, 1986) taking into account the information from both bands simultaneously and rejecting outliers with large uncertainty. For each variable, we estimated the mean uncertainty and its standard deviation , and rejected individual data points with error larger than 3- above the mean error. This procedure was iterated 5 times. The code allows interactive refinement by modifying the period until a tighter light curve is obtained. Visual inspection of all of the candidates’ light curves was necessary because, due to the time sampling, the determination of the period for a number of variables was complicated by aliasing problems.
The classification of the candidates was based on their light-curve morphology and position in the CMD. Figure 6 shows the CMD of chip 4 where the variables from all four chips have been overlaid. As expected, for the old age of this galaxy, most variables are also RR Lyrae stars, though there is a large number of variable stars brighter than V24.7. However, visual inspection of the stacked image revealed that most of these are RR Lyrae stars blended with RGB stars and therefore appear significantly brighter and redder than the HB. This is confirmed by the comparison with the stars in common with the ACS catalog: the crossed symbols indicate stars identified as bona fide RR Lyrae stars in the latter, for which the magnitudes were overestimated by up to two magnitudes. However, the identification as Anomalous Cepheid or RR Lyrae star was rather straightforward, since the former have very smooth light curves with large amplitudes and very small photometric uncertainties, unlike the latter.

In total, our catalogue includes 630 RR Lyrae stars, and 8 Anomalous Cepheids. This includes the three RR Lyrae stars with 0.4 that were not detected by the process described above but recovered after comparison with the sample of Paper I. Roughly 75% of these are new discoveries (470 out of 630 RR Lyrae stars, and 5 out of 8 Anomalous Cepheids). The properties of the RR Lyrae stars and Anomalous Cepheids are detailed in Table 2 (a complete version is available on-line) and 3, respectively. Finding charts for the whole sample of variable stars are presented in the Appendix. Given the relatively low quality of the light curves and, more importantly, the short observational timebase, the periods are given with three significant digits or less.
3.2 Completeness
Since chip 4 almost completely overlaps with the location of the field surveyed in Paper I, we can estimate the completeness of our sample by comparing the variables detected in either catalog in the area in common. As expected, all the variables detected in the VIMOS catalog had already been discovered in the ACS data, thanks to the much higher resolution and depth. On the other hand, 20 RR Lyrae variables from the latter catalog were missing in the present sample. We investigated the reasons for their absence and found the following:
-
•
11 are missing from the photometric catalog, either because they are blended with other stars/galaxies (V003, V004, V012, V028, V075, V078, V165, and V169) or located in the corner of chip 4 where the geometric distortions produced elongated PSFs (V192, V194, and V195). These were most likely rejected from the master list based on their shape parameters or could not be fit by ALLFRAME.
-
•
5 did not pass the 0.4 requirement (V002, V006, V059, V106, and V143). Their photometry is contaminated by nearby stars/galaxies and therefore have very noisy light curves. Using the periods from the ACS survey, we were able to fit the light curves and obtain mean magnitudes for the first three, while the light curves for the other two are too noisy and are not included in the present catalog.
-
•
3 have 0.4 but were initially rejected as non variables because of their noisy light curves (V023, V039, V100). Likewise, we could fit the light curves of V039 and V100, while V023 is too crowded.
-
•
V022 lies just outside of the VIMOS field-of-view.
| ID | Type | R.A. | Decl. | Period | log P | AB | AV | Comments | ||
|---|---|---|---|---|---|---|---|---|---|---|
| (J2000) | (J2000) | (days) | ||||||||
| V001 | ab | 0:26:02.84 | -11:03:41.1 | 0.667 | -0.176 | 25.397 | 0.535 | 24.943 | 0.488 | |
| V002 | d | 0:26:02.84 | -11:03:53.5 | 0.4 | -0.4 | 24.115 | 0.122 | 22.999 | 0.030 | blended |
| V005 | ab | 0:26:03.22 | -11:06:08.5 | 0.605 | -0.218 | 25.367 | 1.157 | 25.048 | 0.833 | |
| V006 | ab | 0:26:03.19 | -11:04:23.3 | 0.8 | -0.1 | 25.446 | 0.261 | 25.045 | 0.175 | |
| V007 | ab | 0:26:03.20 | -11:04:39.1 | 0.65 | -0.19 | 25.534 | 0.341 | 25.182 | 0.156 | noisy |
| ID | Type | R.A. | Decl. | Period | log P | AB | AV | Mass | ||
|---|---|---|---|---|---|---|---|---|---|---|
| (J2000) | (J2000) | (days) | (days) | M⊙ | ||||||
| V009 | 0:26:03.75 | 11:04:42.7 | 0.866 | 0.062 | 24.423 | 1.221 | 24.120 | 0.945 | 1.1 | |
| V095 | 0:26:10.06 | 11:03:10.7 | 0.647 | 0.189 | 23.522 | 0.596 | 23.391 | 0.474 | 1.2 | |
| V156 | 0:26:14.20 | 11:03:37.3 | 0.536 | 0.271 | 24.567 | 0.611 | 24.369 | 0.503 | n.c. | |
| V422 | 0:26:14.49 | 11:02:16.9 | 0.57 | 0.244 | 24.416 | 0.974 | 24.188 | 0.627 | n.c. | |
| V564 | 0:26:22.61 | 11:00:09.7 | 0.437 | 0.360 | 24.127 | 0.847 | 24.009 | 0.639 | 1.0 | |
| V567 | 0:26:22.89 | 11:02:48.1 | 0.472 | 0.327 | 24.202 | 1.044 | 24.031 | 0.750 | 1.0 | |
| V601 | 0:26:36.29 | 10:56:10.3 | 0.457 | 0.340 | 23.803 | 1.748 | 23.630 | 1.050 | 1.8 | |
| V623 | 0:26:41.99 | 11:02:28.4 | 0.426 | 0.371 | 24.700 | 1.364 | 24.482 | 1.116 | 1.6 |

Crowding is thus the main reason limiting the completeness of our variable star sample. Assuming the ACS catalog is 100% complete, this means that the present sample is about 89% complete in the region in common with the former (19 RR Lyrae stars missed, out of 172). Since most of the VIMOS field is less crowded than this area, this suggests a completeness of 90% over the surveyed field.
On the other hand, Cetus is a large galaxy and the field-of-view of VIMOS cannot cover it completely. Figure 7 shows the distribution of stars in the field, where open and filled circles mark the position of the RR Lyrae stars, and filled triangles show the Anomalous Cepheids. The black ellipse shows the core radius, while the three gray ones indicate the r=5, 10, and 15 distance from the center. We also over-plotted the isopleth contours from McConnachie & Irwin (2006, their Figure 2). The vertical dashed line on the outermost contour marks the eastern edge of their field. As shown on Figure 7, not only is VIMOS much smaller than the tidal radius (, McConnachie & Irwin, 2006), but it also presents wide gaps between the chips. To estimate the total number of RR Lyrae stars expected within the tidal radius of this galaxy, we used their density profile assuming that they are uniformly distributed in each elliptical bin. Integrating the radial profile of RR Lyrae stars we find an expected total number of 1,200, in good agreement with previous estimates based on the much smaller area covered by the ACS data (1,000; Paper I, ). Thus, we have directly measured the properties of roughly half of all of the RR Lyrae stars in Cetus.
Concerning the other types of variable stars identified in the ACS survey, none of the 4 binary star candidates identified in the ACS photometry were recovered as variables in this survey. Two of them are non-varying in the VIMOS data (V16, V60), probably due to the insufficient sampling of the light curve, while the other two (V18 and V146) are too faint to reliably assess their variable nature. Finally, the long period variable star V17 was not identified as a candidate variable in this survey, probably due to the lower sensitivity and limited time baseline.

4 RR Lyrae stars
4.1 Global properties
From the periods and light curve shapes of the candidates, we identified 506 RR Lyrae stars pulsating in the fundamental mode (RR) and 124 in the first-overtone mode or in both modes simultaneously (RR or RR). Unfortunately, the sub-optimal SNR of our individual data points made the distinction between the latter two types very challenging. In addition, blending tends to increase the noise in the light curves, further complicating the discrimination. Therefore, in the following, only the RR confirmed as such in the ACS sample will be considered bona fide double-mode pulsators. The light curves of all the RR Lyrae stars are shown in Figure 8.
The top panel of Figure 9 presents the period-amplitude diagram (P-AV) for the RR Lyrae stars detected in the four chips. The sequence of the RR is well defined and presents a small dispersion (=0.023 along the x-axis) around the fit (solid black line). However, as already hinted in Paper I, we find that the slope of the fit is unusually steep (slope=18.3), but similar to the P–AV of Carina shown in Dall’Ora et al. (2003). For comparison, the typical P–AV relations for RR stars in OoI and OoII globular clusters from Clement & Rowe (2000) are shown as dashed gray lines, and the non-linear fit to the unevolved RR stars of M 3 as the solid gray line (Cacciari, Corwin & Carney, 2005). None of these provide a good fit to our observed distribution.
While the slope does depend on the adopted mixing-length parameter , in the sense that an increase in the efficiency of convection in the star external layers leads to a steeper P–AV relation (see Bono, Caputo & Di Criscienzo, 2007, and references therein), robust correlations with physical parameters have not been established yet and the suggested ones are still controversial (e.g., Bono et al., 1997; Casagrande et al., 2007).
We note that a few variable stars with unusually low amplitude (mag) appear in the P-AV. We verified that they belong to the group of variables significantly brighter than the HB (see Figure 6) and are blended in the stacked images, and therefore conclude that they are affected by crowding. This causes a reduction of the amplitude, shifting the stars downward in the P-AV plane. However, we can exclude that this bias is artificially steepening the slope of the period-amplitude relation, because the change of slope when removing the blended stars is insignificant. Moreover, the derived estimate of the slope is perfectly consistent with the one obtained from the ACS data (Paper I), where the crowding has a negligible effect.
Figure 9 also shows that the majority of RR stars are concentrated around 0.4 day, although a secondary clump is visible at 0.54 day. This bi-modality of the RR is also obvious in the bottom panel, which shows the histograms corresponding to the stars of the top panel. The dashed black and solid gray histograms show the period distributions for RR and RR stars, respectively, while the shaded histogram represents the distribution of fundamentalized periods: the periods of the RR stars were transformed to their fundamental mode equivalents by adding 0.128 to the logarithm of their periods. While the bi-modality may partly be due to aliasing for the stars with the shorter period, i.e., an alias was chosen instead of the true period, at least for one of these we can be sure of the period since it also appears in the ACS catalog and cannot be phased with a longer period. It is worth mentioning that there have been claims in the literature about the discovery of RR Lyrae stars possibly pulsating on the second overtone, or RR, which are expected to have a period close to 0.3 day (see e.g. Soszyński et al., 2009, 2010), thus similar to the second peak we detected. Given the lack of theoretical support and the possible problems with aliasing, we cannot safely classify them as RR, so in the present work we assume that these stars are bona fide RR stars. We show sample light curves in section 4.4.

4.2 Comparison with the ACS data
The mean periods of the 506 fundamental mode and 124 first-overtone/double-mode RR Lyrae stars are =0.6130.002 d, and =0.3810.003 d, respectively. The RR represents a fraction of of the total number of RR Lyrae stars found in this work. These values agree with those found from the ACS survey (=0.6140.003 d, =0.3910.008 d, ), despite the differences of location in the galaxy and areas covered.
We matched the two catalogues in order to check the consistency of the periods found from each data set. Figure 10 displays the difference in period for the 163 RR Lyrae stars in common, and shows that the agreement is excellent. The main outlier at P0.64 d is actually a blend of two RR stars, that are well resolved in the ACS survey, which prevented us from recovering their periods correctly. The non-negligible dispersion ( d) in the lower panel reflects the fact that the accuracy of the period determination in the present survey is limited to 0.01 d for many of the variables.
In order to refine the periods and mean magnitudes of the RR Lyrae stars in common, we tried to combine the light curves from the two surveys. Unfortunately, crowding in the VIMOS data often produced an offset of the data points toward brighter magnitudes, as well as reduced the apparent amplitude of the pulsations, leading to noisy light curves. In addition, the brighter Anomalous Cepheids, which are less affected by these limitations, revealed that the temporal sampling is another limiting factor. The short length of each observing run compared to the time difference (roughly two years) between the two runs, combined with the sub-optimal SNR of the VIMOS observations even for the bright variables, lead to a comb-like periodogram with dozens of tightly-packed peaks with the same significance. Each of these peaks produced nearly identical light curves, thus preventing us from obtaining more accurate periods.

4.3 Spatial Distribution
Figure 7 shows the distribution of stars in the field. Open and filled circles mark the position of the RR Lyrae stars, while filled triangles show the Anomalous Cepheids. Noticeably, RR Lyrae stars are well distributed everywhere in the field, clearly tracing the extension of Cetus to about 3.4 kpc (15) from its center, at least along the direction of the major axis. However, despite the number of variable stars in the outer chips being relatively small, their spatial distribution appears to be quite asymmetric. In particular, the number of variables in chip 1, located east of the center, is twice as large as the number of variables in chip 3, north of the center. Interestingly, the comparison with the stellar distribution of McConnachie & Irwin (2006) presented in Figure 7, shows that the RR Lyrae stars match well the distribution described by the isopleths, which are based on the star counts of bright RGB stars. In particular, the outermost isopleth includes most of the variables detected in chips 1, 2, and 3, despite its truncation in the east direction.
4.4 Note on individual stars
In this section we report specific comments on individual variable stars of particular relevance. In particular, Figure 11 shows some of the variable stars that have peculiar locations on the CMD or on the P-AV plane. From top to bottom, each pair of panels show the light curve of the following stars:
-
•
V133, V145: These variables belong to the group of RR Lyrae stars significantly shifted toward brighter magnitudes and redder colors. We explain this peculiar location with the blending of sources, responsible for increasing the brightness and reducing the amplitude of variable stars. We visually inspected all the suspected blends in common with the ACS photometry, verifying that they are contaminated in the lower resolution VIMOS images. Note that the vast majority of blended sources are located in chip 4, where crowding is the highest. In addition, the fraction of blended to total number of RR Lyrae stars is the same within the area covered by the ACS and over the whole chip 4.
-
•
V373, V469 are the two variables significantly bluer and brighter than the bulk of RR Lyrae stars, located at ()=(0.122,24.307) and (0.146,24.605), respectively. While the first presents a light curve typical of a RR type, the light curve of the second looks very noisy. Both are blended on the images, and the morphology of the light curve suggests that they are true RR Lyrae stars and not faint Anomalous Cepheids.
-
•
V490, V555 are two examples of RR Lyrae stars with very short periods (P=0.274 and 0.286 d). The nature of these objects is not clear (RR or RR), but the quality of the light curves clearly supports that the variability is real. Visual inspection of the images shows that these stars are isolated. The short period estimated might be an alias of the true period, although it was not possible to derive good light curves with longer periods for any star belonging to this group. Finally, one of these very short-period variable was observed in both the ACS survey and this work (V111), and the only period that could phase both datasets properly is 0.29 day.

5 Anomalous Cepheids
Among the variable stars discovered in this survey, eight were identified as Anomalous Cepheids (see Table 3). Their light curves are shown in Figure 12. The three Anomalous Cepheids already known from Paper I (V009, V095, V156) were recovered, with periods in good agreement with the previously determined values. Despite its unusual light curve, V601 is located at the expected position for an Anomalous Cepheid in both the CMD and the period-luminosity (PL) diagram, so in the following we assume it is a bona fide Anomalous Cepheid. Also note that, given the short period measured (1 d), it seems unlikely that these variables are BL Herculis, that is low-mass, old stars evolving from the blue side of the HB.
To assign the Cepheids to one of the pulsation types (fundamental, F, or first-overtone, FO), one can use either the morphology of the light curve or the location on a PL diagram. The light curves of fundamental mode Anomalous Cepheids are typically very asymmetric, with a sharp rising phase and a slower decline, while they are less asymmetric and closer to a sinusoid for first-overtones. The former are also fainter than the latter at a given period; each type therefore follows a different PL relation. Here the gaps in the light curves partially affected both methods, either by hiding the details of the peak or limiting the accuracy of the calculated mean magnitudes. Combining the clues from both methods, we tentatively classify V9, V422 and V623 as fundamental mode Anomalous Cepheids, and the remaining ones as overtone pulsators. We note that, with this classification, the three fundamental mode Anomalous Cepheids are also the reddest ones, thus in agreement with the fact that they are expected to populate the region of the instability strip close to its red edge.

There is an independent way to simultaneously estimate the pulsation mode and the mass of an Anomalous Cepheid, based on their pulsation properties (Fiorentino et al., 2006), coupled with the period-magnitude-color (pmc) and the period-magnitude-amplitude (pma) relations derived in Marconi, Fiorentino & Caputo (2004). We recall that, while there are pmc relations available for both the fundamental (pmc_F) and first-overtone pulsators (pmc_FO), the pma relation is valid for fundamental pulsators only. Applying the three relations to all the stars, we classified as F only those for which the pma and the pmc_F relations provide consistent mass estimates, within the error bars. The other objects have been classified as first overtones. With this approach, we could classify 4 FO and 2 F Anomalous Cepheids, while 2 remain unclear. Remarkably, the classification based on the morphological and analytical approach coincide for the six stars that have been classified by both methods.
The estimated masses range from 1.0 to 1.8 (see Table 3), with mean value 1.3. The uncertainty in the mass estimate is of the order of 0.1-0.3 . Figure 13 presents the reddeningfree Wesenheit ()141414 The Wesenheit index is defined as , where the coefficient comes from the standard interstellar extinction law (Cardelli, Clayton & Mathis, 1989). magnitude, shifted according to the assumed distance, as a function of the logarithm of the period. The squares mark the stars pulsating in the fundamental mode, the triangles show the first overtones and the open circles are the unclear cases. Note that the period of the first overtones have been fundamentalized adding -0.128 d. The solid and dashed lines present the theoretical relations for the 1.0 and 1.8 , which appear in excellent agreement with the masses derived for individual stars. The dash-dotted line shows the analogous relation for BL Herculis variable stars from Di Criscienzo et al. (2007), and supports our conclusion that our variable stars do not belong to this group.
At present, two different kinds of progenitors are generally invoked to produce Anomalous Cepheids: young, relatively massive stars ( 2 Gyr), or BSS originating from primordial binaries. Excluding the first hypothesis on the basis of the SFH (Paper II) implies that we should expect all the observed Anomalous Cepheids to be the progeny of BSSs. The masses derived for our sample of Anomalous Cepheids (from 1.0 to 1.8 with mean value 1.3), support this occurrence. In fact, they are in excellent agreement with the mass derived for the BSSs (Monelli et al., 2012), which is of the order of 1.0-1.3 , and in any case no larger than twice the mass of the stars evolving at the TO (1.6). It is also worth noting that Anomalous Cepheids are expected to form only in metal-poor populations (0.0008; Fiorentino et al., 2006). The low mean metallicity derived from the SFH (0.0005) is in agreement with this expectation.

6 Radial gradients
Given the large area of the galaxy covered by the present observations, we can now search for gradients in the properties of the stellar populations of Cetus. In particular, we will focus on the HB, RGB, and RR Lyrae stars, in order to check if possible spatial changes with the stellar population properties are reflected in the properties of RR Lyrae stars, as observed in Tucana (Bernard et al., 2008).
In Paper I, we noticed a small but significant gradient of the HB morphology parameter in Cetus, in the sense that the color spread of the HB is larger in the center, as in Tucana. However, the limited field-of-view of the ACS as well as the relatively low number of variable stars prevented us from asserting the veracity of the gradient or detecting a possible change in the mean periods of the RR Lyrae stars.
In the following, we will use different stellar tracers to identify radial gradients in Cetus and to answer the question: is the old population in Cetus similar to that of Tucana, with two clear sub-populations with different properties?
6.1 RGB color distribution
Taking advantage of the large field-of-view of the VIMOS camera, we first investigate if the color distribution of the RGB changes with radius. Figure 14 compares the CMD of the inner () and outer () regions, selected to contain the same number of RR Lyrae stars. Using the 12 Gyr isochrone over-plotted on both panels as reference, a clear difference appears between the two RGBs. The one in the central region presents a larger number of stars on the red side, and a larger color dispersion, especially at the bright end. The blue side looks well populated in both diagrams. To support this occurrence, we selected two regions on the blue and red side of the aforementioned isochrone, and estimated the number of star brighter than =24.5 mag in both CMDs, carefully avoiding the pollution from HB and AGB stars. The ratio of the red to blue stars changes by 0.76 to 0.34 from the inner to the outer region. This supports our earlier conclusion that the more metal-poor population is equally present all over the galaxy body, while the more metal-rich one, responsible for the reddest RGB stars, is preferentially concentrated in the innermost regions. This is in agreement with what is commonly observed in many dwarf galaxies in the LG (e.g., Bellazzini, Ferraro & Pancino, 2001; Harbeck et al., 2001; Tolstoy et al., 2004; Battaglia et al., 2006).
6.2 HB morphology

To quantitatively study the shape of the HB we used the HB ratio (151515 = (BR)/(B+V+R), where B, V, and R are the numbers of stars to the blue, within, and to the red of the instability strip (Lee, 1990).), defined counting the blue, variable, and red stars in the boxes presented in Figure 15. The selection was performed in the (, ) plane for two reasons. First, the larger color baseline helps to separate the features in the CMD, specially limiting the overlap between the red HB and the RGB. Second, the and colors are similar to the and of the ACS data. This allowed us to check our selection in the ACS photometry, verifying that no relevant stars were left outside the box, especially blue stars, while at the same time keeping the number of polluting objects included in the selection low.
In total, we identified 111 and 1527 blue and red HB stars, respectively. Given the 630 RR Lyrae stars identified, this gives a global =0.620.01. If we limit this estimate to the area in common with the ACS only, we find = 0.670.03, in good agreement with that found from the ACS photometry (i.e., 0.74; Paper I, ). Taking into account the higher spatial resolution of this camera, and the better star-galaxy separation, this comparison reinforces the conclusion that our cleaning of the VIMOS CMD was effective in this magnitude range.
However, more interesting results are found when studying the HBR variation as a function of radius. To do this, we divided the clean list of stars into five regions, containing the same total number of stars. Figure 15 presents the CMDs of the five regions. Note that the constraint on the number of stars implies that the area of the ellipses is different, the outermost one being 37 times larger than the innermost one. This also explains the increase in the number of blue objects fainter than the HB for increasing galactocentric radius. For this reason, the value of the HBR may not be reliable in the last radial bin. The variation is presented in Figure 16. The plot shows a clear trend: the larger the distance from the center of the galaxy, the higher the value of the , which changes from 0.75 to 0.1. This means that the HB gets bluer with increasing distance. This is due to the fact that the slightly younger stars populating the red HB are more centrally concentrated. This is in excellent agreement with the variation of the RGB thickness with radius, and similar to what was found in Tucana (Bernard et al., 2008).
6.3 Properties of the RR Lyrae stars
In this section we investigate if the pulsational properties of the RR Lyrae stars of Cetus present any variation with galactocentric radius. Figure 17 shows for both the RR (solid black line) and RR (dashed black line) variables, the mean period, mean amplitude, and the mean magnitude as a function of radius. For each profile, the samples have been selected to contain the same number of variables in each bin. The upper panel shows no obvious radial trend of the mean period. As a comparison, the gray lines show analogous plots based on the ACS measurements, disclosing the same behavior. The mean amplitude and magnitude show a mild trend, in the sense of decreasing amplitudes and increasing (dimming) magnitudes with increasing radius. However, this can be explained with the increasing crowding toward the innermost regions, which artificially pushes stars to brighter magnitude (see also Figure 6) and also reduces the measured amplitude. This interpretation is supported by the comparison with the results from the ACS data (gray lines), which do not present a similar gradient, but rather are consistent with a flat distribution within the errors.
As a further check on the possible presence of period gradients, we verified the radial distribution of the RR stars located on either side of the solid black line fitting the P-AV relationship shown in the top panel of Figure 9. The reason for this test is that the location of the RR stars in the P-AV diagram is a function of metallicity, in the sense that more metal-rich stars tend to have shorter periods and lower amplitudes (Di Criscienzo, Marconi & Caputo, 2004; Sandage, 2004; Kunder et al., 2011). The resulting profiles are virtually indistinguishable, implying that the mean period of the RR stars is homogeneous over the whole galaxy.
We conclude that all of this evidence indicates that the pulsational properties of the RR Lyrae stars are constant, within errors, over the whole body of Cetus, despite the significant change of the HB morphology.
7 Discussion
7.1 Comparing Cetus and Tucana
Cetus and Tucana are the two most isolated dSph galaxies in the LG. Both consist mostly of stars older than 9 Gyr and more metal-poor than Z=0.001. Both galaxies present evidence of stellar population gradients, in the sense that the RGB color spread and the HB morphology change as a function of galactocentric radius. From the ACS data, for Tucana it was clear that the red component of both features vanishes faster, with increasing radius, than the blue one. However, for Cetus, this finding was not as firmly established. Paper I had shown hints of gradients in both the HB and RGB morphologies of Cetus, but the limited area covered by the ACS, extending from 0.5 to 3 core radii, prevented solid conclusions. Due to the large field-of-view of the VIMOS camera, the present photometry supports these findings. In particular, we can confirm the presence of gradients in the HB and RGB of Cetus similar to those of Tucana: the red component of both features is more centrally concentrated than the blue one. Nevertheless, the HB is populated at both sides of the instability strip at any radius. This suggests a more prolonged or more efficient star formation in the innermost regions, implying that the star forming region shrinks toward the center with time. Detailed SFHs calculated at different galactocentric radii (Hidalgo 2011, Hidalgo et al. in prep) supports this scenario. In fact, it shows that the peak of star formation occurred at the same age all over the ACS field, but the star formation was more extended, and produced the most metal-rich stars closer to the center.

Despite the overall similarity, striking differences also appear in the Cetus-Tucana comparison. The most obvious are the different HB morphologies and the properties of the RR Lyrae stars. Tucana has an extended and well populated HB from the blue to the red, with the most peculiar feature of a clear split in magnitude at intermediate colors. This is reflected in the presence of two populations of RR Lyrae stars with different properties and radial distributions, and two sequences of redder stars. This also has a clear counterpart in two RGB bumps (Monelli et al., 2010a). In contrast, the HB of Cetus is more evenly populated in magnitude; it is overall redder than that of Tucana and has a sparsely populated blue side. Only one RGB bump was detected in Cetus. In this paper, we extended the sample of RR Lyrae stars by a factor 3.7 with respect to that presented in Paper I. We substantially confirm the global properties derived on the basis of the smaller and central ACS sample, which pointed to the conclusion that the properties of the Cetus RR Lyrae were homogeneous over the whole area studied. In particular, we did not detect any statistically significant variation of the mean period, amplitude, or mean magnitude of the RR Lyrae stars as a function of the galactocentric radius. We also verified that the slope of the P-AV relation does not change with radius. Interestingly, this relation shows two noteworthy properties: i) the steep slope – and linearity – of the relation, compared to the shallower relation typically found in Galactic GCs and LG galaxies; and ii) the very small dispersion around the mean. While we cannot explain the former, the latter further supports the conclusion that the properties of RR Lyrae stars are indeed homogeneous in the field. All of the evidence suggests that the RR Lyrae stars in Cetus formed from a parent population with homogeneous properties in terms of a small range of age and metallicity.
It is interesting to verify whether the RR Lyrae population of Cetus presents similarities with that of Tucana. We estimated the mean magnitude and dispersion of the RR Lyrae stars by fitting the magnitude histogram. In this case, we used the ACS (table 7 and 8, Paper I, ) sample because of the bias toward brighter magnitudes caused by crowding in the VIMOS data. However, note that this only affects the spread in the VIMOS measurements, because we found that the mean magnitude is consistent with the one from the ACS data within 0.02 mag. The Gaussian profile fit to each histogram gives mean magnitudes in excellent agreement between the two galaxies: = +0.48 and +0.47 for Cetus and Tucana, respectively, with dispersions of =0.07 and 0.09 mag. Interestingly, if we split the sample of Tucana RR Lyrae stars into a bright sample and a faint sample, following Bernard et al. (2008), we find that Cetus has intermediate properties between the two. In fact, the derived mean magnitudes for the bright and the faint groups are = +0.410.05 mag and = +0.540.04 mag, respectively. Moreover, while both galaxies can be classified as Oosterhoff-intermediate objects on the basis of their global properties, Bernard et al. (2008) noted that the two sub-populations of Tucana are closer one to the Oosterhoff I type, and the other to the Oosterhoff II type. This is not the case for Cetus, where the pulsational properties of the bright and faint samples are indistinguishable. Finally, neither of the two P-AV relations of Tucana resemble that of Cetus, which is significantly steeper than both. We conclude that the population of Cetus RR Lyrae stars has no direct counterpart in Tucana.

7.2 The SFHs of Cetus and Tucana
We can try to explain this by correlating all the available evidence with the obtained SFH. We should bear in mind that the main effect of the observational errors, especially at old ages, is mostly to broaden the estimated duration of the events of star formation. Our technique to estimate this effect (see Monelli et al., 2010b, in particular Fig. 10) disclosed that the main event of star formation lasted between 1 and 3 Gyr for both galaxies. Moreover, the star formation rate was significantly stronger in Tucana than in Cetus 13 Gyr ago, while it was the opposite 1 Gyr later. At some point in between, the two galaxies had comparable activity. This is reflected in the present-day properties that we observe. It must be stressed that, in general, the analysis of the HB morphology is a very complicated matter (see, e.g., Gratton et al., 2010, and references therein) that depends not only on the evolution of stars (which in turn depends on age, metallicity, chemical peculiarities in the He and CNO abundances), but also on uncertainties introduced by other mechanisms like the mass loss during the RGB phase (as widely discussed for globular clusters). However, there is a fundamental difference between globular clusters and dwarf galaxies like Cetus and Tucana. While the formation of a cluster is a very rapid event, resulting in a very limited age distribution, in the case of a dSph, the star formation occurred over a much longer period of time. Moreover, in general, dSphs experienced important early chemical evolution. In particular, both Cetus and Tucana present a well defined age-metallicity relation (Monelli et al., 2010b). These two observations together imply that the stars populating the HB at the present time must be the evolution of progenitors characterized by considerable spreads in age and chemical composition. It is, therefore, reasonable to expect that, in dSph galaxies, the two parameters age and metallicity, dominate over other possible parameters influencing HB morphology. The above provides reasonable explanation for all of the observations of Cetus and Tucana. The following discussion enters a more speculative realm.
Starting from this scenario, and assuming standard mass loss on the RGB over the relevant time period, we would expect a general ranking along the HB. If the HB we observe today is the result of the superposition of simple stellar populations with different ages and metallicity, it is reasonable to suppose that the blue HB stars would proceed from more metal-poor, older and less massive progenitors, while the reddest ones would be younger, originally more massive and, due to the chemical evolution of the host galaxy, more metal-rich. Therefore, the very strong initial burst in Tucana might have produced an important population of metal-poor stars, which are expected to populate the extended blue HB (and correspondingly the blue RGB), the population of both bright RR Lyrae and bright red HB stars and the brighter RGB bump. This first event, in turn, caused an important self-enrichment on very short time scales, fast enough to have a detectable and discrete change in the mean metallicity, which appears in the faint population of RR Lyrae stars, the faint red HB (and correspondingly the red RGB), and the second RGB bump. Following the same reasoning, the lower initial activity in Cetus would explain the few blue, old and metal-poor HB stars, while the subsequent stronger star formation might be responsible for the overall redder HB morphology. As in the case of Tucana, Cetus shows an age-metallicity relation, but the metallicity evolution must have been such that the metallicity increment during the time in which the progenitors of the present day RR Lyrae stars were formed was not enough to produce RR Lyrae with a range of properties as wide as those of Tucana.
All this evidence suggests that the RR Lyrae stars in these two dSph are not representative of, generically, the whole “old” population, but are rather a “picture” of a well defined sub-population (one in the case of Cetus, two in the case of Tucana) characterized by a relatively small age and metallicity dispersion, in the older portion of the population of each galaxy. This would also be in agreement with the fact that the two groups of RR Lyrae stars in Tucana have different radial distributions: the faint, more metal-rich stars of the second generation are more concentrated to the center.
We stress that this scenario is certainly simplified and, at some level, conjectural. DSph galaxies are more complex systems than globular clusters, and a full modeling of the HB, taking into account all the relevant parameters affecting its morphology, would be required for further insight. However, note that a complete age-metallicity degeneracy cannot be at work, otherwise we would not detect the discrete nature of the Tucana HB, but rather a continuous distribution of stars.
What physical processes led to the differences in evolution between the two galaxies is not immediately obvious. Two possible mechanisms could be (i) differences in early gas infall, or, in the case of Tucana, (ii) the two populations may be due to a very early merger. Perhaps the most important point is that the early evolution histories of these two systems are not identical. Even systems this small show a variety in their early evolution.
8 Conclusions
We analyzed time-series , VLT/VIMOS data of the isolated dSph galaxy Cetus. The main results of this work are:
-
•
we detected 638 variable stars, all bona fide members of Cetus: 630 RR Lyrae stars (470 new discoveries) and 8 Anomalous Cepheids (5 new). We provide a complete catalogue of periods, amplitudes, and mean magnitudes;
-
•
we confirm the results presented in Paper I concerning the mean pulsational properties of RR Lyrae stars. In particular, Cetus is, similar to other satellites dSph galaxies, of the Oosterhoff intermediate type. The P-AV relation is linear, and presents a particularly steep slope and limited dispersion, similar to that of Carina;
-
•
The wide field of view of the VIMOS camera allowed us to detect a clear gradient in the HB and RGB morphologies. In particular, both features get bluer, on average, for increasing distance from the center of Cetus, due to the steeper radial profile of the red component;
-
•
On the contrary, the pulsational properties of RR Lyrae stars did not reveal any obvious gradient. The mean magnitude, the mean amplitude, and the mean period are consistent with a flat distribution as a function of radius;
-
•
The homogeneity of the RR Lyrae population of Cetus is different from that of Tucana. We interpret this in concordance with the SFHs derived for the two galaxies (Paper II, Monelli et al. 2010b). Different observables strongly suggest the presence of two distinct old populations in Tucana, with the second slightly younger and slightly enriched from the ejecta of the first one, while Cetus had a smoother evolution reflected in more homogeneous present-day properties. Nonetheless, it is interesting to stress that the pulsation properties of RR Lyrae stars in Cetus do not resemble either population of Tucana, being a purely intermediate Oosterhoff type. All of the evidence also suggests that, despite the similar ranges of age and metallicity of the stellar populations in Cetus and Tucana, the details of the differences in early SFH clearly show up in the morphology of the HB and the properties of RR Lyrae stars.
acknowledgments
We thank Michele Cignoni for performing simulations of the Galactic field using the Pisa Galactic Model code, and the anonymous referee for useful comments. Support for this work was provided by the IAC (grant 310394), the Education and Science Ministry of Spain (grants AYA2007-3E3506, and AYA2010-16717), and a rolling grant from the UK Science and Technology Facilities Council. S.C. warmly thanks INAF for the financial support through the PRIN INAF 2009 (PI: R. Gratton).
References
- Aparicio & Hidalgo (2009) Aparicio A., Hidalgo S. L., 2009, AJ, 138, 558
- Battaglia et al. (2006) Battaglia G. et al., 2006, A&A, 459, 423
- Bellazzini, Ferraro & Pancino (2001) Bellazzini M., Ferraro F. R., Pancino E., 2001, MNRAS, 327, L15
- Bernard (2009) Bernard E. J., 2009, PhD Thesis, Universidad de La Laguna
- Bernard et al. (2008) Bernard E. J. et al., 2008, ApJ, 678, L21
- Bernard et al. (2010) Bernard E. J. et al., 2010, ApJ, 712, 1259
- Bernard et al. (2009) Bernard E. J. et al., 2009, ApJ, 699, 1742
- Bono et al. (1997) Bono G., Caputo F., Castellani V., Marconi M., 1997, A&AS, 121, 327
- Bono, Caputo & Di Criscienzo (2007) Bono G., Caputo F., Di Criscienzo M., 2007, A&A, 476, 779
- Cacciari, Corwin & Carney (2005) Cacciari C., Corwin T. M., Carney B. W., 2005, AJ, 129, 267
- Cardelli, Clayton & Mathis (1989) Cardelli J. A., Clayton G. C., Mathis J. S., 1989, ApJ, 345, 245
- Casagrande et al. (2007) Casagrande L., Flynn C., Portinari L., Girardi L., Jimenez R., 2007, MNRAS, 382, 1516
- Cassisi et al. (2004) Cassisi S., Castellani M., Caputo F., Castellani V., 2004, A&A, 426, 641
- Castellani et al. (2002) Castellani V., Cignoni M., Degl’Innocenti S., Petroni S., Prada Moroni P. G., 2002, MNRAS, 334, 69
- Cignoni & Tosi (2010) Cignoni M., Tosi M., 2010, Advances in Astronomy, article id.158568
- Clement & Rowe (2000) Clement C. M., Rowe J., 2000, AJ, 120, 2579
- Cole et al. (2007) Cole A. A. et al., 2007, ApJ, 659, L17
- Dall’Ora et al. (2003) Dall’Ora M. et al., 2003, AJ, 126, 197
- Di Criscienzo et al. (2007) Di Criscienzo M., Caputo F., Marconi M., Cassisi S., 2007, A&A, 471, 893
- Di Criscienzo, Marconi & Caputo (2004) Di Criscienzo M., Marconi M., Caputo F., 2004, ApJ, 612, 1092
- Dolphin (2002) Dolphin A. E., 2002, MNRAS, 332, 91
- Fiorentino et al. (2006) Fiorentino G., Limongi M., Caputo F., Marconi M., 2006, A&A, 460, 155
- Fraternali et al. (2009) Fraternali F., Tolstoy E., Irwin M. J., Cole A. A., 2009, A&A, 499, 121
- Gallart et al. (2004) Gallart C., Aparicio A., Freedman W. L., Madore B. F., Martínez-Delgado D., Stetson P. B., 2004, AJ, 127, 1486
- Gallart, Zoccali & Aparicio (2005) Gallart C., Zoccali M., Aparicio A., 2005, ARA&A, 43, 387
- Girardi et al. (2005) Girardi L., Groenewegen M. A. T., Hatziminaoglou E., da Costa L., 2005, A&A, 436, 895
- Gratton et al. (2010) Gratton R. G., Carretta E., Bragaglia A., Lucatello S., D’Orazi V., 2010, A&A, 517, A81
- Harbeck et al. (2001) Harbeck D. et al., 2001, AJ, 122, 3092
- Hidalgo (2011) Hidalgo S. L., 2011, in EAS Publications Series, Vol. 48, EAS Publications Series, M. Koleva, P. Prugniel, & I. Vauglin, ed., pp. 37–42
- Hidalgo et al. (2011) Hidalgo S. L. et al., 2011, ApJ, 730, 14
- Holtzman et al. (1999) Holtzman J. A. et al., 1999, AJ, 118, 2262
- Horne & Baliunas (1986) Horne J. H., Baliunas S. L., 1986, ApJ, 302, 757
- Iben & Rood (1970) Iben, Jr. I., Rood R. T., 1970, ApJ, 161, 587
- Kunder et al. (2011) Kunder A. et al., 2011, AJ, 141, 15
- Lee (1990) Lee Y.-W., 1990, ApJ, 363, 159
- Lewis et al. (2007) Lewis G. F., Ibata R. A., Chapman S. C., McConnachie A., Irwin M. J., Tolstoy E., Tanvir N. R., 2007, MNRAS, 375, 1364
- Marconi, Fiorentino & Caputo (2004) Marconi M., Fiorentino G., Caputo F., 2004, A&A, 417, 1101
- McConnachie & Irwin (2006) McConnachie A. W., Irwin M. J., 2006, MNRAS, 365, 1263
- Monelli et al. (2010a) Monelli M., Cassisi S., Bernard E. J., Hidalgo S. L., Aparicio A., Gallart C., Skillman E. D., 2010a, ApJ, 718, 707
- Monelli et al. (2012) Monelli M. et al., 2012, ApJ, 744, 157
- Monelli et al. (2010b) Monelli M. et al., 2010b, ApJ, 722, 1864
- Monelli et al. (2010c) Monelli M. et al., 2010c, ApJ, 720, 1225
- Monelli et al. (2003) Monelli M. et al., 2003, AJ, 126, 218
- Noël (2008) Noël N. E. D., 2008, PASP, 120, 1355
- Noël et al. (2009) Noël N. E. D., Aparicio A., Gallart C., Hidalgo S. L., Costa E., Méndez R. A., 2009, ApJ, 705, 1260
- Rocca-Volmerange, Tsalmantza & Kontizas (2008) Rocca-Volmerange B., Tsalmantza P., Kontizas M., 2008, in SF2A-2008, C. Charbonnel, F. Combes, & R. Samadi, ed., p. 33
- Sandage (2004) Sandage A., 2004, AJ, 128, 858
- Soszyński et al. (2010) Soszyński I., Udalski A., Szymański M. K., Kubiak J., Pietrzyński G., Wyrzykowski Ł., Ulaczyk K., Poleski R., 2010, Acta Astron., 60, 165
- Soszyński et al. (2009) Soszyński I. et al., 2009, Acta Astron., 59, 1
- Stetson (1994) Stetson P. B., 1994, PASP, 106, 250
- Stetson (1996) Stetson P. B., 1996, PASP, 108, 851
- Stinson et al. (2009) Stinson G. S., Dalcanton J. J., Quinn T., Gogarten S. M., Kaufmann T., Wadsley J., 2009, MNRAS, 395, 1455
- Tolstoy et al. (2004) Tolstoy E. et al., 2004, ApJ, 617, L119
- van den Bergh (1999) van den Bergh S., 1999, AJ, 117, 2211
Appendix A Finding Charts
