Wide-Field Survey of Emission-line Stars in IC 1396
Abstract
We have made an extensive survey of emission-line stars in the IC 1396 H ii region to investigate the low-mass population of pre-main sequence (PMS) stars. A total of 639 H emission-line stars were detected in an area of 4.2 deg2 and their -photometry was measured. Their spatial distribution exhibits several aggregates near the elephant trunk globule (Rim A) and bright-rimmed clouds at the edge of the H ii region (Rim B and SFO 37, 38, 39, 41), and near HD 206267, which is the main exciting star of the H ii region. Based on the extinction estimated from the near-infrared (NIR) color–color diagram, we have selected pre-main sequence star candidates associated with IC 1396. The age and mass were derived from the extinction corrected color-magnitude diagram and theoretical pre-main sequence tracks. Most of our PMS candidates have ages of 3 Myr and masses of 0.2–0.6 M☉. Although it appears that only a few stars were formed in the last 1 Myr in the east region of the exciting star, the age difference among subregions in our surveyed area is not clear from the statistical test. Our results may suggest that massive stars were born after the continuous formation of low-mass stars for 10 Myr. The birth of the exciting star could be the late stage of slow but contiguous star formation in the natal molecular cloud. It may have triggered to form many low-mass stars at the dense inhomogeneity in and around the H ii region by a radiation-driven implosion.
1 Introduction
As observational instruments have developed, systematic studies of stellar clusters have revealed many low-mass populations of pre-main sequence (PMS) stars in massive star-forming regions. It has been found that most stars are born in groups or clusters, not in isolated regions (e.g., Lada & Lada, 2003; Allen et al., 2007). Stellar clusters provide a tool for investigating stellar evolution, because they are considered to constitute a natural sample of coeval stars at the same distance and with the same chemical composition. Young clusters appear to be a snapshot of stellar evolution over a wide range of masses. However, a careful study of the Orion Nebula Cluster (Hillenbrand, 1997) has revealed that the younger stars ( 0.3 Myr ) are clustered towards the center of the Trapezium Cluster (a projected distance of 0.3 pc from C Ori), while the older stars are widely distributed. This indicates that star formation has recently occurred in the center of the cluster and that star formation with a low rate has taken place over a long time scale over the whole region. Muench et al. (2008) has suggested that there is no physical reason to separate the Orion Nebula Cluster and the Trapezium Cluster, and the entire region is a single contiguous star forming event. There are also examples of stellar clusters still producing massive stars. Cep A HW2 is the brightest radio source in Cep A (Hughes & Wouterloot, 1984), an active star forming region within the molecular cloud associated with the cluster with an age of 5.5 Myr (Cep OB3b; Jordi et al., 1996). Jiménez-Serra et al. (2007) found a hot core internally heated by a massive protostar, and a circumstellar rotating disk around HW2. This suggests that a massive star is still forming in the young cluster. Furthermore, X-ray stars with a mid-infrared (MIR) spectral energy distribution of young stellar objects (YSOs) around HW2 have been reported by Pravdo et al. (2009). It is most likely that a low-mass PMS population was already formed before the formation of high-mass stars. Once a high-mass star starts to radiate significant amounts of UV radiation, the surrounding material is affected dramatically and the natal molecular cloud is disrupted and the birth of the next generation of stars might be triggered.
The apparent age spread observed in the color-magnitude diagram of young stellar groups has been investigated by Burningham et al. (2005). They found that the spread could not be explained adequately by the combination of the binarity, photometric uncertainty and variability of the members. In the case of the Ori young stellar group, they suggested an age spread of 2–4 Myr. A possible explanation is that accretion from a disk causes scatter of the stellar continuum light (Tout et al., 1999). However, another possibility is that stars in a cluster are formed over a period of time. Three-dimensional numerical simulations including protostellar outflow feedback show that the cluster-forming clumps can maintain a quasi-virial equilibrium state for several periods of free-fall time (Nakamura & Li, 2007), suggesting continuous star formation. Wang et al. (2010) also demonstrated outflow-regulated massive star formation. The episodic star formation causes an intrinsic spread in age and hence in the position in the color-magnitude diagram.
We have reported that young stars near the exciting star of the W5E H ii region are systematically older than those near the edge of the H ii region (Nakano et al., 2008). We further suggested that the birth of the most massive star occurs in the late stage of star formation in the cluster. Although the structure of the H ii region is simple to investigate, the distance of W5 is large, at 2.3 kpc, and therefore it is not easily accessible to the wide range of stellar masses.
IC 1396 is a ring-shaped giant H ii region in Cep OB2 with a size of about 3, located at the edge of the Cepheus bubble, which is a large, far-infrared shell with a diameter of 10 (Kun et al., 2008). The structure of IC 1396 is rather simple and is powered by the multiple O star system HD 206267 (RA = 21h38m5762, Dec = +5729205), which is located near the geometrical center of IC 1396 in the young cluster Trumpler 37. The bright members of Trumpler 37 have been investigated by many authors (e.g., Garrison & Kormendy, 1976; Marschall et al., 1990; de Zeeuw et al., 1999; Contreras et al., 2002). There are a number of bright-rimmed globules (Pottasch, 1956) at its periphery. Its modest distance ( 1 kpc) and low foreground extinction (v 1 mag) make IC 1396 a good subject for our study of low-mass population associated with OB stars. The mean distance of 76 members of Cep OB2 derived from the Hipparcos parallax is 615 pc (de Zeeuw et al., 1999). Contreras et al. (2002) made a color-magnitude diagram of the intermediate-mass members and fitted them to main-sequence stars at 870 pc. In this paper, we adopt 870 pc, which is frequently quoted by the recent works (e.g., Sicilia-Aguilar et al., 2004) .
H emission, a characteristic of T Tauri stars (TTS), is radiated from the solar-type magnetic activity in weak-lined T Tauri Stars (WTTS) or the chromospheric activity and magnetospheric accretion shock in classical T Tauri stars (CTTS) (Briceño et al., 2007). Thus, a survey of H emission-line stars is a powerful method for searching for young low-mass populations (e.g., Nakano et al., 1995). Recently, NIR observations with array detectors and MIR observations from space (e.g. with the Spitzer Space Telescope) have advanced the protostar survey in the dense parts of giant molecular clouds. However, the H survey is still useful in areas with moderate or low extinction, and it is also a complementary method to search for PMS populations in a wide and rather dispersed region. Here, we report an extensive survey of emission-line stars in the IC 1396 H ii region and discuss the formation sequence of low and high mass populations in IC 1396.
2 Observations
Slitless grism spectroscopic searches for H emission objects in IC 1396 were conducted in 2004 and between 2006 and 2009 using the Wide Field Grism Spectrograph 2 (WFGS2; Uehara et al., 2004) at the f/10 Cassegrain focus of the University of Hawaii (UH) 2.2-m telescope on Mauna Kea. The log of the observations is given in Table 1. A 300-line mm-1 grism was used in conjunction with a wide H filter to isolate the first-order spectra between 6265–6765 Å. A Tektronix 20482048 CCD was used as the detector, yielding a dispersion of 3.8 Å pixel-1, a pixel scale of 034 and an instrumental field of view of 115 115
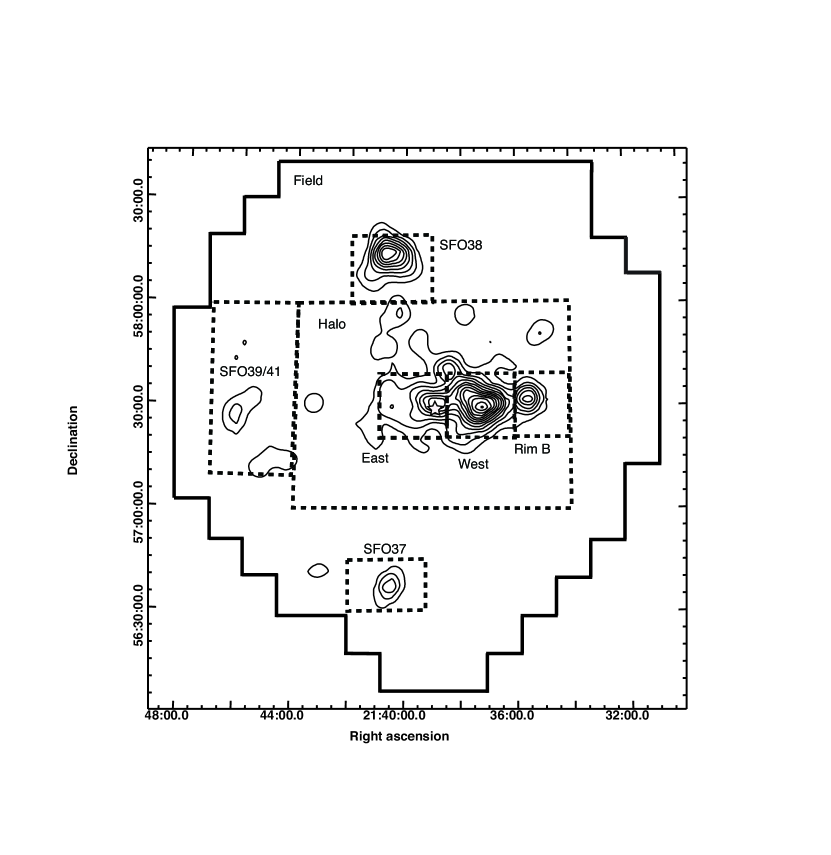
The whole IC 1396 region was covered by 157 field positions including overlapping areas. About 4.2 deg2 were observed, both in the grism and the direct imaging mode of WFGS2. Figure 1 shows the boundary of the observed fields and indicates the names of bright-rims, dark clouds, and two O stars in the IC 1396 H ii region. For each field, we have taken a single 30-s exposure in the direct mode with a wide H filter. Then, we inserted a grism and obtained three dithered frames of 300-s exposures for slitless spectroscopy. Direct images with an -band filter were also taken with WFGS2 in 2008 August and 2009 August. Three 30-s exposures were made for each field. The -band flux is less affected by excess emission of the circumstellar disk, H emission, and continuum veiling of CTTS. Thus, -band photometry is useful as a measure of the underlying photosphere of CTTS (e.g., Cieza et al., 2005). 3–5 standards for the Sloan Digital Sky Survey (SDSS) system (Smith et al., 2002) were observed each night at nearly the same airmass (difference of 0.1) as the targets. We used a dome flat for flat fielding.
The data were reduced using the IRAF software package. We applied the standard procedure for bias subtraction and flat fielding. For each field, three dithered grism frames are combined into one frame by referring the position of the H emission or absorption line of the star(s) in the field. We picked all stars in each wide H image using the DAOFIND package and extracted their one-dimensional spectra from the grism image. We visually investigated the spectra for the presence of the H emission line and found 639 H emission-line objects in the whole surveyed area. We used the SPLOT package to measure the equivalent width of the H line in the spectra. Their coordinates were determined by the astrometric calibration tool of the Starlink program GAIA using USNO-B catalog stars as the reference in the field. All of the photometric measurements were made with the APPHOT package for aperture photometry. The typical seeing of the image was 2.7–3.0 pixels. We used a 4-pixel diameter aperture for the aperture photometry. We then calibrated the photometric values to the SDSS system via standards. In general, the run was of high quality, but thin cloud affected a few fields. We checked the stability of the magnitude for three direct images in each field and examined the quality of the measurement. Excluding stars with saturated images or images with low photometric quality, we measured 586 stars in 13.6 19.3.
3 Results
3.1 Spatial Distribution
We list the 639 H stars in Table 2. The table shows the (1) identification number, (2, 3) J2000 coordinates, (4) -band magnitudes and (5) equivalent widths of H emission (Å). The H equivalent widths were measured for 608 stars. We compared our list of emission stars with the Two Micron All Sky Survey (2MASS) Point Source Catalog with 12 stars supplemented by the 2MASS 6x Point Source Catalog. We found matches for 617 stars with 2MASS stars within 2 and determined that 548 of these have good quality photometry (quality flag AAA). Due to small separation angles or positional uncertainties, two pairs of H stars are identified with single 2MASS sources (No. 250/251 with J21381703+5739265, and No. 600/601 with J21451578+5717392). We have included these stars in the above number. We list the 2MASS designation of the NIR counterpart, photometric quality, magnitude, and –, – colors in columns (6)–(10) of Table 2. v estimated from the NIR color–color diagram (see §4.1) is also listed in column (11). About 70% of our H stars cannot be identified with known sources in the SIMBAD database. The identification in the literature or comments are listed in column (12).
Figure 2a shows the spatial distribution of emission-line objects while Figure 2b represents the contour map of the number density of the detected emission-line objects with the kernel method (Gomez et al., 1993). We adopted a Gaussian shape for the density distribution of the kernel with a smoothing parameter of h24. The isolines are drawn at intervals of 150 stars per deg2, which is about three times the average number density in the field region (see Table 4), starting from 100 stars per deg2. It is clear from Figure 2 that the distribution of emission-line stars is far from uniform. To demonstrate the different properties in the different areas, we divided the surveyed field into the following subregions according to the number density of H stars. The primary peak of the most rich aggregate (the West region) is located between the main exciting star HD 206267 and the western elephant trunk globule Rim A (IC 1396A). The secondary peak is at the opposite side, to the east of HD 206267 (the East region), and the third peak is at the south of the bright-rimmed globule SFO 38 (SFO: Sugitani et al. 1991, the SFO38 region). Other small aggregates of emission-line stars are located near SFO 37 (the SFO37 region), SFO 39 and SFO 41 (the SFO39/41 region), Rim B (the Rim B region), and at the north of the B 365 dark cloud (B: Barnard 1927) or around (21h35m, 57). See Figure 1 for references. The West and the East regions appear to be surrounded by a halo-like structure (the Halo region). Some H stars appear to be associated with other small bright rimmed clouds such as Rim C and SFO 34 (Rim D). We defined the rest of the region as the field area (the Field region).
3.2 Source Identification
Our sample of H stars contains two carbon stars CGCS 5454 (No. 575) and CGCS 5401 (No. 287), and one Be/X-ray binary Cep X-4 (No. 340), whose distance was confirmed to be 3.8 kpc by Bonnet-Bidaud & Mouchet (1998). Our sample of H stars also contains a candidate of the exciting source of the Herbig–Haro object HH 588 (No. 436), which is deeply embedded in SFO 37 (Ikeda et al., 2008), one Herbig Ae/Be star (HAeBe) MVA 426 (No. 236) (Sicilia-Aguilar et al., 2007), and 100 TTS including Class-II, III, and transient objects (Sicilia-Aguilar et al., 2006b, 2007; Getman et al., 2007; Reach et al., 2004; Mercer et al., 2009; Barentsen et al., 2011).
An objective prism survey using the Schmidt telescope Kun (1986) detected 155 H emission objects in IC 1396 and an additional 65 emission stars were reported in a subsequent paper (Kun & Pásztor, 1990). Their spatial distribution shows no noticeable concentration or clustering. Out of 220 Kun H stars, 150 stars are located in our observed field; however, only 11 stars (No. 287 = Kun 80, No. 13 = Kun 171, No. 340 = Kun 193, No. 618 = Kun 215, No. 49 = Kun 308, No. 80 = Kun 310, No. 97 = Kun 314 S, No. 252 = Kun 321, No. 318 = Kun 325, No. 410 = Kun 330, No. 487 = Kun 332) are identified among our H stars. Although Kun 315 (LkH 349) is not included in Table 2, our grism spectrum appears saturated but indicates a P Cyg-type H profile. Kun 320 (GL Cep) and Kun 337 (HD 239745) are also too bright and saturated in our grism spectra, and the positions of Nos. 77, 230, 12, and 266 are offset from Kun 53, 73, 170, and 322 by around 10. Even if we include these seven stars, only 12% of stars can be identified with Kun stars. The rest of the Kun stars show obvious H absorption or no emission, and 10 of them show the spectra of M-type stars in our grism spectra. Medium resolution spectroscopy by Balázs et al. (1996) show that Kun 193 (No. 340; CepX-4) exhibits conspicuous hydrogen emission, but 34 other Kun stars do not. They suggested that the lack of emission is due to the time variability of H stars. Contreras et al. (2002) failed to detect H emission in spectroscopic observations of 20 selected Kun stars, only finding emission in Kun 314 S. Thus, they suggest that the original identification of emission was incorrect. Our result is consistent with their suggestion.
Sicilia-Aguilar et al. (2004, 2005) extensively studied the low-mass population of the two clusters in Cep OB2, Trumpler 37 and NGC 7160, to investigate the disk evolution at ages 1–10 Myr. For Trumpler 37, they have performed optical photometry and multifiber spectroscopy in a square about 45 per side, centered at HD 206267. Approximately 45% of the low-mass population indicate NIR excesses, suggesting heated dust in the circumstellar disk. Finally, Sicilia-Aguilar et al. (2006b) examined the membership using H emission, Li 6707 absorption lines, and radial velocities as membership criteria. They identified accretion properties in 170 members in the central part of IC 1396. 53% of the members of this list are also detected in our survey. The equivalent width of the H emission-line of our candidates is consistent with that of Sicilia-Aguilar et al. (2005), except for only a few stars. We have detected 90% and 30% of Class-II and Class-III objects in their list as H stars. This result is naturally explained by the higher detectability of weak emissions in their high dispersion slit spectroscopy.
Using archival data of Chandra and Spitzer, Mercer et al. (2009) have identified 25 X-ray sources as cluster members, which have MIR colors of CTTS or WTTS in the 10 8 region around HD 206267. Their sources consist of five CTTS and 20 WTTS. Although four of the CTTS were detected in our observations, only two WTTS match our H stars.
Getman et al. (2007) obtained X-ray images of the bright rimmed cloud SFO 38 (IC 1396N) using the Chandra ACIS detector. They identified X-ray sources in the area of a square of 5 with the Spitzer IRAC sources and concentrated their study on 25 sources associated with the globule SFO 38. Of the 117 X-ray sources, 17 sources are identified with our H stars and five of these X-ray sources are associated with H stars in the SFO 38 cloud.
3.3 Comparison with IPHAS Sources
In the recent paper by Barentsen et al. (2011), they identified 158 PMS candidates in a 7 deg2 area towards IC 1396 by using the data of IPHAS (the Isaac Newton Telescope/Wide Field Camera Photometric H Survey; Drew et al., 2005). Out of 143 PMS candidates identified by Barentsen et al. (2011) in our field of view, 119 stars are in common with our H sample. We examined the common H stars in IPHAS to confirm our photometric quality. The IPHAS magnitude is based on the Vega magnitude and hence we converted it to AB magnitude (González-Solares et al., 2008). Barentsen et al. (2011) restricted their sample to sources with 20 mag, which corresponds to 19 mag if we adopt the colors of known T Tauri stars in their figure 4. For most of the stars in common, our -magnitudes are consistent with those in the IPHAS catalog within 0.1 mag. Although a large scatter ( = 0.3 mag) of the magnitude differences is found, it may be due to the photometric variability of young stars.
Barentsen et al. (2011) compared their objects with the members confirmed by Sicilia-Aguilar et al. (2006b), and estimate the completeness. 89% of PMS candidates with the H EW 30 Å identified by Sicilia-Aguilar et al. (2006b) are recovered by Barentsen et al. (2011). We also estimated the completeness of our survey with the same manner. For the PMS candidates including smaller EW ( 10 Å ), the fraction of recovered sources by Barentsen et al. (2011) falls off to 50%. On the other hand, the fraction of recovered sources with EW 10 Å maintains 86% (51 out of 59) in our sample. We confirmed that none of their rejected candidates ( 30 stars ) by Barentsen et al. (2011) were included in our list. Thus, our observations are more sensitive than their survey for the emission-line stars with small H equivalent width.
3.4 Identification with AKARI Sources
We identified 27 sources among our H stars with the sources of the point source catalog of the MIR All-Sky Survey obtained with the infrared camera (IRC) on board the AKARI satellite (Ishihara et al., 2010), with position differences of less than 5. Table 3 gives the AKARI 9- () and 18- () magnitudes and their 2MASS photometric data. Their positions on (–) vs. (–), (–) vs. (–), and (–) vs. (–) diagrams are shown in Figure 3. The criteria for extracting TTS from these diagrams, proposed by Takita et al. (2010), are also shown as a dashed line (Figure 3a) or areas (Figure 3b,c). The colors of three stars (Nos. 287, 309, 575) are consistent with cool carbon stars, and about 20 stars are pre-main sequence stars. The bright source No. 436 is the candidate for the exciting source of the HH 588 object. Figure 4 shows the contour map of the number of emission-line stars overlaid on a false-color map using the IRC on AKARI. Blue is for 9 and red is for 18 . Probable members of 66 B–F stars from Contreras et al. (2002), supplemented by 8 OB stars from Hipparcos results (de Zeeuw et al., 1999), are also shown as filled blue circles. As for H stars in the West and East regions, high or intermediate-mass stars are concentrated near the center of the large dust cavity, which is presumably swept up by the expansion of the H ii region. We note that their distribution is slightly shifted to the east of HD 206267.
4 Analysis & Discussion
4.1 Probable Members
Our list of H stars in Table 2 may contain foreground or background, magnetically active field stars. We estimated the number of unrelated main sequence stars with enhanced chromospheric and coronal activity. Within the 4.2 deg2 field towards the IC 1396, the Besancon model of the Galactic stellar populations (Robin et al., 2003) predicts 4000 and 1700 dM stars down to 20 mag in the foreground and the background (the distance range between 870 and 1500 pc) field, respectively. Although 44% of the foreground dM stars are in the range of 19 mag, 3% of the background dM stars are in the same magnitude range. Following the same approach as Dahm & Simon (2005), we used the the stellar luminosity function derived by Hipparcos (Jahreiß & Wielen, 1997) and the dMe (with an H EW 1 Å) incidence from the nearby star survey of Hawley et al. (1996). We adopted a completeness limit for the present observations of 20 mag. We assumed the scale height of 325 pc for an exponential falloff in the space density, and 0.7 mag kpc-1 for the diffuse absorption. The estimated number of dMe stars in the foreground and the background (up to 1500 pc) is 193 and 33 in our observed area, respectively. The total number of the field dMe stars, 54 per square degree, is consistent with the average number density of H stars in the field area, 58 per square degree.
It is also possible that there is contamination by pre-main sequence stars associated with the foreground cloud (Patel et al., 1995; Weikard et al., 1996). As the AKARI 9 image, which traces the photodissociation region in the periphery of the H ii region (Figure 4), is likely to be dominated by polycyclic aromatic hydrocarbons (PAHs) emission features, H stars associated with 9- emission are not likely to be foreground objects. The dark clouds B 163 and B 163SW do not show any sign of bright rims and their radial velocities of the molecular emission line are 6 km s-1 (Patel et al., 1995). The radial velocities of the other associated globules are between km s-1 and km s-1. From the radial velocity, Leung et al. (1982) suggested 150 pc for the distance of B 161, which also shows no bright rims and no indication of heating from behind (Weikard et al., 1996). The broad, curved dark lane Kh 161 (Khavtassi, 1960) and inverse S-shaped B 365, both of which show weak and diffuse emission at the northern and southern part of Figure 1, appear in foreground clouds.
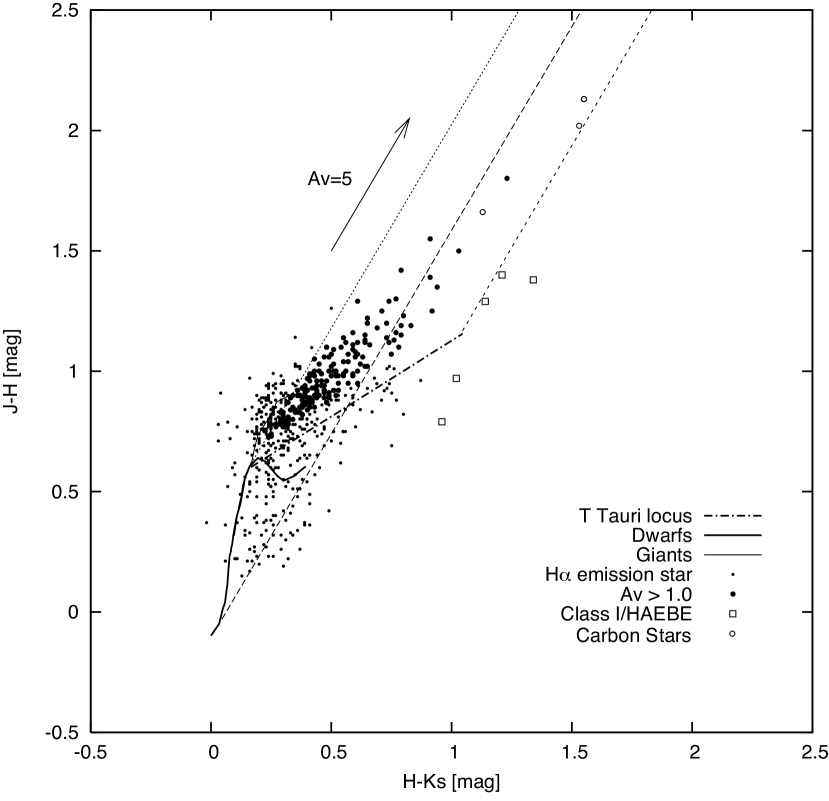
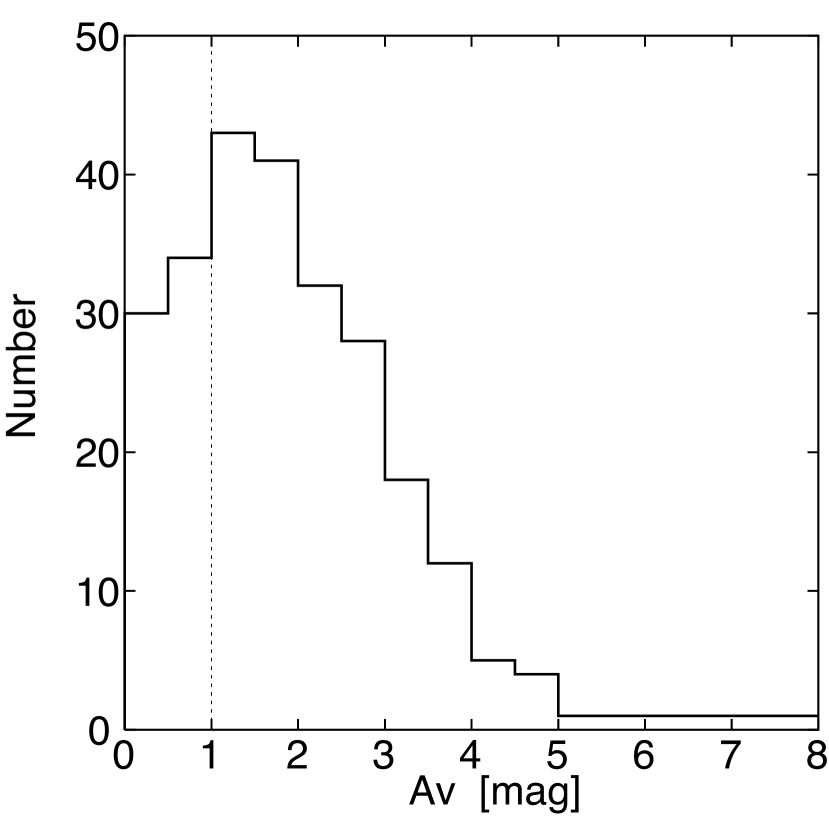
Figure 5 illustrates the NIR color–color diagram of our emission-line stars. The solid lines yield the locus of the main-sequence and of the giant branch according to Bessell & Brett (1988), while the dash-dotted straight line indicates the locus of the unreddened CTTS following Meyer et al. (1997). We used the color transformation equations of Cutri et al. (2008) to convert their loci into the 2MASS system. The reddening vector adopted from Cohen et al. (1981) is also shown. We selected nearly 40% of the H stars whose NIR colors are consistent with the colors of the reddened CTTS in Figure 5 and calculated the source extinction by tracing back along the reddening line to the CTTS locus. In the above procedure, we have not separated between WTTS and CTTS candidates, and treated all H stars as the same way. Although generally an unreddened WTTS does not show the color of the CTTS but rather of the normal main sequence, most WTTS have NIR colors of K- to early M-type stars, i.e., (–, –) (0.2, 0.64), that is close to the locus of unreddened CTTSs. Thus, we have not lost many WTTS in the above procedure. Three carbon stars, discussed in the previous section and shown as open circles in Figure 5, are excluded. Figure 6 shows a histogram of the measured extinction of 252 stars excluding three carbon star candidates (see §3.3) and No. 250/251. The median value of the source extinction is v1.74 mag. This value is consistent with the average extinction v1.56 mag obtained by Sicilia-Aguilar et al. (2005) for Trumpler 37.
The high mass stars in our surveyed area are two O-type stars, HD 206267 (O6) and HD 206183 (O9.5V), and six early B stars (B0–B5) (de Zeeuw et al., 1999). When Rv3.1, the foreground extinction of these OB stars should be 1.3–2.1 mag (Garrison & Kormendy, 1976). Contreras et al. (2002) excluded stars with v 1.0 mag as foreground stars and excluded stars with v 2.3 mag as background objects. As the background contamination by field dMe stars is not so high, many of the emission-line stars with v 2.3 mag in our survey appear to be associated with dark clouds or globules. Therefore, we selected 189 stars with v 1.0 mag as likely members associated with IC 1396. Most known T Tauri stars (e.g., Sicilia-Aguilar et al., 2006b) in Table 2 have v 1.0 mag, but 12 T Tauri stars have low extinction, and more than half of them are located near HD 206267.
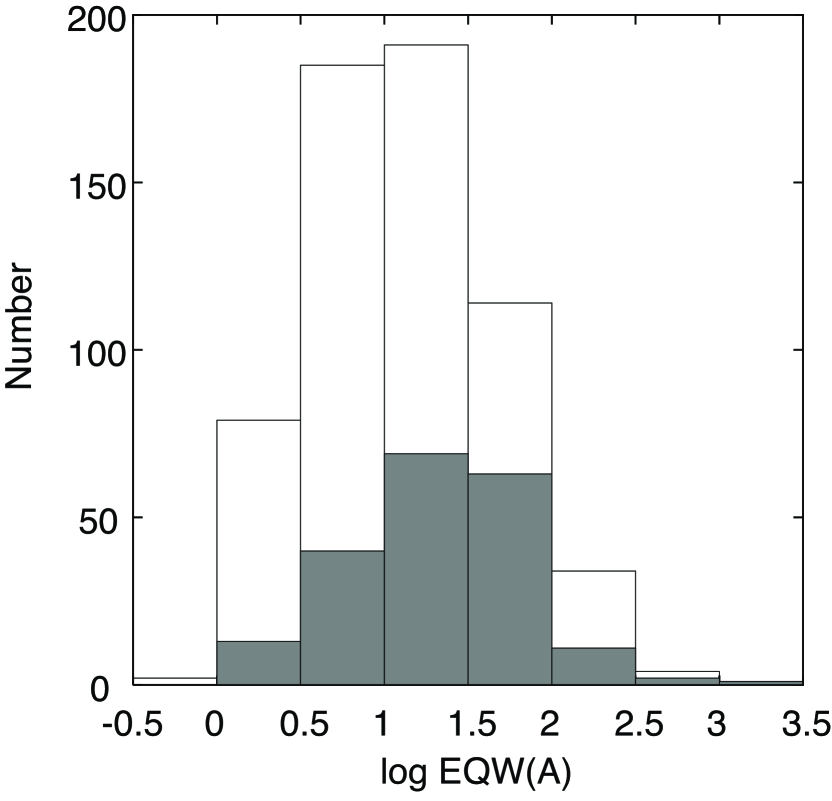
Figure 7 shows a histogram of the measured equivalent width. The fraction of weak (EW 10 Å) emission-line stars among the IC 1396 PMS candidates is low (27%) relative to that over the entire sample (44%). It appears that the fraction of CTTS candidates among the PMS candidates in the IC 1396 region is higher than that among the candidates proposed as foreground (or background) objects. We could not find any evidence of the difference between the spatial distribution of CTTS and WTTS.
To identify the HAeBe stars, which have larger infrared excess than CTTS, we adopted the extended criteria in the NIR color–color diagram proposed by Lee & Lim (2008). They used the region between two parallel reddening lines on their figure 4 and above (–) 0.2 mag to pick up HAeBe stars, excluding B[e] and classical Be stars from the young star sample as contaminants. According to their criteria, we selected five stars, redder than the reddening line passing through the truncated point of the CTTS locus and – 0.2 mag, including a known HAeBe, MVA-426 (Sicilia-Aguilar et al., 2006b). It is suggested that from their magnitudes Nos. 13, 236, and 606 are HAeBe stars and No. 479 and 545 are Class-I objects. In the following discussion, we have added these stars and 12 T Tauri stars with low extinction to the probable members totaling 205 stars. The number of new unpublished PMS candidates identified in the current survey is 72 including three Class-I objects or HAeBe stars.
Figure 8 illustrates the contour map of the number density of emission-line stars associated with IC 1396. Dashed boxes represent the eight subregions, namely, the East, West, SFO38, SFO37, SFO39/41, Rim B, Halo, and Field regions. Their distribution is not very different from Figure 2, though the peak of the distribution at the East region is slightly shifted westward. While the aggregate at the north of B 365 (see Figure 1), which is shown in Figure 2b, disappears in Figure 8 and therefore could be a foreground object, other aggregates should be associated with IC 1396. Table 4 summarizes the number of emission-line stars in each region. The H stars, whose v values we could not obtain, appear to be spread over the observed field rather uniformly. Thus, we suggest a large number of them are field stars.
4.2 Ages and Masses of H stars
Marschall et al. (1990) determined that the time after the first stars reach the main-sequence is 7 Myr in Trumpler 37 and Sicilia-Aguilar et al. (2005) confirmed 4 Myr for the age of Trumpler 37 from optical photometry and theoretical isochrones. The expansion of the H ii region creates a swept-up shell and results in a compressed molecular ring around its periphery. From the size of the ring, Patel et al. (1995) suggested a dynamical age of the system of globules of 2–3 Myr.
Figure 9 shows the extinction-corrected vs. (–) diagram of the 194 probable members with -band data, using the -band extinction correction from Cardelli et al. (1989). Here, we adopted the pre-main sequence model of Siess et al. (2000). Their effective temperature and luminosity are converted into our system using the table of Kenyon & Hartmann (1995) and the equation of Jordi et al. (2006). In Figure 9, the 0.1, 1, 3, 5, 10, and 100 Myr isochrones are overlapped as well as the evolutionary tracks for masses from 0.1 to 2.0 M☉, at an assumed distance of 870 pc. As the reddening vector runs almost parallel to the isochrones, the extinction value would not severely affect our age estimate.
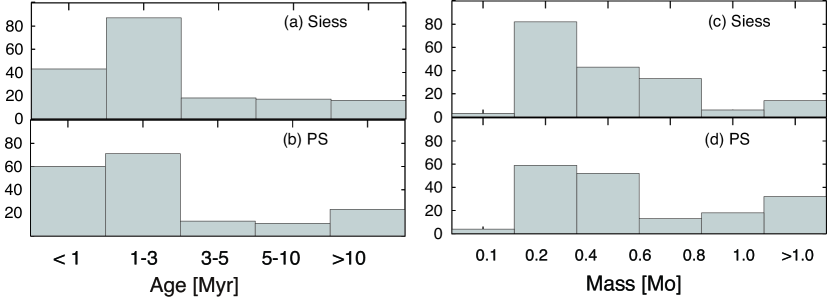
The uncertainty of the distance modulus (8.94–9.70) and the choice of PMS models affects the estimation of ages and masses of H stars from Figure 9. We used the pre-main sequence models of Palla & Stahler (1999), which are converted to our photometric system by a table of Kenyon & Hartmann (1995) and the equation of Jordi et al. (2006), for comparison. By assuming the nearest distance, 615 pc (de Zeeuw et al., 1999), the evolutionary tracks shift upwards, and it makes the age 0.2 dex older in both models. The age and mass histograms of the probable members in different choices of PMS models adopting 870 pc are shown in Figure 10. They indicate that the numbers of young stars ( 1 Myr ) predicted from the Siess models (Fig 10a) are generally smaller than those predicted from the Palla & Stahler models (Fig 10b). On the other hand, the number of low mass stars ( 0.4 M☉) derived from the Siess models (Fig 10c) are slightly large compared to those derived from the Palla & Stahler models (Fig 10d). We should notice the incompleteness of our PMS candidate sample along with possible effects on the distribution of masses and ages. Da Rio et al. (2010) carefully investigated the stellar population of the Orion Nebula Cluster by using these two PMS models. The completeness function in the mass-age plane, derived from their statistical simulation for two evolutionary models, shows that a large incompleteness correction is needed in the low mass ( 0.2 M☉) range. They attributed the difference of results to the different shapes of tracks and isochrones in this mass range. Although we adopted the Siess models, the uncertainties would be larger for stars with ages 1 Myr and masses 0.2 M☉. Furthermore, we could not detect emission-line stars near the region of higher obscuration such as the globules, and within 1 of the bright O star HD 206267, due to saturation of the detectors, light contamination from this star, and diffraction spikes from this star.
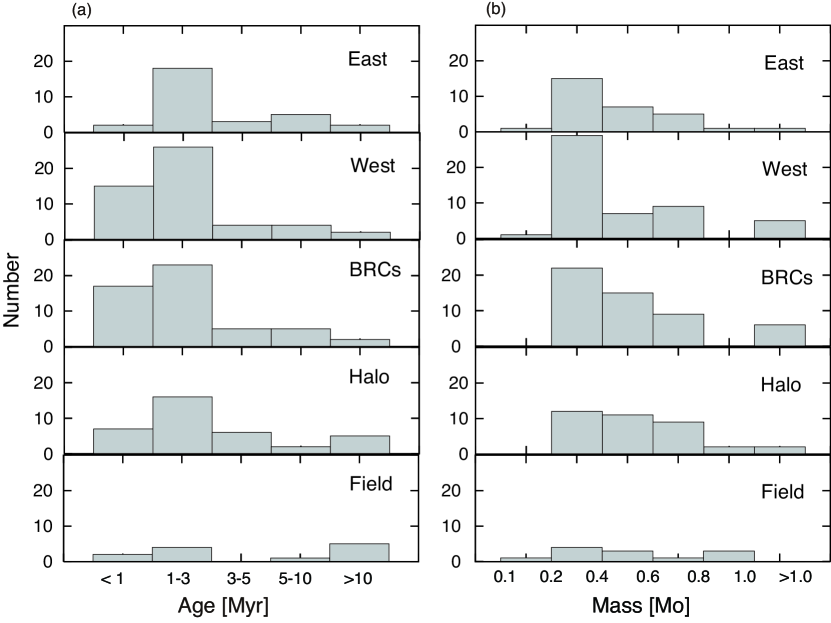
Table 5 shows the number of H stars in each age and mass bin in Figure 9. The age and mass histograms of H stars in each subregion are shown in Figure 11. We combined the SFO37/38/39/41/Rim B regions in the BRC (bright-rimmed cloud) region. Most of the H stars have ages of 3 Myr and masses of 0.2–0.6 M☉. The number of stars with an age less than 1 Myr and with an age of 1–3 Myr are comparable in the region associated with bright rims, i.e., the BRC region. We confirmed that the above result is also true for the age assigned from the Palla and Stahler model, and is not dependent on the choice of distance. The histogram in the West region is similar to that of the BRC region, probably because most of the H stars in the West region are associated with Rim A.
From the extensive survey of young stars by Spitzer, Koenig et al. (2008) found two distinct generations of star formation in W5. They considered two triggered star formation mechanisms, radiative driven implosion (RDI; e.g., Miao et al., 2009) and collect-and-collapse, to explain their findings and concluded that both mechanisms are at work in the W5 H ii region. Deharveng et al. (2010) extensively studied the nature of infrared bubbles which enclose H ii regions and discussed star formation triggered by the expanding H ii region at their edges. They show that most of these bubbles enclose H ii regions ionized by O–B2 stars, many are formed to be surrounded by cold dust shells (good candidates for C&C processes), and many have bright-rimmed dust condensations protruding inside the H ii region (good candidates for RDI process). In the IC 1396 region, the presence of aggregates associated with the bright rims immediately inside the IC 1396 H ii region or the near side of the ionizing star HD 206267, such as the West (Rim A), Rim B, and SFO38 regions, suggest that the star formation in these regions has advanced away from HD 206267 in 3 Myr. Such a configuration is consistent with squeezing of the pre-existing condensations compressed by the pressure of the ionized gas. The kinematical structure of SFO 37 (Sugitani et al., 1997; Ikeda et al., 2008) and an X-ray study of SFO 38 (Getman et al., 2007) also favored the RDI model.
4.3 Star Formation in the Central Region
In our previous results for the W5E H ii region (Nakano et al., 2008), we have found three aggregates of H emission-line stars in the W5E H ii region. Two of them are located at the edge of the H ii region, and one is near the central exciting O7 star. The former two aggregates are systematically younger than the latter.
Based on a comparison of the stellar ages in the BRC region with those in the East region of IC 1396 (Figure 11), it might appear that the low-mass population in the East region is older. We only find two stars younger than 1 Myr in the East region, in contrast to the West region. It may suggest that the star formation activity in the East region has ceased recently. As there remains no molecular material associated with the population in the East region, the exciting star HD 206267 has already dissipated the natal molecular cloud. However, a Kolmogorov-Smirnov (K-S) test gives a probability of 15 % that the two samples have the same distribution in age, even if we choose either PMS model. The difference between the ages of H stars in the BRCs region and the East region is not statistically significant.
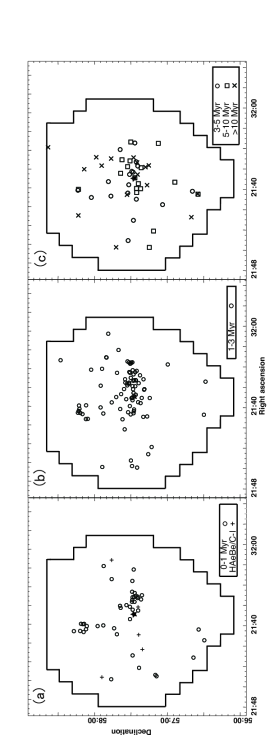
Sicilia-Aguilar et al. (2006a) estimated ages for six members near Rim A or in the globule. They found that the ages of five stars are younger than 1 Myr, which is significantly lower than the average age of Trumpler 37. Figure 12 plots the spatial distribution of H stars with derived ages. At a glance, younger stars in Figure 12a are preferentially located at the West region compared to those at the East region. Again we used K-S test to compare the distribution in right ascension and declination derived from different choice of PMS models. A probability that two samples of different age (Fig 12a and 12b) have the same distribution in two coordinate axis is 25 % and 54 %. Thus, the age difference of young stars in the West and the East region is not statistically clear from the spatial distribution of our sample.
In addition to the West region, Figure 12b shows a number of stars with an intermediate age (1–3 Myr) in the East and SFO38 regions, extending to the Halo region. A linear sequence of young stars across the center is noticeable. A filamentary dark cloud extends from Rim A to the western rim of the H ii region. It is noteworthy that H stars are distributed along this structure and further extend to the east of HD 206267. This spatial distribution strongly suggests a fossil record of a star forming cloud including Rim A and B.
Sicilia-Aguilar et al. (2005) argued a spatial east–west asymmetry in the young low-mass members of Trumpler 37, compared with more massive ones (Contreras et al., 2002). The same spatial asymmetry with respect to the central ionizing O star, HD 206267, was seen in the distribution of the Spitzer IRAC excess objects (Sicilia-Aguilar et al., 2006a). The asymmetry of H stars with high disk fraction may be explained by photo-evaporation of the disk material around the forming stars by strong UV radiation. Sicilia-Aguilar et al. (2005) suggested that the interstellar material, lying between powerful O6 stars and young stars with disks, shields the disk from UV radiation. However, there is no evidence of such an asymmetry of interstellar material from molecular line (Patel et al., 1995) and millimeter dust continuum observations (Rosolowsky et al., 2010). Actually, significant destruction of disks occurs for stars located out to distances of 0.5 pc, which corresponds to only a few arcmin from HD 206267, as found in NGC 2244 (Balog et al., 2007). Sicilia-Aguilar et al. (2005) additionally suggested probable age differences for the explanation for the asymmetry in the CTTS distribution. Instead of disk photo-evaporation, we prefer that this spatial asymmetry represents the star formation sequence. If most of the young low-mass population in the West region was formed as a result of a triggered event, those in the East region could be formed along with massive stars.
4.4 Star Formation in the BRC Region
There are 116 probable members of emission-line star in the BRC region including the West region, and the total mass is about 60–70 M☉. If we add 35 emission-line stars in the East region, the total mass reaches 70-90 M☉. Since our survey is biased toward the region of low extinction, the above estimates of the number and mass of the low-mass population in the BRC region including the West and the East region should be considered the lower limits. For example, Choudhury et al. (2010) found 45 YSOs in and around SFO 38, where we could not detect any H stars in the globule. Of these, 26 sources are Class-0/I, Class-I, and Class-I/II, but there are no such objects situated outside the ionized rim. It follows that the birth of low-mass stars associated with bright rims appears to be the primary mode of star formation in IC 1396 at present.
The higher mass O–F stars of Trumpler 37 (de Zeeuw et al., 1999; Contreras et al., 2002) total 200 M☉ in our observed fields (Figure 4). Assuming the initial mass function of Kroupa (2001) between 0.01 M☉ and 50 M☉, we estimate the total mass of stars in Trumpler 37 to be 500 M☉. Young low-mass stars, which probably formed by a triggered mechanism in the BRC region, contribute a fraction of the mass of stars in IC 1396.
4.5 The Birth of HD 206267
Ikeda et al. (2008) has determined the alignment of YSOs and their age gradient at the tip of SFO 37. They argued that this alignment and the elongation of the head of the globule are attributed to UV radiation from the O9.5V star, HD206183, at their formation stage. The dominant exciting source, however, is currently HD 206267. Consequently, HD 206267 formed at the late stage of star formation in the central part of the H ii region and disrupted the natal molecular cloud. Barentsen et al. (2011) reported the age gradient of the PMS candidates along the distance from this hot star. Their results also favors the triggered formation of stars in IC 1396. HD 206267 is known as the Trapezium system of OB stars with a maximum separation of 15000 AU, and the main component A is a triple (Stickland, 1995). Burkholder et al. (1997) confirmed the observed masses and evolutionary model masses and suggested that the two bright components of the triple are O6.5 V((f)) (A1) with 38–61 M☉ and O9.5: V (A2) with 17–28 M☉. Therefore, the age of HD 206267 is estimated to be 3 Myr from the main sequence lifetime (Schaerer & de Koter, 1997).
Numerical simulation considering protostellar outflow-driven turbulence has been discussed by Li & Nakamura (2006) and Nakamura & Li (2007). Following their study, we suggested that the massive exciting star of the W5 E H ii region was possibly formed after the continuous production of stars (Nakano et al., 2008). The birth of the most massive star should be the last stage of star formation. The contiguous formation of stars for 10 Myr in Trumpler 37 could be supported by Figure 12. Many of the low-mass stars near Rim A and SFO 38 might be formed in 3 Myr. As there is no conspicuous molecular material except the elephant trunk globule, Rim A, in the evacuated dust cavity (Figure 4), HD 206267 was likely born in the central part after the continuous low mass star formation. It is reasonable to suppose that the formation of massive stars and the associated low-mass population in Trumpler 37, continued for a few Myr. Although it is difficult to separate the low-mass stars formed as the same generation with HD 206267 and formed by the trigger mechanism of HD 206267, we believe that many of H stars at the rim were triggered to form by a radiation driven implosion mechanism after the formation of HD 206267.
5 Summary
We have made an extensive survey of emission-line stars in the IC 1396 H ii region to investigate the low-mass PMS population near the OB stars. A total of 639 H stars were detected over a 4-deg2 area and their -photometry was performed. Their spatial distribution shows several aggregates near the bright-rimmed clouds at the center and the edge of the H ii region (Rim A/B and SFO 37, 38, 39, 41) and one near the main exciting star of the H ii region. Based on the source extinction estimated from the NIR color–color diagram, we have selected PMS candidates associated with IC 1396. The age and mass were derived from the extinction corrected color-magnitude diagram and theoretical evolutionary tracks. Most of the H stars have ages of 3 Myr and masses of 0.2–0.6 M☉.
The spatial distribution of the PMS candidates indicates that the stellar population in the East region is spatially distinct from that in the West region, associated with Rim A globule. The age difference between two populations was also suggested by Sicilia-Aguilar et al. (2006b); Barentsen et al. (2011). The spatio-temporal gradients of the stellar age were also demonstrated near the bright-rimmed clouds by Getman et al. (2007); Ikeda et al. (2008); Choudhury et al. (2010). Our K-S test does not support the significant difference between ages of two populations. Also, the spatial distribution of 1 Myr stars is not significantly different from the distribution of 1–3 Myr stars. Although the star formation activity in the East region could be low in the last 1 Myr, we need further confirmation.
The linear sequence of stars including the West (Rim A) region and Rim B region, which is conspicuous in Fig 12b of 1–3 Myr age across the center of the H ii region, suggests a fossil record of the star forming cloud. The formation of massive stars and associated low-mass population of Trumpler 37 continuing for a few Myr, and the most massive star in Trumpler 37, HD 206267, was likely born 3 Myr ago. Then, the IC 1396 H ii region was formed by strong UV radiation. In the last stage, the H ii region presumably triggered the formation of low-mass stars in the dense inhomogeneity. Our results may suggest that massive stars were born after the continuous formation of low-mass stars for 10 Myr. The birth of the exciting star as the most massive one could be the late stage of slow but contiguous star formation in the natal molecular cloud. It presumably triggered the formation of many low-mass stars at the dense inhomogeneity in and around the H ii region by a radiation-driven implosion. Spectroscopic followup of our PMS candidates to establish their membership correctly and identify their nature is needed to clarify the star formation history of this region.
References
- Allen et al. (2007) Allen, L. et al. 2007, in Protostars and Planets V, ed. B. Reipurth, D. Jewitt, & K. Keil (Tucson, Univ. Arizona Press), 361
- Alksnis et al. (2001) Alksnis, A. et al. 2001, Baltic Astronomy, 10, 1
- Balázs et al. (1996) Balázs, L.G. et al. 1996, A&A, 311, 145
- Bessell & Brett (1988) Bessell, M., & Brett, J. 1988, PASP, 100, 1134
- Balog et al. (2007) Balog, Z. et al. 2007, ApJ, 660, 1532
- Barentsen et al. (2011) Barentsen, G. et al. 2011, MNRAS, 415, 103
- Barnard (1927) Barnard, E.E. 1927, A Photographic Atlas of Selected Regions of the Milky Way, Carnegie Institution, Washington
- Bonnet-Bidaud & Mouchet (1998) Bonnet-Bidaud, J.M. & Mouchet, M. 1998, A&A, 332, L9
- Briceño et al. (2007) Briceño, C. et al. 2007, in Protostars and Planets V. ed. B. Reipurth, D. Jewitt, & K. Keill (Tucson: Univ. Arizona Press), p.345
- Burkholder et al. (1997) Burkholder, V., Massay, P., & Morrell, N. 1997, ApJ, 490, 328
- Burningham et al. (2005) Burningham, B., Naylor, T., Littlefair, S.P., & Jeffries, R.D. 2005, MNRAS, 363, 1389
- Cardelli et al. (1989) Cardelli, J.A., Clayton, G.C., & Mathis, J.S. 1989, ApJ, 345, 245
- Choudhury et al. (2010) Choudhury, R., Mookerjea, B., & Bhatt, H.C. 2010, ApJ, 717, 1067
- Cieza et al. (2005) Cieza, L.A., Kessker-Silacci, J.E., Jaffe, D.T., Harvey, P.M., & Evans, N.J., II 2005, ApJ, 635, 422.
- Cohen et al. (1981) Cohen, J., Frogel, J.A., Persson, S.E., & Elias, J.A. 1981, ApJ, 249, 481
- Contreras et al. (2002) Contreras, M.E., Sicilia-Afguilar, A., Muzerolle, J., Calvet, N., Berlind, P., & Hartmann, L. 2002, AJ, 124, 1585
- Coyne et al. (1983) Coyne, G.V. & MacConnell, D.J. 1983, Vatican Obs. Publ., 2, 73
- Cutri et al. (2008) Cutri, R.M. et al. 2008, Explanatory Supplement to the 2MASS All Sky Data Release and Extended Mission Products, http://www.ipac.caltech.edu/2mass/releases/allsky/doc/sec6_4b.html
- Dahm & Simon (2005) Dahm, S.E. & Simon, T. 2005, AJ, 129, 829
- Da Rio et al. (2010) Da Rio, N. et al. 2010, ApJ, 722, 1092
- Deharveng et al. (2010) Deharveng, L. et al. 2010, A&A, 523, 35
- de Zeeuw et al. (1999) de Zeeuw, P.T., Hoogerwerf, R., de Bruijne, J.H.J., Brown, A.G.A., & Blaauw, A. 1999, AJ, 117, 354
- Drew et al. (2005) Drew, J.E. et al. 2005, MNRAS, 362, 753
- Garrison & Kormendy (1976) Garrison, R.F. & Kormendy, J. 1976, PASP, 88, 865
- Getman et al. (2007) Getman, K.V., Feigelson, E.D., Garmire, G., Broos, P., and Wang, J. 2007, ApJ654, 316 [GFG]
- Gomez et al. (1993) Gomez, M., Hartmann, L., Kenyon, S.J., Hewett, R. 1993, AJ, 105, 1927
- González-Solares et al. (2008) González-Solares, E.A. et al. 2008, MNRAS, 388, 89
- Hawley et al. (1996) Hawley, S., Gizis, J.E., & Reid, I.N. 1996, AJ, 112, 2799
- Hillenbrand (1997) Hillenbrand, L.A. 1997, AJ, 113, 1733
- Hughes & Wouterloot (1984) Hughes, V.A. & Wouterloot, J.G.A. 1984, ApJ, 276, 204
- Ikeda et al. (2008) Ikeda, H. et al. 2008, AJ, 135, 2323 [ISW]
- Ishihara et al. (2010) Ishihara, D. et al. 2010, A&A, 514, A1
- Jahreiß & Wielen (1997) Jahreiß, H. & Wielen, R. 1997, ESA-SP-402, 675
- Jeffries et al. (2006) Jeffries, R.D., Maxted, P.F.L., Oliveira, J.M., & Naylor, T. 2006, MNRAS, 371, L6
- Jiménez-Serra et al. (2007) Jiménez-Serra, I., Martín-Pintado, J., Rodríguez-Franco, A., Chandler, C., Comito, C., Schilke, P. 2007, ApJ, 661, L187
- Jordi et al. (1996) Jordi,C., Trullols, E., & Galadí-Enríquez, D. 1996, A&A, 312, 499
- Jordi et al. (2006) Jordi, K., Grebel, E.K., & Ammon, K. 2006, A&A, 460, 339
- Kenyon & Hartmann (1995) Kenyon, S.J. & Hartmann, L. 1995, ApJS, 101, 117
- Khavtassi (1960) Khavtassi, J.Sh. 1960, Atlas of Galactic Dark Nebulae, Abastumani Astrophys. Obs., Tbilisi
- Koenig et al. (2008) Koenig, X.P. et al. 2008, ApJ, 688, 1142
- Kroupa (2001) Kroupa, P. 2001, MNRAS, 322, 231
- Kun (1986) Kun, M. 1986, Ap&SS, 125, 13
- Kun (1987) Kun, M., Balázs, K.G., & Toth, I. 1987, Ap&SS, 134, 211
- Kun et al. (2008) Kun, M., Kiss, Z.T., & Balog, Z. 2008, in Handbook of Star Forming Regions 1, ed. B. Reipurth (Astronomical Society of the Pacific), p.136
- Kun & Pásztor (1990) Kun, M. & Pásztor, L. 1990, Ap&SS, 174, 13
- Lada & Lada (2003) Lada, C.J., & Lada, E.A. 2003, ARA&A, 41, 57
- Lee & Lim (2008) Lee, H.-T., & Lim, J. 2008, ApJ, 679, 1352
- Leung et al. (1982) Leung, C.M., Kutner, M.L., & Mead, K.N. 1982, ApJ, 262, 583
- Li & Nakamura (2006) Li, Z.,-Y., & Nakamura, F. 2006, ApJ, 640, L187
- Marschall & van Altena (1987) Marschall, L.A., & van Altena, W.F. 1987, AJ, 94, 71
- Marschall et al. (1990) Marschall, L.A., Comins, N.F., & Karshner, G.B. 1990, AJ, 99, 1538
- Mercer et al. (2009) Mercer, E.P. et al. 2009, AJ, 138,7 [MMC]
- Meyer et al. (1997) Meyer, M., Calvet, N., & Hillenbrand, L.A. 1997, AJ, 114, 288
- Miao et al. (2009) Miao, J., White, G.J., Thompson, M., & Nelson, R. 2009, ApJ, 692, 382
- Muench et al. (2008) Muench, A., Getman, K., Hillenbrand, L., & Preibisch, T. 2008, in Handbook of Star Forming Regions 1, ed. B. Reipurth (Astronomical Society of the Pacific), p.483
- Nakamura & Li (2007) Nakamura, F., & Li, Z.-Y. 2007, ApJ, 662, 395
- Nakano et al. (1995) Nakano, M., Wiramihardja, S.D., & Kogure, T. 1995, PASJ, 47, 889
- Nakano et al. (2008) Nakano, M., Sugitani, K., Niwa, T., Itoh, Y., & Watanabe, M. 2008, PASJ, 60, 739
- Ogura & Hasegawa (1983) Ogura, K., & Hasegawa, T. 1983, PASJ, 35, 299
- Ogura et al. (2002) Ogura, K., Sugitani, K., & Pickles, A. 2002, AJ, 123, 2597 [OSP]
- Palla & Stahler (1999) Palla, F., & Stahler, S.W. 1999, ApJ, 525, 772
- Patel et al. (1995) Patel, N.A., Goldsmith, P.F., Snell, R.L., Hezel, T., & Xie, T. 1995, ApJ, 447,721
- Pottasch (1956) Pottasch, S. 1956, Bull. Astron. Inst. Netherlands, 13, 77
- Pravdo et al. (2009) Pravdo, S.H., Tsuboi, Y., Uzawa, A., & Ezoe, Y. 2009, ApJ, 704, 1495
- Reach et al. (2004) Reach, W.T. et al. 2004, ApJS, 154, 385 [RRY]
- Robin et al. (2003) Robin, A.C., Reyle, C., Derriere, S., & Picaud, S. 2003, A&A, 409, 523
- Rosolowsky et al. (2010) Rosolowsky, E. et al. 2010, ApJS, 188, 123
- Schaerer & de Koter (1997) Schaerer. D., & de Koter, A. 1997, A&A, 322, 598
- Schulz et al. (1997) Schulz,N.S., Berghöfer, T.W., & Zinnecker,H. 1997, A&A, 325, 1001
- Sicilia-Aguilar et al. (2004) Sicilia-Aguilar, A., Hartmann, L., Briceño, C., Muzerolle, J., & Calvet, N. 2004, AJ, 128, 805
- Sicilia-Aguilar et al. (2005) Sicilia-Aguilar, A., Hartmann, L., Hernandez, J., Briceño, C., & Calvet, N. 2005, AJ, 130, 188
- Sicilia-Aguilar et al. (2006a) Sicilia-Aguilar, A. et al. 2006a, ApJ, 638, 897
- Sicilia-Aguilar et al. (2006b) Sicilia-Aguilar, A. et al. 2006b, AJ, 132, 2135 [SHF]
- Sicilia-Aguilar et al. (2007) Sicilia-Aguilar, A. , Hartmann, L.W., Watson, D., & Bohac, C. 2007, ApJ, 659, 1637
- Siess et al. (2000) Siess, L., Dufour, E., & Forestini, M. 2000, A&A, 358, 593
- Smith et al. (2002) Smith, J.A. et al. 2002, AJ, 123, 2121
- Stickland (1995) Stickland, D.J. 1995, Observatory, 115, 180
- Sugitani et al. (1991) Sugitani, K., Fukui, Y.,& Ogura, K. 1991, ApJS, 77, 59
- Sugitani et al. (1997) Sugitani, K., Morita, K.I., Nakano, M., Tamura, M., & Ogura, K. 1997, ApJ, 486, L141
- Takita et al. (2010) Takita, S. et al. 2010, A&A, 519, A83
- Tout et al. (1999) Tout, C.A., Livio, M., & Bonnell, I.A. 1999, MNRAS, 310, 360
- Uehara et al. (2004) Uehara, M. et al. 2004, Proc. SPIE, 5492, 661
- Wang et al. (2010) Wang, P., Li, Z.-Y., Abel, T., & Nakamura, F. 2010, ApJ, 709, 27
- Weikard et al. (1996) Weikard, H., Wouterloot, J.G.A., Castets, A., Winnewisser, G., & Sugitani, K. 1996, A&A, 309, 581

| UT Date | number of fields | |
|---|---|---|
| grism | -band | |
| 2004 Nov 12 | 1 | |
| 2006 Sep 6 | 2 | |
| 2006 Nov 18, 20 | 5 | |
| 2007 May 7 | 2 | |
| 2008 Aug 1, 2, 4, 6, 7 | 52 | 54 |
| 2008 Aug 8,9,11 | 38 | |
| 2008 Aug 21, 22, 24, 26 | 34 | 80 |
| 2008 Nov 2 | 2 | |
| 2009 Aug 13, 15, 17, 18 | 21 | 54 |
| total | 157 | 188aaincluding overlapped areas. |
| No | RA | Dec | aa“s” and “–” denote saturated and low photometric quality, respectively. | EW[Å] | 2MASSbb“6x” represents 2MASS 6x Point Star Catalog | quality flag | cc2MASS system. | –cc2MASS system. | –cc2MASS system. | vddcalculated from the NIR color–color diagram | remarkseeThe “Class” of the object, Class-I (I), Class-II (II), Class-III (III) , transition object (TO), Herbig Ae/Be star (HAeBe), mainly from Sicilia-Aguilar et al. (2006b) are shown in the parenthesis. VES Coyne et al. (1983), [OH83] Ogura & Hasegawa (1983), MVA Marschall & van Altena (1987), [SBZ] Schulz et al. (1997), CGCS Alksnis et al. (2001), [OSP] Ogura et al. (2002), [RRY] Reach et al. (2004), [SHB] Sicilia-Aguilar et al. (2004), [SHH] Sicilia-Aguilar et al. (2005), [SHF] Sicilia-Aguilar et al. (2006b), [SHW] Sicilia-Aguilar et al. (2007), [GFG] Getman et al. (2007), [ISW] Ikeda et al. (2008), [MMC] Mercer et al. (2009), [BVD] the serial number of T Tauri candidates in Table B1 of Barentsen et al. (2011). |
|---|---|---|---|---|---|---|---|---|---|---|---|
| (1) | (2) | (3) | (4) | (5) | (6) | (7) | (8) | (9) | (10) | (11) | (12) |
| 1 | 21:30:53.9 | 58:05:20.2 | 14.59 | 3 | 21305396+5805201 | AAA | 13.17 | 0.41 | 0.33 | ||
| 2 | 21:32:07.1 | 57:17:01.7 | 15.85 | 8 | 21320707+5717018 | AAA | 14.13 | 0.49 | 0.12 | ||
| 3 | 21:32:08.9 | 57:44:22.3 | – | 5 | 21320901+5744224 | AAA | 14.42 | 0.72 | 0.34 | 0.14 | |
| 4 | 21:32:12.2 | 57:05:40.4 | 15.33 | 5 | 21321218+5705406 | AAA | 14.13 | 0.23 | 0.19 | ||
| 5 | 21:32:18.4 | 56:54:51.8 | 16.49 | 9 | 21321834+5654517 | AAA | 14.65 | 0.57 | 0.10 | ||
| 6 | 21:32:25.6 | 57:49:40.3 | 17.02 | 46 | 21322559+5749403 | AAA | 14.38 | 1.08 | 0.60 | 3.02 | |
| 7 | 21:32:36.9 | 57:57:27.8 | 15.30 | 3 | 21323682+5757276 | AAA | 13.84 | 0.54 | 0.16 | ||
| 8 | 21:32:49.1 | 57:13:48.3 | 15.06 | 3 | 21324900+5713478 | AAA | 13.18 | 0.66 | 0.15 | ||
| 9 | 21:32:52.4 | 57:19:08.5 | 18.54 | 2 | |||||||
| 10 | 21:33:01.5 | 57:48:34.4 | 15.05 | 12 | 21330146+5748338 | AAA | 12.69 | 0.91 | 0.29 |
Note. — Table 2 is published in its entirety in the electronic edition of Astronomical Journal. A portion is shown here for guidance regarding its form and content.
| No | aaThe zero-magnitude flux densities for the AKARI bands are 56.262 Jy and 12.001 Jy for the and bands, respectively. | aaThe zero-magnitude flux densities for the AKARI bands are 56.262 Jy and 12.001 Jy for the and bands, respectively. | – | remarksbbMVA Marschall & van Altena (1987), CGCS Alksnis et al. (2001), [OSP] Ogura et al. (2002), [RRY] Reach et al. (2004), [SHF] Sicilia-Aguilar et al. (2006b), [GFG] Getman et al. (2007) | |
|---|---|---|---|---|---|
| 13 | 4.44 | 2.88 | 2.42 | 9.83 | LT Cep, IRAS 21317+5734 |
| 21 | 5.72 | 3.91 | 1.20 | 10.64 | |
| 29 | 4.62 | 2.69 | 2.21 | 9.75 | |
| 59 | 6.29 | 4.24 | 1.44 | 10.22 | V488 Cep |
| 60 | 5.81 | 1.94 | 12.49 | ||
| 81 | 6.99 | 1.66 | 10.54 | ||
| 115 | 5.88 | 3.85 | 2.53 | 9.39 | [RRY] tet |
| 121 | 6.58 | 4.50 | 0.46 | 14.42 | |
| 127 | 6.77 | 4.89 | 1.58 | 10.03 | |
| 203 | 5.87 | 3.81 | 0.73 | 9.84 | |
| 236 | 5.93 | 3.79 | 1.74 | 8.77 | MVA 426 |
| 252 | 4.99 | 3.04 | 1.69 | 8.59 | GM Cep |
| 287 | 4.64 | 4.06 | 2.79 | 6.96 | Kun 80, CGCS 5401cccarbon star candidate |
| 309 | 2.94 | 2.20 | 3.56 | 6.94 | cccarbon star candidate |
| 356 | 6.59 | 4.83 | 0.99 | 10.08 | |
| 377 | 6.47 | 4.73 | 10.76 | [SHF]93-361(II) | |
| 436 | 4.29 | 0.11 | 3.50 | 12.80 | IRAS 21388+5622, HH 588 |
| 456 | 3.80 | 2.29 | 10.67 | [OSP] BRC38 9 | |
| 487 | 7.43 | 0.72 | 8.07 | Kun 332 | |
| 575 | 1.17 | 0.47 | 3.68 | 4.83 | CGCS 5434cccarbon star candidate |
| 596 | 6.80 | 5.11 | 2.07 | 11.24 | |
| 606 | 7.07 | 2.72 | 11.67 | ||
| 611 | 6.61 | 3.81 | 1.64 | 9.66 | IRAS 21440+5648 |
| 617 | 7.07 | 1.49 | 10.18 | Kun 215 | |
| 618 | 5.03 | 1.76 | 11.32 | ||
| 621 | 6.26 | 3.62 | 2.02 | 10.63 | |
| 622 | 6.63 | 3.68 | 1.59 | 10.87 |
| sky area | number of H starsaaThe number in parentheses represents the probable members. 12 H stars with low extinction, HAeBe/Class-I candidates (see §4.1), and No. 436 (HH 588 center) are included as probable members. | number density | |
|---|---|---|---|
| deg2 | per deg2 | ||
| East | 0.11 | 89 (34) | 8.1 102 |
| West(Rim A) | 0.11 | 116(56) | 1.1 103 |
| SFO38 | 0.13 | 51 (25) | 3.9 102 |
| SFO37 | 0.10 | 15 (7) | 1.6 102 |
| SFO39/41 | 0.34 | 43 (16) | 1.3 102 |
| Rim B | 0.09 | 23 (12) | 2.8 102 |
| Halo | 0.99 | 167 (38) | 1.7 102 |
| Field | 2.33 | 135 (17) | 5.8 101 |
| total | 4.2 | 639 (205) |
| Age/Mass | East | West | BRC | Halo | Field | total |
|---|---|---|---|---|---|---|
| 1 Myr | 2 | 15 | 17 | 7 | 2 | 43 |
| 1–3 Myr | 18 | 26 | 23 | 16 | 4 | 87 |
| 3–5 Myr | 3 | 4 | 5 | 6 | 0 | 18 |
| 5–10 Myr | 5 | 4 | 5 | 2 | 1 | 17 |
| 10 Myr | 2 | 2 | 2 | 5 | 5 | 16 |
| 0.1–0.2 M☉ | 1 | 5 | 6 | 2 | 0 | 14 |
| 0.2–0.4 M☉ | 1 | 0 | 0 | 2 | 3 | 6 |
| 0.4–0.6 M☉ | 5 | 9 | 9 | 9 | 1 | 33 |
| 0.6–0.8 M☉ | 7 | 7 | 15 | 11 | 3 | 43 |
| 0.8–1.0 M☉ | 15 | 29 | 22 | 12 | 4 | 82 |
| 1.0 M☉ | 1 | 1 | 0 | 0 | 1 | 3 |
| total | 30 | 51 | 52 | 36 | 12 | 181 |