Telecommunications-band heralded single photons from a silicon nanophotonic chip
Abstract
We demonstrate heralded single photon generation in a CMOS-compatible silicon nanophotonic device. The strong modal confinement and slow group velocity provided by a coupled resonator optical waveguide (CROW) produced a large four-wave-mixing nonlinearity coefficient W-1m-1 at telecommunications wavelengths. Spontaneous four-wave-mixing using a degenerate pump beam at 1549.6 nm created photon pairs at 1529.5 nm and 1570.5 nm with a coincidence-to-accidental ratio exceeding 20. A photon correlation measurement of the signal (1529.5 nm) photons heralded by the detection of the idler (1570.5 nm) photons showed antibunching with . The demonstration of a single photon source within a silicon platform holds promise for future integrated quantum photonic circuits.
pacs:
Chip-based single photon sources leverage the scalability and device integration afforded by modern semiconductor fabrication technology for quantum information processing applications O’Brien et al. (2009); Shields (2007). There are two dominant approaches to single photon generation at optical wavelengths. The first is through radiative decay of a single quantum emitter such as an atom or quantum dot that is ”triggered” by excitation pulses. The second is through spontaneous photon pair production, in which the detection of one photon of the pair provides the time stamp by which the remaining (”heralded”) single photon is identified. Both approaches for single photon generation were first demonstrated in bulk optical systems decades ago Kimble et al. (1977); Grangier et al. (1986); Hong and Mandel (1986). Since then, chip-based triggered single photon sources based on systems such as a single quantum dot in a nanocavity Michler et al. (2000); Santori et al. (2001); Shields (2007) have been widely studied, but this work is generally in cryogenically-cooled III-V semiconductor systems Michler (2003). In contrast, photon pair production and subsequent heralded single photon generation, which are usually based on second- and third-order nonlinear processes that are achievable in a broader class of materials and at room temperature, have primarily been studied in larger systems such as bulk crystals Fasel et al. (2004); Mosley et al. (2008), periodically-poled waveguides U’Ren et al. (2004); Alibart et al. (2005), and optical fibers Fiorentino et al. (2002); Rarity et al. (2005); Goldschmidt et al. (2008); Cohen et al. (2009). Recently, however, researchers have begun exploring four-wave-mixing (FWM) and photon pair production in CMOS-compatible silicon nanophotonic devices Sharping et al. (2006); Harada et al. (2008); Clemmen et al. (2009); Xiong et al. (2011), which support a strong third-order optical nonlinearity and have the potential for significant levels of integration with other quantum optical components. Here, we build upon this work by demonstrating not only photon pair production, but also heralded single photon generation in a chip-based, silicon nanophotonic device operating in the telecommunications band and at room temperature.
Since silicon lacks a second-order optical nonlinearity, photon pair production uses the third-order (ultrafast Kerr) nonlinearity, typically in the degenerate four-wave-mixing configuration where a single pump beam at frequency generates photons at signal () and idler () frequencies, with energy conservation requiring 2=+ and momentum conservation (phase-matching) being a requirement for appreciable pair production Agrawal (2007). Silicon nanophotonic waveguides have an effective nonlinearity coefficient W-1m-1 that is four orders of magnitude larger than that of highly nonlinear optical fiber Sharping et al. (2006); Harada et al. (2008). Also, spontaneous Raman scattering, a broadband noise source in optical fibers that can require them to be cryogenically-cooled Lee et al. (2006), is generally less important in silicon, where it is narrowband and can thus be more easily avoided. On the other hand, in comparison to silica fibers, silicon devices exhibit two-photon absorption (TPA) and free-carrier absorption (FCA) at higher pump powers, incur coupling losses if photons have to be coupled to input/output optical fibers, and are generally limited to a few centimeters of waveguide length on a chip.
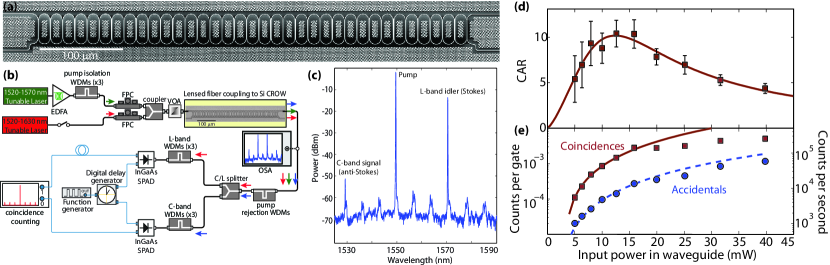
Our device geometry is a silicon coupled-resonator optical-waveguide (CROW) as shown in Fig. 1(a). The CROW consists of directly-coupled microring resonators (loss = 0.21 dB/ring), such that each eigenmode is a collective resonance of all resonators. Light is transmitted through the CROW in a disorder-tolerant slow light regime, with slowing factor between 5 and 12, depending on the wavelength ( is the speed of light and is the group velocity). As is enhanced by a factor , the CROW achieves higher levels of conversion within the limited footprint available on a chip. Indeed, in ref. Ong et al. (2011), we have shown classical FWM with W-1m-1, representing +16 dB enhanced conversion compared to a conventional nanophotonic waveguide, for over THz (80 nm) separation between signal and idler. This and other reports of FWM in CROWs Morichetti et al. (2011) have shown similar conversion efficiencies to the best photonic crystal waveguides (PCWGs). However, such widely-separated wavelengths, which span a significant fraction of the fiber-optic telecommunications window, are difficult to achieve in PCWGs because of the limited bandwidth of their slow-light regime compared to CROWs; 1.25 THz (10 nm) signal-idler separation was reported in ref. Xiong et al. (2011).
We first show photon pair production from the Si CROW device, using the experimental setup depicted in Fig. 1(b). Time-correlated signal and idler photons are expected to be generated in multiple pairs of CROW transmission bands that are approximately equally red- and blue-detuned from our amplified pump beam at 1549.6 nm, as demonstrated in previous classical FWM mixing experiments Ong et al. (2011). We choose a signal-idler pair at 1529.5 nm and 1570.5 nm, as shown in Fig. 1(c). Here, to show the classical FWM process, a strong pump at 1549.6 nm was combined with a probe field at 1570.5 nm, resulting in the addition of stimulated photons into the 1570.5 nm field and generation of a new field at 1529.5 nm. For spontaneous FWM (SFWM) experiments, the 1570.5 nm probe field was disconnected so that spontaneous photons are generated in the signal and idler bands. The 1549.6 nm pump was filtered to a 1.0 nm bandwidth through cascaded WDM and tunable filters, and light was coupled to and from the chip (loss = 5 dB per coupler) using tapered lensed fibers and polymeric overlaid waveguide couplers. Output light from the chip was filtered by a set of WDM pump-rejection filters (120 dB estimated pump rejection at 1550 nm 3 nm) and then routed through cascaded C- and L- band WDM filters (estimated 150 dB pump isolation; 0.5 nm bandwidth) to spectrally separate and isolate the signal and idler photons, respectively. The signal (C-band) and idler (L-band) photons were detected by InGaAs/InP Single-Photon Avalanche Diodes (SPADs) Ribordy et al. (2004) gated electronically at 1 MHz (10 detection efficiency, 20 ns gate width, and 10 s dead-time), and raw coincidences () and accidentals () were measured by a time-correlated single photon counting (TCSPC) system operating with 512 ps timing resolution, with typical measurement integration times between 1800 s and 5400 s. Coincidences due to dark counts () were measured separately for both integration times at each detector, and subtracted to yield and , with the coincidence-to-accidental ratio given as 111Raw coincidences are counted over a 512 ps bin at zero time delay between the Cband and Lband paths. Raw accidentals () are taken as the average over thirty separate 512 ps bins at time delays of , corresponding to the 1 MHz trigger rate, with coincidences due to dark counts determined in the same way. The uncertainties in and are one standard deviation values and are propagated to generate the error bars in the CAR plot..
CAR under continuous wave (cw) excitation is shown in Fig. 1(d) as a function of the input power into the CROW. CAR initially increased and then rolled off at higher intensities, which is the anticipated behavior based on other studies Sharping et al. (2006); Harada et al. (2008); Xiong et al. (2011); Clemmen et al. (2009), where at low powers CAR is thought to be limited by detector noise, while at higher powers, nonlinear loss and multiple pair generation are the limiting factors. Peak CAR was 10.4 1.4 at an input power of 12 dBm, which was below the level for 1 dB excess nonlinear absorption in these CROWs Ong et al. (2011). In Fig. 1(e), we plot the coincidence and accidental rates at the output of the CROW 222Coincidence and accidental rates at the CROW output are determined by taking the measured values and accounting for detector efficiency, filter losses, and output coupling loss from the CROW into the lensed fiber.. At peak CAR, the coincidence rate is per detector gate; considering the cw pumping and the 1 MHz detector trigger rate and 20 ns gate width, this corresponds to a pair coincidence rate of 73 kHz. Figure 1(e) also shows quadratic fits (solid lines) to the six lowest power data points; the sub-quadratic dependence of and at higher pump powers was most likely related to TPA/FCA effects. We compared the pair production performance of our CROW with a conventional single mode nanophotonic silicon wire waveguide (length of 2.63 cm, loss = 2.6 dB/cm, coupling loss = 5 dB per coupler) on the same chip. A peak CAR of 8.5 1.0 was measured for this device, with a pair coincidence rate of 95 kHz. Thus, the CROW photon pair source moderately outperformed a conventional silicon waveguide whose physical footprint was 54 times longer.
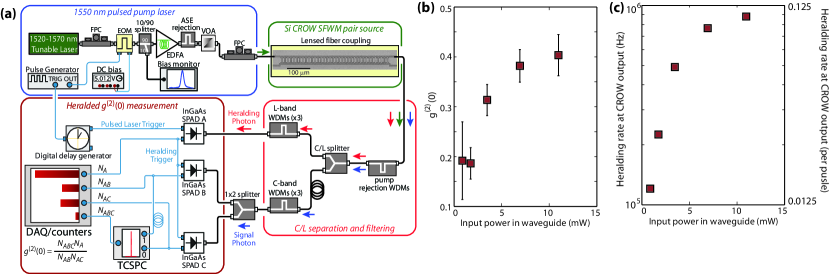
We next consider heralded single photon generation from this device (Fig. 2(a)). Here, the detection of an L-band idler photon indicates (heralds) the presence of its twin, and a photon correlation measurement on these heralded photons confirms their single photon character Grangier et al. (1986); Hong and Mandel (1986). We pumped the CROW using a pulsed source, which was created by modulating and amplifying a tunable diode laser at 1549.6 nm to create 2.5 ns wide, 8 MHz repetition rate pulses. C-band signal and L-band idler photons were spectrally separated and isolated in the same way as above, but now the C-band signal photons were split by a 50/50 coupler, with each C-band path detected by an InGaAs/InP SPAD (20 detection efficiency, 20 ns gate width, and no deadtime). The detectors in this Hanbury-Brown and Twiss (HBT) photon correlation measurement setup (labeled SPAD B and SPAD C in Fig. 2(a)) were triggered by the detection of an L-band idler photon (the herald). The L-band photons were detected by a high-performance InGaAs/InP SPAD Tosi et al. (2012), labeled SPAD A in Fig. 2(a), which operates at 30 detection efficiency, 10 ns gate width, and 10 s dead time and is triggered at 8 MHz by the electro-optic modulator driver. The normalized value of the photon correlation measurement on the C-band signal photons at zero time delay, , is given by Beck (2007). Triple coincidences , corresponding to simultaneous events on all three detectors, were recorded over a 2.5 ns bin using the TCSPC. Double coincidences and , corresponding to simultaneous events on SPADs A and B or SPADs A and C, were given by the photon detection rates on SPAD B and SPAD C. The number of heralding photons is determined by the detection rate on SPAD A, and a typical integration time of 1500 s was used for each measurement.
In Fig. 2(b), we plot the value of as a function of average input power into the CROW. for all pump powers that we recorded, indicating that we indeed have a source that is antibunched and dominantly composed of single photons 333 and are given by the average detection rates on SPADS B and C multiplied by the integration time, respectively. is the average photon detection rate on SPAD A mutiplied by the integration time. The one standard deviation uncertainties on these values are propagated to generate the error bars in Fig. 3(a).. The minimum value we measured is at mW of average power into the CROW. At lower power levels in our experiment, may be limited by detector dark counts, while at higher power levels, the increase in is likely due to the increased multi-photon probability as multiple photon pairs are generated in each optical pulse. The maximum power levels we can inject into the CROW were ultimately limited by the damage threshold of the input couplers. In Fig. 2(c), we plot the heralding rate (detection rate of L-band photons by SPAD A) at the CROW output. At the minimum value of , the heralding rate was 220 kHz (0.028 photons/pulse). As the input power to the CROW increases, the generation rate of heralding photons saturated near 1 MHz due to TPA/FCA effects in silicon. Under pulsed pumping (2.5 ns pulses, 8 MHz trigger rate) and at the input power corresponding to the minimum value of , CAR15 was measured without dark count subtraction. Subtraction of dark count coincidences (due to dark counts on both detectors as well dark counts on one detector and photon detection events on the other detector) yields CAR=23.85.6. This significant correction indicates that reported in Fig. 2 may contain a large contribution due to dark counts.
In summary, we have demonstrated a telecommunications-band silicon heralded single photon source. Spontaneous four-wave-mixing in a 35-ring silicon coupled resonator optical waveguide generated photon pairs spaced by 40 nm, with a coincidence-to-accidental ratio for continuous wave pumping and for pulsed pumping. Three InGaAs/InP single photon counters were used to perform a measurement in which the detection of the idler photons from the pairs triggers a photon correlation measurement on the corresponding signal photons. We measured antibunching with =0.190.03, indicating a source that is dominantly composed of single photons. Our demonstration of heralded single photon generation within a silicon photonics platform, for which sophisticated levels of switching and multiplexing have been shown Soref (2006), is a step towards integration of multiple heralded sources to create quasi-deterministic single photon sources Migdall et al. (2002); Pittman et al. (2002); Ma et al. (2011) that may then be combined with waveguide quantum photonic circuits Politi et al. (2008) and single photon counters Pernice et al. (2011) to achieve high levels of functionality in future quantum information processing applications.
This work was supported by the National Science Foundation under grants ECCS-0642603, ECCS-0925399, NSF-GOALI collaboration with IBM, NSF-NIST supplement, UCSD-Calit2 and the CNST/Maryland Nanocenter cooperative agreement. J. R. Ong acknowledges support from Agency for Science, Technology and Research (A*STAR) Singapore. We thank Nick Bertone from Optoelectronic Components for his help in setting up this collaboration.
References
- O’Brien et al. (2009) J. L. O’Brien, A. Furusawa, and J. Vučković, Nature Photonics 3, 687 (2009).
- Shields (2007) A. J. Shields, Nature Photonics 1, 215 (2007).
- Kimble et al. (1977) H. J. Kimble, M. Dagenais, and L. Mandel, Phys. Rev. Lett. 39, 691 (1977).
- Grangier et al. (1986) P. Grangier, G. Roger, and A. Aspect, Europhysics Letters 1, 173 (1986).
- Hong and Mandel (1986) C. K. Hong and L. Mandel, Phys. Rev. Lett. 56, 58 (1986).
- Michler et al. (2000) P. Michler, A. Kiraz, C. Becher, W. V. Schoenfeld, P. M. Petroff, L. Zhang, E. Hu, and A. Imamoglu, Science 290, 2282 (2000).
- Santori et al. (2001) C. Santori, M. Pelton, G. Solomon, Y. Dale, and Y. Yamamoto, Phys. Rev. Lett. 86, 1502 (2001).
- Michler (2003) P. Michler, ed., Single Quantum Dots (Springer Verlag, Berlin, 2003).
- Fasel et al. (2004) S. Fasel, O. Alibart, S. Tanzilli, P. Baldi, A. Beveratos, N. Gisin, and H. Zbinden, New J. Phys. 6, 163 (2004).
- Mosley et al. (2008) P. J. Mosley, J. S. Lundeen, B. J. Smith, P. Wasylczyk, A. B. U’Ren, C. Silberhorn, and I. A. Walmsley, Phys. Rev. Lett. 100, 133601 (2008).
- U’Ren et al. (2004) A. B. U’Ren, C. Silberhorn, K. Banaszek, and I. A. Walmsley, Phys. Rev. Lett. 93, 093601 (2004).
- Alibart et al. (2005) O. Alibart, D. B. Ostrowsky, P. Baldi, and S. Tanzilli, Opt. Lett. 30, 1539 (2005).
- Fiorentino et al. (2002) M. Fiorentino, P. L. Voss, J. E. Sharping, and P. Kumar, IEEE Photonics Tech. Lett. 14, 983 (2002).
- Rarity et al. (2005) J. G. Rarity, J. Fulconis, J. Duligall, W. J. Wadsworth, and P. S. J. Russell, Opt. Express 13, 534 (2005).
- Goldschmidt et al. (2008) E. A. Goldschmidt, M. D. Eisaman, J. Fan, S. V. Polyakov, and A. Migdall, Phys. Rev. A 78, 013844 (2008).
- Cohen et al. (2009) O. Cohen, J. S. Lundeen, B. J. Smith, G. Puentes, P. J. Mosley, and I. A. Walmsley, Phys. Rev. Lett. 102, 123603 (2009).
- Sharping et al. (2006) J. E. Sharping, K. F. Lee, M. A. Foster, A. C. Turner, B. S. Schmidt, M. Lipson, A. L. Gaeta, and P. Kumar, Optics Express 14, 12388 (2006).
- Harada et al. (2008) K.-I. Harada, H. Takesue, H. Fukuda, T. Tsuchizawa, T. Watanabe, K. Yamada, Y. Tokura, and S.-I. Itabashi, Opt. Express 16, 20368 (2008).
- Clemmen et al. (2009) S. Clemmen, K. P. Huy, W. Bogaerts, R. G. Baets, P. Emplit, and S. Massar, Opt. Express 17, 16558 (2009).
- Xiong et al. (2011) C. Xiong, C. Monat, A. S. Clark, C. Grillet, G. D. Marshall, M. J. Steel, J. Li, L. O’Faolain, T. F. Krauss, J. G. Rarity, and B. J. Eggleton, Opt. Lett. 36, 3413 (2011).
- Agrawal (2007) G. P. Agrawal, Nonlinear Fiber Optics (Academic Press, Amsterdam, 2007).
- Lee et al. (2006) K. F. Lee, J. Chen, C. Liang, X. Li, P. L. Voss, and P. Kumar, Opt. Lett. 31, 1905 (2006).
- Ong et al. (2011) J. Ong, M. Cooper, G. Gupta, W. Green, S. Assefa, F. Xia, and S. Mookherjea, Opt. Lett. 36, 2964 (2011).
- Morichetti et al. (2011) F. Morichetti, A. Canciamilla, C. Ferrari, A. Samarelli, M. Sorel, and A. Melloni, Nature Communications 2 (2011).
- Ribordy et al. (2004) G. Ribordy, N. Gisin, O. Guinnard, D. Stucki, M. Wegmuller, and H. Zbinden, Journal of Modern Optics 51, 1381 (2004).
- Note (1) Raw coincidences are counted over a 512 ps bin at zero time delay between the Cband and Lband paths. Raw accidentals () are taken as the average over thirty separate 512 ps bins at time delays of , corresponding to the 1 MHz trigger rate, with coincidences due to dark counts determined in the same way. The uncertainties in and are one standard deviation values and are propagated to generate the error bars in the CAR plot.
- Note (2) Coincidence and accidental rates at the CROW output are determined by taking the measured values and accounting for detector efficiency, filter losses, and output coupling loss from the CROW into the lensed fiber.
- Tosi et al. (2012) A. Tosi, A. D. Frera, A. B. Shehata, and C. Scarcella, Rev. Sci. Inst. 83, 013104 (2012).
- Beck (2007) M. Beck, J. Opt. Soc. Am. B 24, 2972 (2007).
- Note (3) and are given by the average detection rates on SPADS B and C multiplied by the integration time, respectively. is the average photon detection rate on SPAD A mutiplied by the integration time. The one standard deviation uncertainties on these values are propagated to generate the error bars in Fig. 3(a).
- Soref (2006) R. Soref, IEEE J. Sel. Top. Quan. Elec. 12, 1678 (2006).
- Migdall et al. (2002) A. L. Migdall, D. Branning, and S. Castelletto, Phys. Rev. A 66, 053805 (2002).
- Pittman et al. (2002) T. B. Pittman, B. C. Jacobs, and J. D. Franson, Phys. Rev. A 66, 042303 (2002).
- Ma et al. (2011) X.-S. Ma, S. Zotter, J. Kofler, T. Jennewein, and A. Zeilinger, Phys. Rev. A 83, 043814 (2011).
- Politi et al. (2008) A. Politi, M. J. Cryan, J. G. Rarity, S. Yu, and J. L. O’Brien, Science 320, 646 (2008).
- Pernice et al. (2011) W. Pernice, C. Schuck, O. Minaeva, M. Li, G. Goltsman, A. Sergienko, and H. Tang, arXiv:1108.5299 (2011), arXiv:1108.5299 [optics] .