ATLAS Jet Energy Scale
Abstract
Jets originating from the fragmentation of quarks and gluons are the most common, and complicated, final state objects produced at hadron colliders. A precise knowledge of their energy calibration is therefore of great importance at experiments at the Large Hadron Collider at CERN, while is very difficult to ascertain. We present in-situ techniques and results for the jet energy scale at ATLAS using recent collision data. ATLAS has demonstrated an understanding of the necessary jet energy corrections to within 4% in the central region of the calorimeter.
I Introduction
The ATLAS experiment has been collecting collision data from the Large Hadron Coller (LHC) since early 2010. Currently, the ATLAS jet calibration is derived from Monte Carlo simulations, while its associated uncertainty is derived from a combination of single hadron and dijet response measurements, and systematic variations in Monte Carlo simulations. In order to validate this approach, ATLAS has employed a number of approaches to demonstrate an understanding of the jet energy scale.
In Section 1 the single particle response measurement in the central barrel region is presented. This is extrapolated to the endcap regions of the calorimeter using the diject relative response measurement, as described in Section 2. Section 3 details the photon + jet measurements. Finally, in Section 4 a summary of all of the validation methods for the ATLAS jet energy scale (JES) is presented.
II Single Particle Response
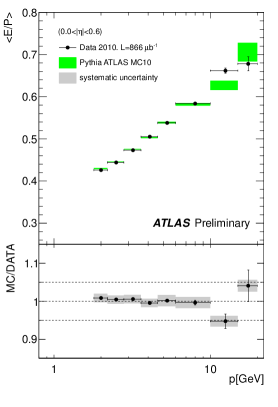
The basic idea underyling the single particle response is to measure the calorimeter response for isolated single particles by comparing the energy and momentum (tracking) measurements, namely , under the assumption that the tracking measurement is very precise. Uncertainties for single particles are derived from deviations of this measurement in simulations compared to data. Then, these are extrapolated to jet uncertainties using simulations. Although the translation from single particles to the jet context is non-trivial, it has been exhaustively cross-checked and is found to have small uncertainty. For charged particles in the momentum range GeV the measured in situ is used to determine the response EoverP . A comparison of in data to that in Monte Carlo is shown in Figure 1.
III Relative Response
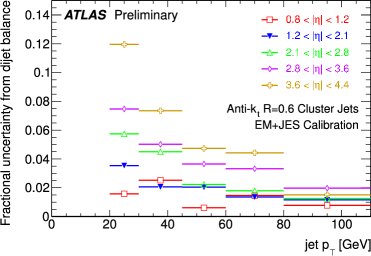
For jets outside of the central barrel, the response for the central region is extrapolated using a dijet balance technique InterCalib . This procedure measures a response for a jet relative to the central region under the assumption of momentum balance of the dijet system, and compares it to the result in simulations. The JES uncertainty in the endcap region is then the sum in quadrature of the uncertainties in the central region and the dijet relative response measurements. Currently, the latter component (shown in Figure 2) is the dominant one in the forward region, due to a disagreement between different Monte Carlo generators in the modelling of the reference balance assumption.
IV Response from Photon + Jet Events
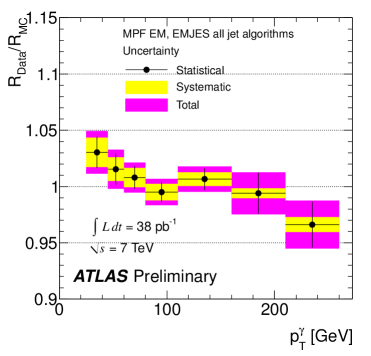
Because photons are well-measured objects, one can directly measure the jet response by using the principle of momentum balance between a photon and recoil jet in photon + jet events. One technique, known as the missing ET projection fraction (MPF) directly measures the total calorimeter response to jets by balancing the hadronic recoil against the photon. The MPF equation is:
| (1) |
Directly balancing the photon and jet in these events is a complementary technique, and is differently sensitive to radiative effects GammaJet . A comparison of the MPF in data and simulation is shown in Figure 3. The Monte Carlo simulation agrees with the data to within a few percent over the entire range of photon .
V Summary of Jet Energy Scale
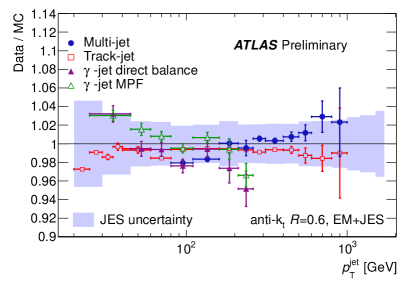
Besides the techniques summarized above, comparing track and calorimeter jets and also measuring transverse momentum balance in multi-jet final states are useful probes of the jet energy scale.
The track jet comparison test works off of the assumption that the ratio of the charge particle momentum to the total jet momentum is tightly constrained. Thus, by directly measuring the ratio of the track jet to the matched calorimeter jet momentum in data and in simulations, the validity of the simulation can be determined TrackJet .
Employing momentum balance in multi-jet final states in which a high jet recoils against many lower jets allows for validation at very high MultiJet . This is because the uncertainties can be ascertained for the recoil jets using the standard approaches described above, since they are in a reachable range for these methods. Then the momentum balance of the recoil system and lead jet can be compared in data and simulations.
By combining these techniques with those described above, a robust validation of the JES and its uncertainty can be shown JES . This is summarized in the central region in Figure 4.
In summary, the jet energy scale and its uncertainty in ATLAS, derived from Monte Carlo simulations, has been extensively validated to within in the central region of the calorimeter for GeV (or for GeV) using a variety of complementary approaches.
References
- (1) The ATLAS Collaboration, ATLAS-CONF-2010-052, cdsweb.cern.ch/record/1281309 (2010)
- (2) The ATLAS Collaboration, ATLAS-CONF-2011-014, cdsweb.cern.ch/record/1334876 (2011)
- (3) The ATLAS Collaboration, ATLAS-CONF-2011-031, cdsweb.cern.ch/record/1337781 (2011)
- (4) The ATLAS Collaboration, ATLAS-CONF-2011-067, cdsweb.cern.ch/record/1349308 (2011)
- (5) The ATLAS Collaboration, ATLAS-CONF-2011-029, cdsweb.cern.ch/record/1337076 (2011)
- (6) The ATLAS Collaboration, ATLAS-CONF-2011-032, cdsweb.cern.ch/record/1337781 (2011)