Electronic phase diagram of LixCoO2 revisited with potentiostatically de-intercalated single crystals
Abstract
Electronic phase diagram of LixCoO2 has been re-examined using potentiostatically de-intercalated single crystal samples. Stable phases of x 0.87, 0.72, 0.53, 0.50, 0.43, and 0.33 were found and isolated for physical property studies. A-type and chain-type antiferromagnetic orderings have been suggested from magnetic susceptibility measurement results in x 0.87 and 0.50 below 10K and 200K, respectively, similar to those found in NaxCoO2 system. There is no Li vacancy superlattice ordering observed at room temperature for the electronically stable phase Li0.72CoO2 as revealed by synchrotron X-ray Laue diffraction. The peculiar magnetic anomaly near 175K as often found in powder samples of x0.46-0.78 cannot be isolated through this single crystal potentiostatic method, which supports the previously proposed explanation to be surface stabilized phase of significant thermal hysteresis and aging character.
pacs:
75.25.-j, 75.30.Gw, 61.72.jd, 63.22.Np, 71.30.+h, 74.62.Bf
I Introduction
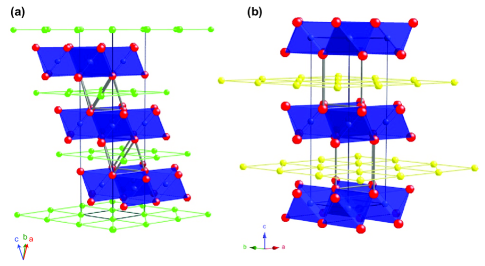
Both layered P2-NaxCoO2 (also called -phase) and O3-LixCoO2 (also called -phase) compounds have been investigated intensely as a rechargeable battery electrode material, and the latter, in particular, has been commercialized, based on its proper application voltage, high energy density, and high rate capacity.Goodenough2010 In general, both systems are composed of alternating layers of CoO2 and alkali metal with 2D hexagonal symmetry. As illustrated in Fig. 1, the major difference lies in the oxygen coordination near the cations, i.e., P2-NaxCoO2 can be described by P63/mmc space group with two opposite prismatic NaO6 layers (P2) sandwiched between Co-layers per unit, while LixCoO2 shows rhombohedral Rm or trigonal layer symmetry with three gliding layers of LiO6 octahedra (O3) sandwiched in between Co-layers per unit when drawn in hexagonal form.Amatucci1996 The surprising finding of superconductivity in NaxCoO2yH2O (x 1/3 and y 4/3) has generated intense investigation on the rich electronic phase digram of NaxCoO2, including antiferromagnetic ordering, metal-insulator transition, and superconductivity.Takada2003 ; Foo2004 On the other hand, detailed LixCoO2 electronic phase diagram remains to be illusive while being hindered by the availability of sizable high quality single crystal samples with well-controlled homogeneous Li content.
Na vacancy cluster ordering in layered NaxCoO2 has been shown to be a fascinating phenomenon since the various superstructures were observed through neutron and synchrotron X-ray diffraction techniques.Roger2007 ; Chou2008 The strong correlation between vacancy cluster ordering pattern and the distinct physical properties at specific x values has been explored in detailed since.Shu2010 ; Shu2009 However, although similar characteristic surface potential V vs. x behaviors have been found in the nearly isostructural LixCoO2 through repeated electrochemical galvanostatic charge/discharge scans, both in-situ and ex-situ, the expected similar Li vacancy orderings from the nearly isostructural LixCoO2 have been implied yet never observed with solid evidence.Amatucci1996 ; Hertz2008 While the existence of electronically stable phases revealed by the characteristic surface potential do not mean that the preferred specific charge levels would lead to specific Li-vacancy ordering, it is still possible that similar Li vacancy ordering does exist, except that it is smeared at room temperature as a result of thermal fluctuation. In fact, the first-principles calculation predicted that most stable phases of Li vacancy orderings occur only below x=1/2.VanderVen1998 In this report, we have confirmed that no Li vacancy ordering exists for x 0.72 at room temperature, based on synchrotron X-ray Laue diffraction.
While studies on the structure and electrochemical properties of LixCoO2 using polycrystalline sample for the purpose of battery application, physical property exploration using single crystal samples is rare due to its scarce availability. Most of the electronic phase diagrams mapped so far were based on powder samples.Mukai2007 ; Sugiyama2005 ; Hertz2008 ; Motohashi2009 On the other hand, the very few reports based on single crystal samples used either chemical de-intercalation or electrochemical galvanostatic de-intercalation methods,Miyoshi2009 which we will argue in the following as having potential multi-phase issue, not to mention the conclusions drawn from single crystal LixCoO2 samples prepared through ion-exchange route by P2-NaxCoO2.Miyoshi2010 In fact, it is highly likely that the inclusion of O2-LixCoO2, instead of the expected O3-LixCoO2, may have occurred through ion-exchanged P2-NaxCoO2 original.Carlier2001
Detailed studies based on single crystal sample through the electrochemical potentiostatic de-intercalation route have not been reported so far. The particle size difference and packing density could affect the charging efficiency and surface potential readings for the study based on polycrystalline samples. The common practice of galvanostatic charging based on C-rate in the battery study, i.e., charging rate set on a fraction of the capacity, becomes impractical when there are particularly stable phases existing, instead of a complete solid solution for the ion intercalation. In order to study the electronic phase diagram of LixCoO2 accurately, we report phase studies based on single crystal samples that have been prepared electrochemically using the potentiostatic route, similar to the techniques that have been applied successfully to the P2-NaxCoO2 study previously.Shu2007 The potential drawback of surface-versus-bulk difference on the transient galvanostatic scan is avoided, in particular, since sensitive magnetic property interpretation can only be addressed when homogeneous Li (Vacancy) contribution for specific single phase is perfectly isolated without ambiguity. These findings are able to clarify the inconsistency among results obtained through different grain sizes and de-intercalation methods so far.
II Experimental details
A complete series of single crystal LixCoO2 sample with x 0.33-0.87 were prepared from electrochemical de-intercalation of the pristine single crystal Li0.87CoO2. The pristine single crystal Li0.87CoO2 was grown using flux method starting from a mixture of LiCoO2 : Li2O2: LiCl = 1 : 4 : 4, where LiCoO2 was prepared from Li2CO3 and Co3O4 powder with a molar ratio of Li:Co=1:1 and heated at 900 ∘C for 24 hours. The mixture was sealed in an alumina crucible using alumina cement, heated to 900 ∘C, soaked for 5 hours, slowly cooled to 600 ∘C at a rate of 2 ∘C/hr, and finally furnace cooled to room temperature. The as-grown single crystal has a typical size of 550.1mm3, with Li content of x 0.87 based on inductively coupled plasma-mass spectrometer (ICP) analysis, which is lower than the expected x=1 due to Li vapor loss under the cement sealing condition. Li content was reduced further through an electrochemical potentiostatic de-intercalation process using various constant applied voltages, where Li0.87CoO2 single crystal was used as working electrode, 1M LiClO4 in propylene carbonate as electrolyte, and Platinum as counter and reference electrodes. All Li contents of LixCoO2 were examined by ICP method to be within error of 0.01 and verified using the c-axis vs. x plot.Amatucci1996 Lattice parameters were analyzed using Bruker D-8 diffractometer and the magnetic properties were measured using Quantum Design SQUID-VSM. The single crystal samples of Li0.87CoO2 and Li0.5CoO2 were further examined using Laue diffraction method with synchrotron X-ray generated from 20 keV at the Taiwan-NSRRC.
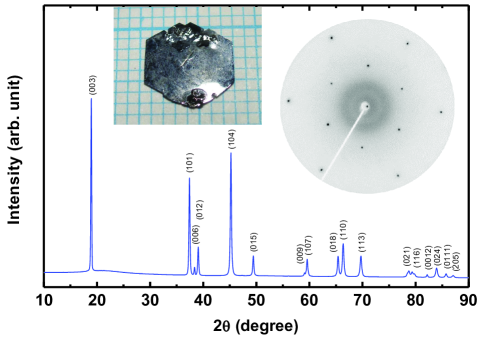
For the purpose of a detailed electronic phase diagram study on LixCoO2, lithium content and homogeneity has been crucial on its reliability. Besides the lithium content determined and confirmed through ICP analysis plus lattice parameter comparison as described above, the homogeneity of lithium distribution has been examined carefully using synchrotron X-ray diffraction and spin susceptibility analysis. The phase purity and crystal structure of the as-grown single crystal sample has been characterized fully using synchrotron X-ray Laue and powder diffraction as shown in Fig. 2. The as-grown crystal shows hexagonal morphology which is expected for sample possesses hexagonal CoO2 symmetry within the basal plane. Synchrotron Laue diffraction shown in the inset of Fig.2 confirmed the Rm symmetry for the crystal perpendicular to the CoO2 plane with correct index without impurity or superlattice spots. Lithium homogeneity for each x content has been guaranteed through potentiostatic electrochemical de-intercalation method, where the final induced charge transfer current has been saturated for more than 12 hours at the background level to warrant complete conversion for the whole crystal specimen at the designated OCP. X-ray diffraction peak width (FWHM) which reflects lithium homogeneity has been confirmed to be maintained within 0.050.01 degree for the whole range of crystal samples studied (not shown).
III Results and Discussions
III.1 Electronic phase diagram
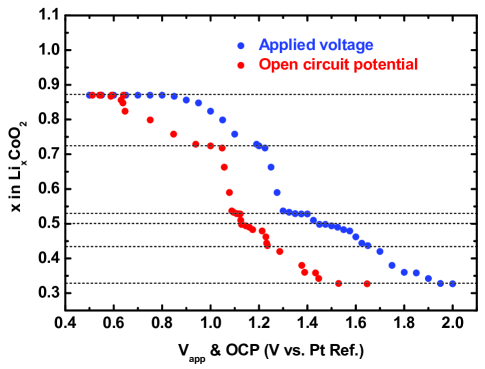
In general, open circuit potential (OCP) represents the chemical potential (relative to the reference electrode potential) of a material when the sample acts as a working electrode in the electrochemical cell. The applied overpotential above (or below) the current OCP would induce charge transfer between the electrolyte and the working electrode surfaces, and the induced current decays until OCP is tuned to the new level. The phase diagram mapped by x vs. V as shown in Fig. 3 reveals several stable phases from the plateau of x vs. V, which closely correlate with the specific Li contents near 0.72, 0.53, 0.50, 0.43, and 0.33. Although the stacking sequences between alkali metal and CoO2 layers and the space group are different between NaxCoO2 and LixCoO2, the basic character of the x vs. V plot for LixCoO2 is very similar to that found for NaxCoO2.Amatucci1996 ; Hertz2008 ; Motohashi2009 It is not surprising to find phases with x 1/2 and 1/3 when both systems have similar CoO2 networks of 2D triangular lattice. In addition, in proximity to the exact half filling, there are metastable phases of x 0.53 and 0.43 found for LixCoO2. Similar phases have also been identified in NaxCoO2 near x 0.55 and 0.43 as reported earlier.Shu2007 ; Shu2008
Although P2-NaxCoO2 and O3-LixCoO2 have different gliding sequences and alkaline metal ion environments as shown in Fig. 1, it is interesting to find that Li0.72CoO2 shows particular stability similar to the fully characterized stable phase of Na0.71CoO2. Na0.71CoO2 has been identified by synchrotron Laue X-ray with a proposed simple hexagonal aa3c superstructure model formed by Na vacancy multivacancy clusters before.Chou2008 ; Huang2009 ; Huang2010 Na vacancy level that leads to the x=0.71 phase formation is a result of perfect tri- and quadri-vacancy stacking in the space group of P63/mmc symmetry (or P31 after Na ordering is considered), i.e., closely related to the necessity of inversion symmetry between the nearest-layer oxygen positions. While LixCoO2 has been described in the space group of Rm with CoO2 layers to glide along the [111] direction of three Li-CoO2 per unit in the hexagonal description as shown in Fig. 1, the Li vacancy level that is responsible for the existence of x 0.72 stable phase is puzzling.
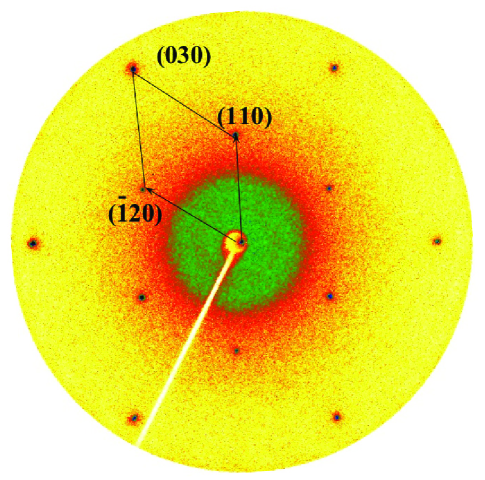
To search for the possible Li vacancy ordering, Laue pattern for Li0.72CoO2 obtained using synchrotron X-ray is shown in Fig. 4. While the transmission Laue is taken perpendicular to the CoO2 layer, a clear hexagonal symmetry can be indexed. Comparing with the Laue pattern of Na0.71CoO2 with well-defined a hexagonal superlattice,Chou2008 no superlattice can be identified besides the main low indexing (hk0) planes constructed by the hexagonal Co network of a=2.8156 . Contrary to the Na0.71CoO2 superlattice, which is required by the Na trimer formation under P63/mmc symmetry, Li0.72CoO2 has no similar symmetry condition, but, on the other hand, sits close to the phase boundary of the two-phase region between 0.75-0.94 as reported previously.Hertz2008 ; Amatucci1996 ; Reimers1992 The phase of relatively shorter c-axis of the two-phase could be related to the partial O2-like gliding as suggested by Carlier et al. for the P2- to O2- structural transition.Carlier2001 It is possible that the particular stability of Li0.72CoO2 may have nothing to do with specific Li vacancy ordering, but rather closely related to the requirement of missing O2-like gliding after the screening effect is weakened by the lower Li level between the CoO2 blocks.
It is very difficult to obtain single phase Li0.72CoO2 using potentiostatic method without going through an extreme fine tuning process on applied voltage, mostly because it sits between the 0.75-0.94 two-phase region (to be discussed in the following sections), and the steep and narrow voltage range for 0.72-0.52 phase formation as shown in Fig. 3. Li-Co chemical disordering has also been ruled out based on the finite-temperature calculation results,Wolverton1998 although supporting evidence has been found experimentally in the literature.Menetrier2008 The average diffusion coefficient at room temperature obtained from polycrystalline LixCoO2 is in the order of DLi 10-12,Jang2001 which is nearly four orders lower (DNa10-8 cm2/s) than that of NaxCoO2 estimated from single crystal study,Shu2008 except that the minima of DNa’s near those specifically stable phases of x 0.71, 0.50, and 0.33 fall to the same average level as DLi. Although the reported DLi values in the literature vary from 10-13-10-7 and the differences have been attributed to the assumption of geometrical factors used in the calculation,Jang2001 it is still possible that the specific Li vacancy level of LixCoO2 does not induce enough chemical potential reduction for potential ionic ordering mechanism, as demonstrated by the missing of Li vacancy ordering for Li0.72CoO2.
Based on OCP studies for LixCoO2 sample electrode as shown in Fig.3, there are two extra phases in proximity to the exact half filling of x = 0.5, i.e., the two distinguishable stable phases revealed by the narrow plateau near 0.53 and 0.43, which have also been observed under galvanostatic scan previously.Clemencon2007 ; Jang2001 These two specific x values are close to those found in NaxCoO2 system near x 0.55 and 0.43 with distinctly different Laue superlattice patterns and magnetic phase transitions.Shu2007 The origin of phases with slight deviation from exact x=1/2 remains to be explored, but preliminary electron diffraction studies for NaxCoO2 with x near 0.5 has been attributed to the metastable phases in proximity to the exact half-filling as a result of alternating vacancy rich/poor 1D Na zigzag chains.Huang2011a
III.2 Magnetic susceptibilities
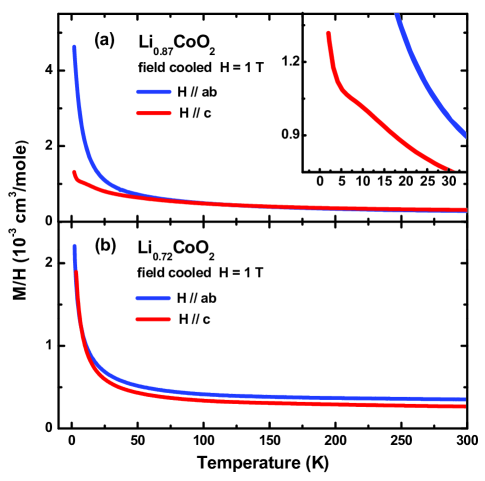
Magnetic susceptibilities for LixCoO2 (x 0.87, 0.72) single crystals are summarized in Fig. 5. These results differ significantly from those reported previously based on either powder or single crystal samples prepared with chemical or galvanostatic de-intercalated methods.Motohashi2009 ; Miyoshi2010 We find that the signal size of magnetic anomalies revealed by the sensitive SQUID magnetometry on single crystal samples are very weak, which cannot be reliably observed in polycrystalline samples, especially when inhomogeneity cannot be ruled out in chemical or galvanostatic de-intercalation processes. Besides, magnetic impurity of Co3O4 may become dominant below 50K under certain annealing conditions and the muon spin resonance tool shows limited sensitivity in this range.Artemenko2009 ; Sugiyama2009
As shown in Fig. 5(a), the anisotropic magnetic anomaly found near 10K for the as-grown Li0.87CoO2 clearly indicates the existence of possible A-type antiferromagnetic ordering, similar to that found previously in NaxCoO2 for x 0.82-86, where the magnetization is reduced for Hc to signal antiparallel spin arrangement in c-direction.Shu2007 ; Shu2009 The A-type antiferromagnetic (A-AF) ordering for Na0.82CoO2 has been confirmed through neutron scattering experiment before,Bayrakci2004 where the interlayer AF coupling coexists with an in-plane ferromagnetism (FM) of itinerant electron spins.Chou2008 The similar finding of A-AF behavior in the as-grown Li0.87CoO2 is not surprising, although it has not been observed through magnetic susceptibility measurement before to the best of our knowledge.
The magnetic susceptibilities for Li0.72CoO2 shown in Fig. 5(b) demonstrate similar magnetic behavior to that of Na0.71CoO2 also, i.e., no magnetic anomaly has been found between 1.7-300K, which is in great contrast to the finding of 175K phase transition reported previously.Hertz2008 ; Miyoshi2010 ; Sugiyama2009 Hertz et al. have examined the confusing 175K anomaly carefully before and ruled out the possibility of the existence of Co-O impurities. In addition, the observed aging effect of 175K anomaly strongly implies the occurrence of magnetic moment induced by local microscopic Li inhomogeneity.Hertz2008 We suspect that Li inhomogeneity becomes the major problem for samples prepared using chemical or galvanostatic de-intercalation methods. This can also be argued from the persistent observation of the 175K phase transition with various intensities found in the whole range of x 0.78-0.46, a typical example of possible inclusion of identical impurity phase with strong magnetic signal contribution.Miyoshi2010 ; Hertz2008 On the other hand, our single crystal samples were prepared with well-controlled potentiostatic de-intercalation method to warrant Li homogeneity until there was no difference on the potential reading between surface and the bulk. Besides, there are two different c-axes detected in the range of 0.72-1 before single phase formation below 0.72 as reported by various preparation methods and summarized in Fig. 6. A first order metal-insulator Mott transition has also been proposed for x 0.75 based on density function theory (DFT) calculations, which could be closely related to the two phase coexistence in the same range as a result of gradual de-localization from x 0.95.Marianetti2004 Phase purity requirement for the physical property investigation becomes crucial when Li inhomogeneity cannot be controlled easily, especially when electrochemical process can only detect the surface potential.
Curie-Weiss law fitting for the paramagnetic behavior of the spin susceptibilities for Li0.72CoO2 shows that Curie constant is 0.011 cm3-K/mole, which is nearly one tenth of that for Na0.71CoO2 reported previously.Chou2008 The significantly lower level of localized spins suggests that the doped holes resulting from Li vacancy are mostly mobile. This observation is consistent with the absence of Li vacancy ordering in the synchrotron Laue photograph, while superlattice ordering of Na vacancy cluster has been proposed to create more localized spins near the vacancy cluster centers and the rest of the doped holes are itinerant.Chou2008 ; Balicas2008 The absence of magnetic ordering for the local moment on a frustrated lattice has been suggested to be a unique spin liquid state for Na0.71CoO2. Similar behavior for Li0.72CoO2 deserves further investigation also.
III.3 Crystal structures
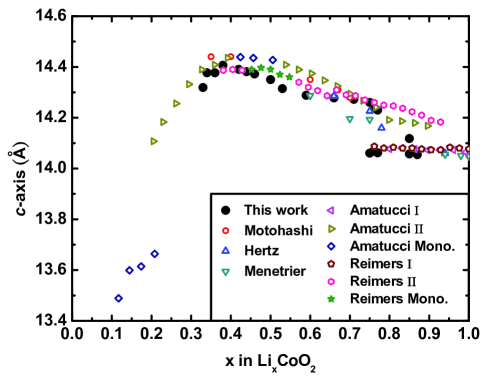
The c-axis lattice parameters from five published works plus our current results are summarized in Fig. 6.Amatucci1996 ; Hertz2008 ; Motohashi2009 ; Reimers1992 ; Menetrier1999 We note that the as-grown single crystal Li0.87CoO2 falls in the reported two-phase region; however, the as-grown crystal is clearly single phase with smaller c-axis, similar to those for x 0.95. The two-phase phenomenon must be coming from the domain-like de-intercalation process before x0.72 is achieved, which should occur only in the de-intercalation process at room temperature but not through the melt growth condition at high temperatures, as additionally verified by the two-phase observation in our crystal samples of 0.72x0.87 obtained by following electrochemical de-intercalation. The main reason for the persistent two-phase for x0.72-1 has been proposed theoretically to be a first order metal-insulator transition as a Mott transition of impurities, where high mobility of Li vacancies allows the 25 vacancy metallic phase to grow at the expense of insulating phase of x0.95 at room temperature.Marianetti2004 It is noted that c-axes values for 0.33 x 0.72 obtained in this study (Fig. 6) are consistently lower than those widely distributed values reported previously.Amatucci1996 ; Reimers1992 Li inhomogeneity in powder samples is a reasonable assumption to explain the difference, i.e., it is highly likely that the Li contents were over-estimated before as a result of surface-to-bulk potential difference during de-intercalation process for the powder sample, i.e., possibly with mixture of low x phases which are closer to x0.5 at the grain boundaries, especially when galvanostatic de-intercalation route has been applied.
III.4 Monoclinic Li0.5CoO2
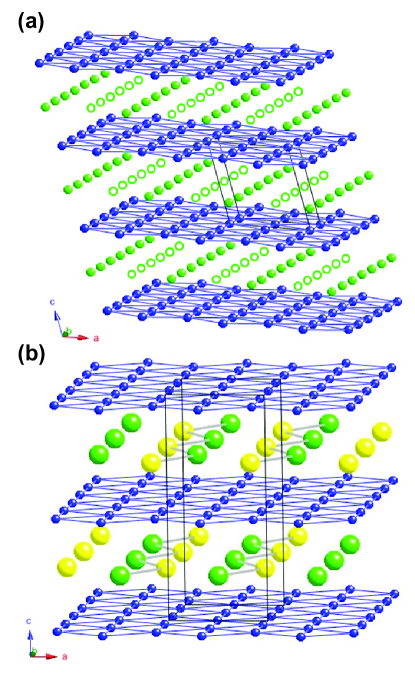
Monoclinic distortion has been observed previously in LixCoO2 close to x0.5 and 0.2 at room temperatures.Amatucci1996 ; Reimers1992 The crystal structure of Li0.5CoO2 has been identified as monoclinic lattice with space group .Takahashi2007 ; Shao-Horn2003 The gliding blocks of CoO2 and Li for LixCoO2 with Rm symmetry of three Li-CoO2 layers per unit must favor the monoclinic distortion when Li content is reduced to half. In addition, the alternating linear Li-vacancy chains for Li0.5CoO2 is quite different from the zigzag Na chain in Na0.5CoO2.Huang2004 Li in O3-LixCoO2 has only one site, which sits directly beneath the Co column, similar to the Na1 site in P2-NaxCoO2.Chou2008 But when cation vacancy is generated through de-intercalation, Na ion can move from the originally energetically favorable Na2 site to the now energetically more favorable Na1 site to form Na-trimer or multi-vacancy cluster,Roger2007 which is not a possible mechanism under LixCoO2 Rm symmetry, and an alternative Monoclinic distortion mechanism is chosen. In fact, mazed domain structure of monoclinic Li0.5CoO2 has been revealed through electron diffraction before, where equivalent domains of in-plane Li-vacancy ordering and other nm size domains of variants exist.Shao-Horn2003
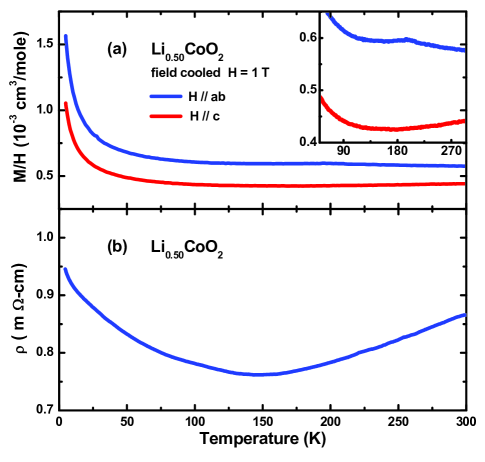
The magnetic susceptibility and resistivity measurement results for Li0.5CoO2 are shown in Fig. 8. There is a small dip of susceptibility found near 200K for Hab only as revealed in the inset of Fig. 8(a), but no corresponding anomaly found for Hc, which is similar to the behavior of antiferromagnetic transition near 88K found in Na0.5CoO2. This AF spin ordering for Na0.5CoO2 has been proposed to be coming from the alternating rows of AF ordered and nonordered Co ions within the ab-plane.Gasparovic2006 Columns of alternating Li-vacancy for Li0.5CoO2 is shown in Fig. 7(a).Shao-Horn2003 ; Takahashi2007 The anisotropic anomaly near 200K for Li0.5CoO2 could be coming from a similar AF ordering, and spin polarized neutron scattering should be performed to check this possibility. For Na0.5CoO2 shown in Fig. 7(b), the intricate Co columns sandwiched between upper and lower zigzag Na chains must form the ordered Co with AF spins, while the in-between Co columns are spinless as supported by the neutron scattering study results.Gasparovic2006 Similarly, Li0.5CoO2 also possesses alternating Li-vacancy columns and the nearby Co columns must generate similar ordered AF ordered spins and non-ordered spinless columns in the hexagonal Co-plane.
Although there is a significant metal-to-insulator transition follows at 51K for Na0.5CoO2, there is only a very weak increase of resistivity found below 150K for Li0.5CoO2. The metal-insulator transition below 51K for Na0.5CoO2 has been attributed to the charge localization as a result of delicate balance between local Coulomb repulsion and kinetic energy in the CoO2 plane when ideal interpenetrating filled (spinless) and half-filled (with spin) orthorhombic sub-lattices are constructed.Choy2007 On the other hand, there is no clear metal-to-insulator transition observed down to 4.2K for Li0.5CoO2, except a resistivity minimum occurs near 150K as shown in Fig. 8(b). Unlike the maintained Na zigzag chain ordering along the c-direction for Na0.5CoO2, the monoclinic distortion for Li0.5CoO2 along c-axis must be responsible for the missing charge ordering when 3D ordering along c-direction is broken.
III.5 De-intercalation and Li homogeneity
| Reference | deintercalation method | powder/crystal | 175K anomaly |
|---|---|---|---|
| Imanishi et al. 1999Imanishi1999 | chemical | powder | x0.76-0.61 |
| Menetrier et al. 1999Menetrier1999 | EC galvanostatic | powder | N.A. |
| Clemencon et al. 2007Clemencon2007 | EC galvanostatic | powder | N.A. |
| Mukai et al. 2007Mukai2007 | EC galvanostatic | powder | x0.75-0.50 |
| Hertz et al. 2008Hertz2008 | chemical | powder | x0.78-0.51 |
| Kawasaki et al. 2009Kawasaki2009 | EC galvanostatic | powder | N.A. |
| Sugiyama et al. 2009Sugiyama2009 | EC galvanostatic | powder | x0.73-0.53 |
| Motohashi et al. 2009Motohashi2009 | EC galvanostatic | powder | x0.70-0.50 |
| Mohanty et al. 2009Mohanty2009 | chemical | powder | no |
| Miyoshi et al. 2010Miyoshi2010 | ion exchange+chemical | single crystal | x0.71-0.46 |
| Ishida et al. 2010Ishida2010 | ion exchange+chemical | thin film | x0.66 |
| This work | EC potentiostatic | single crystal | no |
It has been puzzling to find that there is one persistent phase that can be identified through several experimental techniques near 150-175K within a wide range of x 046-0.78 as summarized in Table 1. In addition, the observed 175K phase anomaly shows a significant thermal hysteresis in both resistivity and magnetic susceptibility measurements.Miyoshi2010 ; Motohashi2009 The persistent existence of one phase signature in a wide range of lithium content suggests that such phase has not been isolated completely from the co-existing phase mixture. The observation of thermal hysteresis also strongly suggests that such hard-to-extract phase could be closely related to a phase existence within extremely narrow phase space, i.e., slight deviation due to inhomogeneity could create phase separation of small miscibility gap. In fact, Hertz et al. have proposed that the detected 175K anomaly could be associated with a phase that can only be stabilized at the surface or grain boundaries, as suggested by its aging character and mostly found in powder samples.Hertz2008 Examine the electronic phase diagram mapped by the potentiostatic de-intercalation method as shown in Fig. 3, we find that indeed there exists a sharp x vs V slope within 20 mV for sample preparation of x0.52-0.72, i.e., small deviation on applied potential would produce two-phase coexistence unless post annealing at 120∘C is applied. We failed to isolate the expected phase that shows similar 175K anomaly after repeated careful tuning of Vapp near 125 mV following the electronic phase diagram shown in Fig. 3,. Although these negative results cannot exclude the existence of a phase that shows 175K anomaly as revealed by several experimental techniques, which strongly supports that this peculiar phase must exist within a extremely narrow phase space to be isolated cleanly or associate with surface and grain boundaries closely.
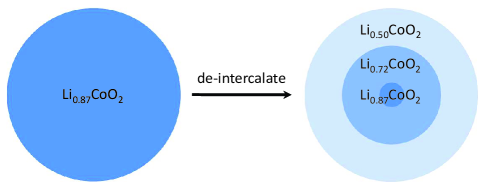
Most early studies of LixCoO2 phase diagram used galvanostatic scans on polycrystalline samples in electrochemical battery cells, and the stable phases were isolated using the characteristic surface potential and X-ray diffraction. The battery construction using fine polycrystalline sample is efficient for revealing the occurrence of stable phases through surface potential with total charge estimated using Faraday’s law. Alternatively, chemical de-intercalation using oxidant under various concentrations can also serve the same purpose, as summarized in Table 1. However, these processes are of approximation for a quasi-equilibrium process at the limited time scale, i.e., unless the charging rate of galvanostatic current density is lower than the Li diffusion rate, and the charging process can be stopped immediately after reaching the targeted levels. Strictly speaking, galvanostatic de-intercalation method cannot guarantee single phase formation with accurate charge integration, especially when multiple stable phases continue to build up on the outer layers of the particle, yet only the surface potential is recorded. Radial and Mosaic models have been proposed to describe the intercalation problem for the battery electrode material LixFePO4 with only two stable phases of x = 1 and 0,Andersson2001 but there are more stable phases identified in LixCoO2 as proposed in Fig. 9 following a Radial model description. It is demonstrated that the delithiation process cannot be a complete process in the galvanostatic scan, i.e., there is always remanent stable phases in the inner core area that cannot be reached in time galvanostatically when the charging current is terminated by the achieved surface potential before diffusion process is completed.
IV Conclusions
In summary, by using a series of potentiostatically de-intercalated single crystal LixCoO2, we find great similarity between electronic phase diagrams of NaxCoO2 and LixCoO2. Contrary to most reports based on powder sample prepared with galvanostatic or chemical de-intercalation methods, current work revealed an A-type antiferromagnetic signature for x 0.87 and the non-existence of magnetic ordering down to 1.7K for x 0.72. Although Li0.72CoO2 shows similar stoichiometry and particular stability compared to Na0.71CoO2 with well-defined Na vacancy superlattice ordering, the former does not possess any Li vacancy ordering. Near half filling of Li, three phases of x 0.53, 0.50, and 0.43 have been identified and isolated to show distinct physical properties. Comparing with Na0.5CoO2, no metal-insulator transition has been found for Li0.5CoO2, although similar antiferromagnetic ordering is implied below 200K. Based on a Radial model interpretation, current potentiostatic study results based on single crystal samples support that the widely observed within x 0.75-0.50 but hard-to-extract phase with a magnetic anomaly near 175K could be related to a minor phase sitting preferentially on the surface or grain boundaries.
Acknowledgment
FCC acknowledges the support from National Science Council of Taiwan under project number NSC-99-2119- M-002-011-MY2.
References
- (1) J. B. Goodenough and Y. Kim, Chem. Mater. 22, 587 (2010).
- (2) G. G. Amatucci, J. M. Tarascon, and L. C. Klein, J. Electrochem. Soc. 143, 1114 (1996).
- (3) K. Takada, H. Sakurai, E. T. Muromachi, F. Izumi, R. A. Dilanian, and T. Sasaki, Nature 422, 53 (2003).
- (4) M. L. Foo, Y. Wang, S. Watauchi, H. W. Zandbergen, T. He, R. J. Cava, and N. P. Ong, Phys. Rev. Lett. 92, 247001 (2004).
- (5) M. Roger, D. J. P. Morris, D. A. Tennant, M. J. Gutmann, J. P. Goff, J.-U. Hoffmann, R. Feyerherm, E. Dudzik, D. Prabhakaran, A. T. Boothroyd, N. Shannon, B. Lake, and P. P. Deen, Nature 445, 631 (2007).
- (6) F. C. Chou, M.-W. Chu, G. J. Shu, F.-T. Huang, W. W. Pai, H. S. Sheu, and Patrick A. Lee, Phys. Rev. Lett. 101, 127404 (2008).
- (7) G. J. Shu, F.-T. Huang, M.-W. Chu, J.-Y. Lin, Patrick A. Lee, and F. C. Chou, Phys. Rev. B 80, 014117 (2009).
- (8) G. J. Shu, W. L. Lee, F.-T. Huang, M.-W. Chu, Patrick A. Lee, and F. C. Chou, Phys. Rev. B 82, 054106 (2010).
- (9) J. T. Hertz, Q. Huang, T. McQueen, T. Klimczuk, J. W. G. Bos, L. Viciu, and R. J. Cava, Phys. Rev. B 77, 075119 (2008).
- (10) A. Van der Ven, M. K. Aydinol, G. Ceder, G. Kresse, and J. Hafner, Phys. Rev. B 58, 2975 (1998).
- (11) K. Mukai, Y. Ikedo, H. Nozaki, J. Sugiyama, K. Nishiyama, D. Andreica, A. Amato, P. L. Russo, E. J. Ansaldo, J. H. Brewer, K. H. Chow, K. Ariyoshi, and T. Ohzuku, Phy. Rev. Lett 99, 087601 (2007).
- (12) J. Sugiyama, H. Nozaki, J. H. Brewer, E. J. Ansaldo, G. D. Morris, and C. Delmas, Phy. Rev. B 72, 144424 (2005).
- (13) T. Motohashi, T. Ono, Y. Sugimoto, Y. Masubuchi, S. Kikkawa, R. Kanno, M. Karppinen, and H. Yamauchi, Phys. Rev. B 80, 165114 (2009).
- (14) K. Miyoshi, C. Iwai, H. Kondo, M. Miura, S. Nishigori, and J. Takeuchi, J. Phys.: Conf. Ser. 150, 042129 (2009).
- (15) K. Miyoshi, C. Iwai, H. Kondo, M. Miura, S. Nishigori, and J. Takeuchi, Phys. Rev. B 82, 075113 (2010).
- (16) D. Carlier, I. Saadoune, L. Croguennec, M. Menetrier, E. Suard, and C. Delmas, Solid State Ionics 144, 263(2001).
- (17) G. J. Shu, A. Prodi, S. Y. Chu, Y. S. Lee, H. S. Sheu, and F. C. Chou, Phys. Rev. B 76, 184115 (2007).
- (18) G. J. Shu and F. C. Chou, Phys. Rev. B 78, 052101 (2008).
- (19) F.-T. Huang, M.-W. Chu, G. J. Shu, H. S. Sheu, C. H. Chen, L.-K. Liu, Patrick A. Lee, and F. C. Chou, Phys. Rev. B 79, 014413 (2009).
- (20) F.-T. Huang, A. Gloter, M.-W. Chu, F. C. Chou, G. J. Shu, L.-K. Liu, C. H. Chen, and C. Colliex, Phys. Rev. Lett. 105, 125502 (2010).
- (21) J. N. Reimers and J. R. Dahn, J. Electrochem. Soc. 139, 2091 (1992).
- (22) C. Wolverton and A. Zunger, Phys. Rev. Lett. 81, 606 (1998).
- (23) M. Menetrier, D. Carlier, M. Blangero, and C. Delmas, Electrochemical and Solid-State Letters, 11, A179 (2008).
- (24) Y.-I. Jang, B. J. Neudecker, and N. J. Dudney, Electrochemical and Solid-State Letters, 4, A74 (2001).
- (25) A. Clemencon, A.T. Appapillai, S. Kumar, and Y. Shao-Horn, Electrochimica Acta 52, 4572 (2007).
- (26) F.-T. Huang et al., unpublished.
- (27) A. Artemenko, M. Menetrier, M. Pollet, and C. Delmas, J. Appl. Phys. 106, 064914 (2009).
- (28) J. Sugiyama, K. Mukai, Y. Ikedo, H. Nozaki, M. Mansson, and I. Watanabe, Phys. Rev. Lett. 103, 147601 (2009).
- (29) S. P. Bayrakci, C. Bernhard, D. P. Chen, B. Keimer, R. K. Kremer, P. Lemmens, C. T. Lin, C. Niedermayer, and J. Strempfer, Phys. Rev. B 69, 100410(R) (2004).
- (30) C. A. Marianetti, G. Kotliar, and G. Ceder, Nature materials 3, 627 (2004).
- (31) L. Balicas, Y. J. Jo, G. J. Shu, F. C. Chou, and Patrick A. Lee, Phys. Rev. Lett. 100, 126405 (2008).
- (32) M. Me ne trier, I. Saadoune, S. Levasseur, and C. Delmas, J. Mater. Chem. 9, 1135 (1999).
- (33) Y. Shao-Horn, S. Levasseur, F. Weill, and C. Delmas, J. Electrochem. Soc. 150, A366 (2003).
- (34) Y. Takahashi, N. Kijima, K. Dokko, M. Nishizawa, I. Uchida, and J. Akimoto, J. Sol. St. Chem. 180, 1020 (2007).
- (35) Q. Huang, M. L. Foo, R. A. Pascal, Jr., J. W. Lynn, B. H. Toby, Tao He, H. W. Zandbergen, and R. J. Cava, Phys. Rev. B 70, 184110 (2004).
- (36) G. Gasparovic, R. A. Ott, J.-H. Cho, F. C. Chou, Y. Chu, J. W. Lynn, and Y. S. Lee, Phys. Rev. Lett. 96, 046403 (2006).
- (37) T.-P. Choy, D. Galanakis, and P. Phillips, Phys. Rev. B 75, 073103 (2007).
- (38) N. Imanishi, M. Fujiyoshi, Y. Takeda, O. Yamamoto, and M. Tabuchi, Solid State Ionics 118, 121 (1999).
- (39) S. Kawasaki, T. Motohashi, K. Shimada, T. Ono, R. Kanno, M. Karppinen, H. Yamauchi, and G. Q. Zheng, Phys. Rev. B 79, 220514(R) (2009).
- (40) D. Mohanty and H. Gabrisch, ECS Transations 19, 25 (2009).
- (41) Y. Ishida, A. Mizutani, K. Sugiura, H. Ohta, and K. Koumoto, Phys. Rev. B 82, 075325 (2010).
- (42) A. S. Andersson and J. O. Thomas, Journal of Power Sources 97-98, 498 (2001).