NGC454: unveiling a new “changing look” AGN
Abstract
We present a detailed analysis of the X-ray spectrum of the Seyfert 2 galaxy NGC454E, belonging to the interacting system NGC454. Observations performed with Suzaku, XMM-Newton and Swift allowed us to detect a dramatic change in the curvature of the 2–10 keV spectrum, revealing a significant variation of the absorbing column density along the line of sight (from cm-2 to cm-2). Consequently, we propose this source as a new member of the class of “changing look” AGN, i.e. AGN that have been observed both in Compton-thin (=) and reflection dominated states (Compton-thick, ). Due to the quite long time lag (6 months) between the Suzaku and XMM-Newton observations we cannot infer the possible location of the obscuring material causing the observed variability. In the 6–7 keV range the XMM-Newton observation also shows a clear signature of the presence of an ionized absorber. Since this feature is not detected during the Suzaku observation (despite its detectability), the simplest interpretation is that the ionized absorber is also variable; its location is estimated to be within pc from the central black hole, probably much closer in than the rather neutral absorber.
keywords:
galaxies: active – galaxies: individual (NGC454) – X-rays: galaxies1 Introduction
There is now a general consensus that Active Galactic Nuclei (AGN) are powered by accretion of matter onto a supermassive black hole (SMBH), located at center of almost all massive galaxies. It is also clear that, according to the Unified Model of AGN (Antonucci 1993), the difference between type 1 and type 2 AGN can be explained through orientation effects between our line of sight to the nucleus and “circum-nuclear material”. However, the geometry, size and physical state of this circum-nuclear matter are still a matter of debate. In particular, the AGN X-ray spectra are complex and consist of multiple components (see Turner & Miller 2009, Done 2010 for a review), which are all intimately related to the still poorly understood condition of the matter near the nucleus. This circum-nuclear gas imprints features - low energy cut-offs, the Compton hump and emission and absorption lines - onto the primary X-ray emission. The X-ray spectra and, crucially, their variability observed in few nearby AGN showed that this matter is highly structured with a range of ionisation states, densities, geometries and locations (Turner & Miller 2009, Risaliti 2010). In this respect, the significant variability of the absorbing column density () detected in the so called “changing look” AGN, i.e. AGN that have been observed both in Compton-thin (=) and reflection dominated states () (Risaliti et al. 2002), implies that the absorbing material has to be clumpy and at much smaller distance than the conventional obscuring “torus” with velocity, distance and size from the central X-ray source of the same order of those of the Broad Line Region (BLR) clouds.
Up to now, we can count only a few “changing look” AGN where such a variability
has been discovered on time-scales from a few days down to a few hours:
NGC 1365 (Risaliti et al. 2005, 2007, 2009), NGC 4388 (Elvis et al. 2004), NGC 7674 (Bianchi et al. 2005),
NGC 4151 (Puccetti et al. 2007), NGC 7582 (Bianchi et al. 2009), UGC 4203 (Risaliti et al. 2010), NGC4051 (Uttley et al. 2004; Lobban et al. 2011) and 1H 0419-577 (Pounds et al. 2004). Among them we recall NGC2992 (Weaver et al. 1996), however for this source one year monitoring with RXTE (Murphy et al. 2007) unveiled the presence of short-term flaring activity rather than a change in the covering of the absorber.
Within a project investigating the occurrence of AGN in a sample of interacting galaxies, we came across an interacting system, NGC454, which was recently observed in the X-ray energy band with Suzaku, and 6 months later with XMM-Newton, and whose main X-ray spectral components present interesting variability properties.
Here we compare and discuss the X-ray observations from Suzaku, XMM-Newton and Swift that unveiled that NGC454 can be placed among
those AGN whose absorbing is strongly variable (section 4.2). The paper is structured as
follows. The interacting system NGC454 is described in §2. The X-ray observations and
data reduction are summarized in §3. In §4 we present the spectral
analysis of both datasets and the comparison between the observations, aimed to assess the nature of the
X-ray absorber.
Summary and conclusions follow in §5.
Throughout this paper, a concordance cosmology with H km s-1
Mpc-1, =0.73, and =0.27 (Spergel et al., 2003) is adopted.
2 NGC454
Optical studies (Arp & Madore 1987; Johansson 1988; Stiavelli et al. 1998) of the interacting
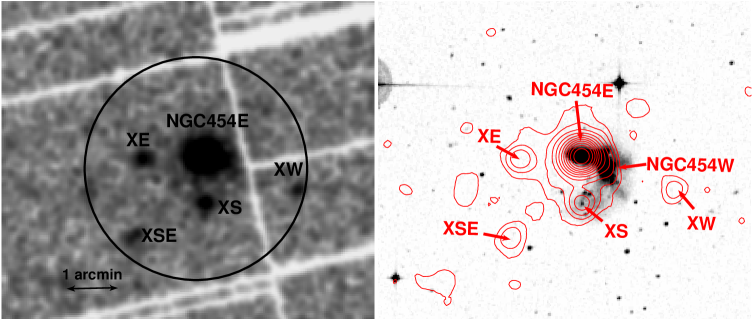
system NGC454 (see Figure 1, right panel) describe it as a pair of emission
line galaxies consisting of a red elliptical galaxy (eastern component,
hereafter NGC454E) and a blue irregular galaxy (western component, hereafter
NGC454W), at redshift z=0.0122. The distorted morphology of both these
galaxies, together with the spectroscopic and photometric evidence of a young
stellar population, is a clear sign of the interacting nature of this system.
Furthermore, three very blue knots (discussed in section 3.3.1),
probably Strongren spheres surrounding clusters of very hot newly formed stars,
are located (and likely related) to the south of NGC454W. HST
observations of the system, performed with the Wide Field Planetary Camera 2,
confirmed that NGC454 is in the early stages of interaction
(Stiavelli et al., 1998).
The above authors stated also that an important fraction of gas has drifted to
the center of the eastern component, but it has yet not produced any significant
visible star formation activity; a population of young star clusters has
formed around the western component.
The optical spectrum of NGC454E is
consistent with that of a Seyfert 2 galaxy (although none of the high
excitation lines, e.g. HeII lines, can be seen) while no optical evidence of an
AGN is present in the spectrum of NGC454W which is fully consistent with that
of a star-forming galaxy (Johansson, 1988).
3 Observations and data Reduction
3.1 Suzaku data
NGC454 was observed on April 29, 2009 by the Japanese X-ray satellite Suzaku (Mitsuda et al., 2007) for a total exposure time of about 130 ksec. Suzaku carries on board four X-ray Imaging Spectrometers (XIS, Koyama et al., 2007), with X-ray CCDs at their focal plane, and a non-imaging hard X-ray detector (HXD-PIN, Takahashi et al., 2007). At the time of this observation only three of the XIS were working: one back-illuminated (BI) CCD (XIS1) and two front-illuminated (FI) CCDs (XIS0 and XIS3). All together the XIS and the HXD-PIN cover the 0.5–10 keV and 12–70 keV bands respectively. The spatial resolution of the XIS is 2 arcmin (HEW), while the field of view (FOV) of the HXD-PIN is 34 arcmin radius. Data from the XIS and HXD-PIN were processed using v2.1.6.14 of the Suzaku pipeline and applying the standard screening parameters111The screening filters all events within the South Atlantic Anomaly (SAA) as well as with an Earth elevation angle (ELV) and Earth day-time elevation angles (DYE_ELV) less than . Furthermore also data within 256s of the SAA were excluded from the XIS and within 500s of the SAA for the HXD. Cut-off rigidity (COR) criteria of for the HXD data and for the XIS were used..
3.1.1 The Suzaku XIS analysis
The XIS data were selected in and editmodes using only good events with grades 0,2,3,4,6 and filtering the hot and flickering pixels with the script sisclean; the net exposure times are 103 ksec for each of the XIS. The XIS source spectra were extracted from a circular region of 2.2′ radius centered on the source, and the background spectra were extracted from two circular regions with the same radius of the source region, offset from the source and the calibration sources. The XIS response (rmfs) and ancillary response (arfs) files were produced, using the latest calibration files available, with the ftools tasks xisrmfgen and xissimarfgen respectively. The spectra from the two FI CDDs (XIS 0 and XIS 3) were combined to create a single source spectrum (hereafter XIS–FI), while the BI (the XIS1) spectrum was kept separate and fitted simultaneously. The net 0.5–10 keV count rates are: cts/s, cts/s, cts/s for the XIS0, XIS3 and XIS1 respectively. We considered data in the range 0.5–10 keV for the XIS–FI and in the range 0.6–7 keV for the XIS–BI (because the XIS–BI is optimized for observing below keV). For both the XIS-FI and XIS-BI we ignored the band 1.6–1.9 keV, due to the presence of instrumental calibration uncertainties. The net XIS source spectra were then binned to a minimum of 50 counts per bin.
3.1.2 The Suzaku HXD-PIN analysis
For the HXD-PIN data reduction and analysis we followed the latest Suzaku data
reduction guide (the ABC guide Version
2222http://heasarc.gsfc.nasa.gov/docs/suzaku/analysis/abc/), and used the
rev2 data, which include all 4 cluster units. The HXD-PIN instrument team
provides the background (known as the “tuned” background) event file, which
accounts for the instrumental “Non X-ray Background” (NXB; Kokubun et al. 2007). The
systematic uncertainty of this “tuned” background model is
1.3% (at the 1 level for a net 20 ksec
exposure333ftp://legacy.gsfc.nasa.gov/suzaku/doc/hxd/suzakumemo-2008-03.pdf).
We extracted the
source and background spectra using the same common good time interval, and
corrected the source spectrum for the detector dead time. The net exposure time
after the screening was 106 ksec. We then simulated a spectrum for the cosmic
X-ray background counts (Boldt, 1987; Gruber et al., 1999) and added it to the instrumental
one.
NGC454 is detected at a level of 3.4 % above the background and the net count rate in the 15–30 keV band is cts/s. For the spectral analysis the source spectrum was rebinned in order to have a signal-to-noise ratio 3 in each energy bin. We fit the Suzaku-HXD spectrum with a single absorbed power-law component with a photon index and derived an observed 15–30 keV flux of 3.4erg cm-2 s-1 .
3.2 The Swift-BAT observation
NGC454 was also detected with the BAT detector on
board of Swift (Gehrels et al. 2004). BAT is a coded aperture imaging camera that operates in the 14–150 keV energy range; it has a large field
of view (1.4 steradian half coded), and a point spread function
(PSF) of 18 arcmin (HEW).
Swift-BAT is devoted mainly to the monitoring of a
large fraction of the sky for the occurrence of gamma ray bursts
(GRBs); while waiting for new GRBs, it continuously collects spectral
and imaging information in survey mode, covering a fraction
between 50 and 80 of the sky every day.
NGC454 (BAT name: SWIFT J0114.4-5522) is part of the Palermo Swift-BAT
54-Month hard X-ray catalogue (Cusumano et al. 2010) and the Swift-BAT
58-Month Hard X-ray Survey (heasarc.gsfc.nasa.gov/docs/swift/results/bs58mon/).
This last survey
detected 1092 sources in the 14–195 keV band down to a significance level of
4.8, reaching a flux level of erg cm-2 s-1 over 50% of the sky (and erg cm-2 s-1 over 90% of the sky); as part of this new edition of the Swift-BAT
catalogue, 8-channel spectra and monthly-sampled light curves for each object detected in the survey were made available
(Baumgartner et al. 2011).
The 14–195 keV observed flux of NGC454 is 1.90erg cm-2 s-1 , in agreement, when accounting for the different bands, with the flux quoted in the
Cusumano et al. 2010 catalogue (erg cm-2 s-1 ). This flux is also in good agreement
with the expected 14–195 keV flux (erg cm-2 s-1 ) extrapolated from that measured
with Suzaku in the 15–30 keV range .
3.3 The XMM-Newton observation
NGC454 was observed with XMM-Newton on November 5, 2009 for a total exposure time of about 30 ksec. The XMM-Newton Observatory (Jansen et al. 2001) carries, among its onboard instruments, three 1500 cm2 X-ray telescopes, each with EPIC (European Photon Imaging Camera) imaging spectrometers at the focus. Two of the EPIC use MOS CCDs (Turner et al. 2001) and one uses a pn CCD (Strüder et al. 2001). These CCDs allow observations in the range 0.5–10 keV. The spatial resolution of the 2 MOSs is (HEW), and (HEW) for the pn (Ehle et al. 2001).
During this observation the pn, MOS1, and MOS2 cameras had the medium filter applied and they were operating in full frame Window mode. The data have been processed and cleaned using the Science Analysis Software (SAS ver. 6.5) and analysed using standard software packages (FTOOLS ver. 6.1 and XSPEC ver. 11.3). Event files have been filtered for high-background time intervals, and only events corresponding to patterns 0–12 (MOS1, MOS2) and to patterns 0–4 (pn) have been used. The net exposure times at the source position after data cleaning are 23.9 ksec (pn), 29.1 ksec (MOS1) and 29.2 ksec (MOS2).
In the right panel of Figure 1 we report the optical DSS image of the system NGC454, together with the XMM-Newton 0.5–10 keV contours (green, in the electronic version only) from EPIC-pn. It is evident that the bulk of the X-ray emission is positionally coincident with NGC454E (the galaxy spectroscopically classified as a Seyfert 2) while no strong X-ray emission is detected at the position of NGC454W (the source spectroscopically classified as a star-forming galaxy). We also detected a weak X-ray source to the south of NGC454, which is positionally coincident with one of the three very blue knots discussed above, likely a star forming region belonging to NGC454W.
The pn, MOS1 and MOS2 source spectra were extracted from a circular region of 0.46 arcmin radius centered on the source (NGC454E), while the background spectra were extracted from two circular regions with 0.5 arcmin radius offset from the source. The MOS1 and MOS2 spectra were combined, then both the EPIC-pn and EPIC-MOS spectra were grouped with a minimum of 30 counts per channel.
3.3.1 Contamination from unresolved sources in the Suzaku (XIS, HXD) and Swift-BAT extraction region/field of view
In the left panel of Figure 1 we show the XMM-Newton 0.5–10 keV pn
image along with the Suzaku extraction region (circle with 2.2′ radius).
As discussed above the main X-ray source is centered on NGC454E but given the
XMM-Newton better angular resolution (14′′–15′′ HEW) as compared to Suzaku ( HEW), we can clearly distinguish 4 other X-ray sources, besides NGC454E,
entering in the Suzaku XIS extraction region. We extracted the XMM-Newton spectra
for the 3 brighter sources (XS, XE and XSE, marked in Figure 1 for clarity) and
analysed them in order to estimate their possible contribution to the Suzaku spectrum; the remaining source (XW) has only counts detected in the keV
band (see below).
XS is well fitted with a power law, modified only by Galactic absorption, with a
photon index and a 2–10 keV flux
Ferg cm-2 s-1 ; the
extrapolated flux in the 14–70 keV band (assuming ) is
Ferg cm-2 s-1 . As said
above this source is likely associated with a star forming region related to
NGC454W; if so, assuming , its 2–10 keV luminosity is erg s-1. We cannot establish if this luminosity is due to one or more sources and thus speculate on its/their nature, because we lack both the spatial resolution and a good enough sampling to assess its variability and spectral properties.
The source to the east of NGC454E (hereafter XE) can be fitted with a power-law and a thermal component, yielding
1.6, and erg cm-2 s-1 (Ferg cm-2 s-1 ). The source to the south-east of NGC454E (hereafter XSE) can be
fitted with an absorbed power law ( cm-2) with photon index set to 1.8 and
Ferg cm-2 s-1 (Ferg cm-2 s-1 ).
Finally, the fourth source located to the west of
NGC454E (hereafter XW) has not enough counts for a meaningful spectral analysis ( counts) and its estimated
fluxes are F2.0erg cm-2 s-1 and
Ferg cm-2 s-1 (adopting ). According to the extragalactic logN-logS distributions computed by Mateos et al. (2008), at this flux level the number of random 2–10 keV sources in the Suzaku extraction region is , thus the sources XE, XSE and XW
are probably those expected by ”chance”. There is no NED identification available for XE, XSE and XW.
The combined 2–10 keV flux of all these 4 possible contaminating sources (Ferg cm-2 s-1 ) imply that they will provide a negligible contribution to the Suzaku XIS spectrum of NGC454 (Ferg cm-2 s-1 ). More important their estimated F[14-70]keV are well below the Suzaku HXD-PIN or Swift-BAT sensitivity. On the other hand this check is still not sufficient for these two latter instruments since their FOV is larger than that of the Suzaku XIS instrument. Assuming that the X-ray emission above 10 keV detected with the HXD-PIN or the Swift-BAT is associated to the same source, as the good agreement of the measured fluxes strongly suggests, we can use the instrument with the smaller FOV (Swift-BAT) to perform further checks. In particular using known catalogues or archives (NED444http://ned.ipac.caltech.edu/ and SIMBAD555http://simbad.u-strasbg.fr/simbad/) we searched for bright X-ray/optical sources within 6 arcmin radius error circle (corresponding to 99.7% confidence level for a source detection at 4.8 standard deviations, Cusumano et al. 2010) that could be responsible of the observed X-ray emission above 10 keV. No plausible contaminant source was found and, in the following, we will assume that the emission above 10 keV comes from NGC454E. We note that we are also assuming a negligible contribution to the emission above 10 keV from the companion galaxy in the interacting system, NGC454W. While a confirmation of this assumption has to wait for direct imaging observations above 10 keV with adequate spatial resolution, we stress that no emission was detected below 10 keV from NGC454W, while a contribution would be expected even in the case of a deeply buried AGN (see e.g. Della Ceca et al. 2002). We thus conclude that we do not expect significant contaminations from the nearby sources to the Suzaku and Swift spectra.
4 Spectral analysis
4.1 The Suzaku and Swift broad band X-ray emission
We first considered the X-ray spectrum of NGC454E in the 0.5–100 keV band by
fitting simultaneously the Suzaku XIS, Suzaku HXD and Swift-BAT data. The
cross-normalisation factor between the HXD and the XIS-FI was set to 1.18, as
recommended for HXD nominal observation processed after 2008 July (Manabu et al.
2007; Maeda et al.
2008666http://www.astro.isas.jaxa.jp/suzaku/doc/suzakumemo/suzakumemo-2007-11.pdf;
http://www.astro.isas.jaxa.jp/suzaku/doc/suzakumemo/suzakumemo-2008-06.pdf),
while the cross-normalisation between Swift and XIS was allowed to vary.
In
the subsequent sections the statistics was used for the fit, the
errors are quoted to 90% confidence level for 1 parameter of interest and
all the spectral parameters are quoted in the rest frame of the source.
We fitted the continuum with a redshifted unabsorbed power-law model,
modified only by Galactic ( cm-2,
Dickey & Lockman, 1990) absorption. This model did not provide an adequate
description of the broadband spectrum of NGC454E (/dof=522.6/122). If we
fit only the 2–5 keV continuum, excluding possible complexity in the soft
energy range and near the Fe K emission line complex we found a
very flat photon index (), strongly suggesting that we are
dealing with an absorbed AGN, in agreement with the optical
spectral classification of NGC454E.
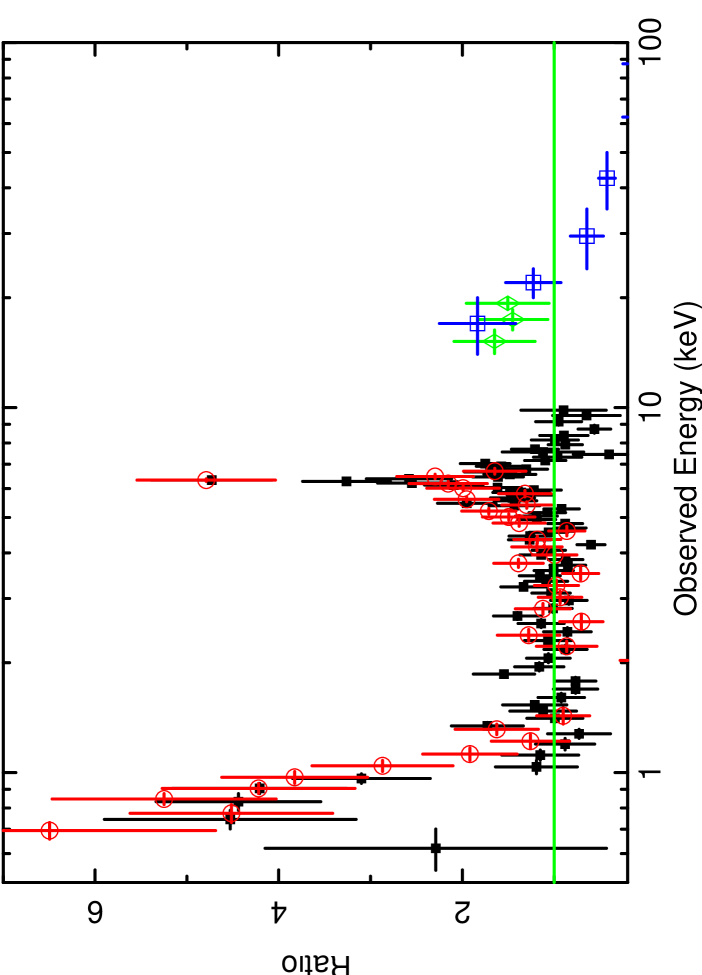
The residuals with respect to
this simple unabsorbed power-law model, which are shown in Figure
2, allowed us to infer the main
features of the observed spectrum. An excess at energies below 1 keV, an emission
line feature at 6.4 keV (likely associated with Fe K),
together with a line-like feature at 7 keV, and an excess at energies
between 10 and 20 keV are clearly evident. The residuals in the soft X-rays
suggest the presence of a thermal component probably related to the host galaxy. The
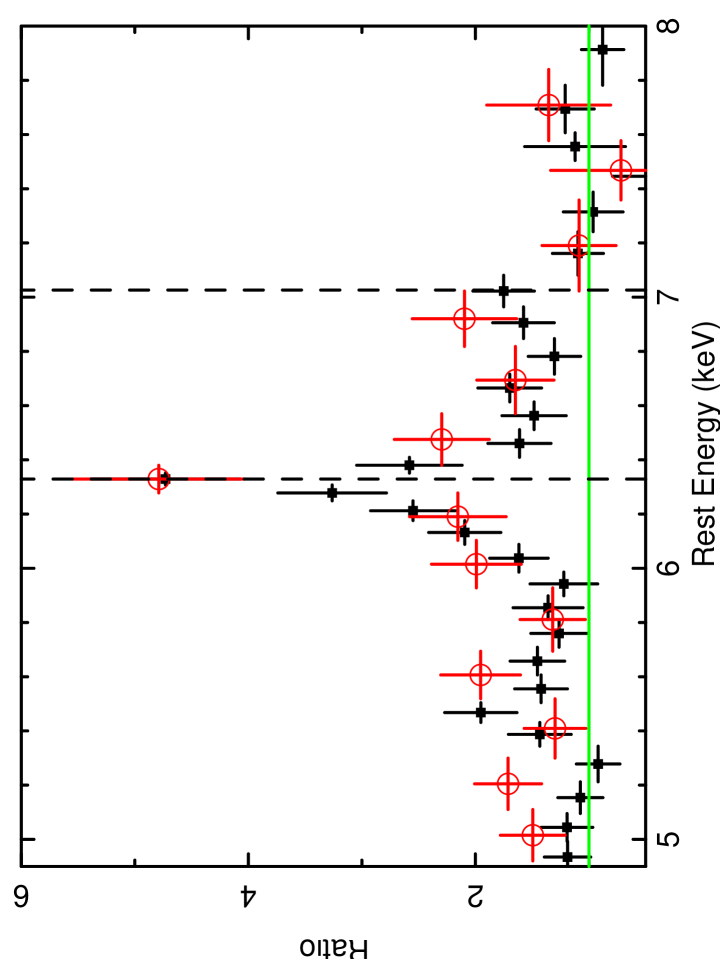
simultaneous occurrence of a strong Fe K emission line at 6.4 keV
(figure 2 upper and lower panel), a very flat observed and
an excess in the hard X-rays (above 10 keV) is the distinctive spectral signature
of a highly absorbed source, with a possible strong Compton
reflected component. The excess observed at 7 keV (Figure
2 lower panel) is likely due to the combination of the Fe K
emission line (7.06 keV) and the Fe XXVI (6.97 keV) and the Fe edge (7.11 keV).
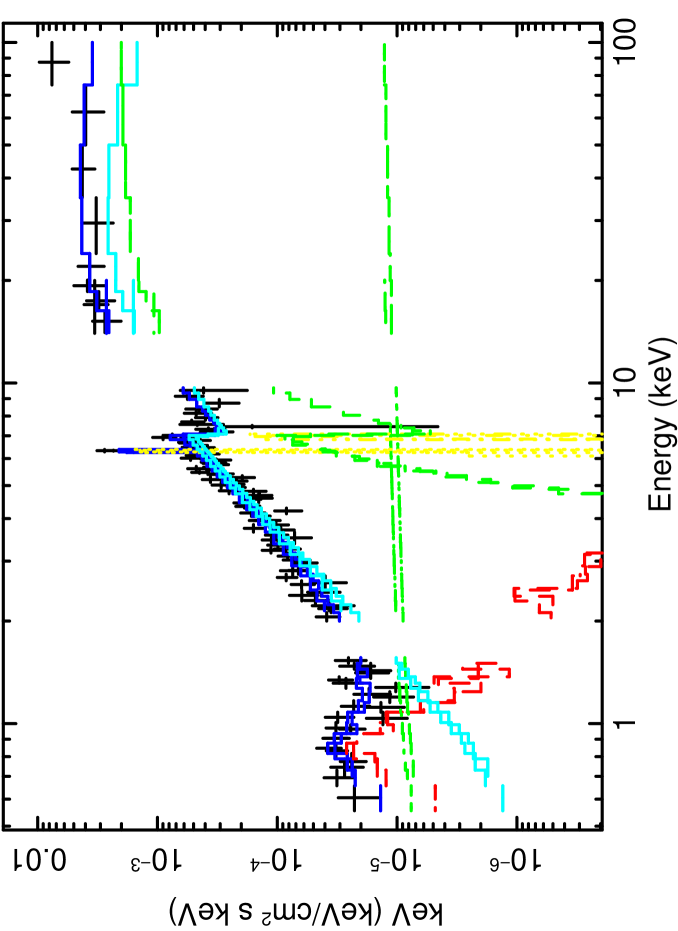
Given these features, we performed a broadband fit including:
-
1.
a thermal component (modelled with the mekal model, Mewe et al., 1986);
-
2.
an absorbed primary power-law component;
-
3.
an unabsorbed power-law component with the same photon index ;
-
4.
two Gaussian emission lines at 6.4 keV (Fe K) and 7.06 keV (Fe K) respectively. We kept the energy of the Fe K fixed to 7.06 keV, tied its intrinsic width () to the width of the corresponding Fe K line and fixed its flux to be 13% of the Fe K flux, consistent with the theoretical value (Kaastra & Mewe, 1993);
-
5.
a Compton reflected component, modelled with the pexrav model in xspec (Magdziarz & Zdziarski, 1995). The parameters of the reflected component are: an inclination angle i fixed to 63∘, abundance Z=Z⊙, a reflection fraction (defined by the subtending solid angle of the reflector ) fixed to be -1 (i.e. pure reflection)777Since in the “pure reflection” PEXRAV model there is a degeneracy between R and the normalisation, we set the reflection scaling factor to -1 and allowed the normalisation to vary., the cut-off energy (fixed at 200 keV, Dadina 2008) and the normalisation.
The absorber was modelled by a combination of the cabs and zphabs models in XSPEC, assuming the same column density, since they represent the same medium producing two different effects (i.e. the non-relativistic Compton scattering and photoelectric absorption of the primary radiation, respectively).
The model setup is:
wabs[ mekal + zpowerlw + zgauss + zgauss + pexrav + cabszphabs( zpowerlw)]
We found that this model provides a good representation of the X-ray emission of NGC454E (/dof=104.5/103). The resulting best-fit parameters are reported in table 1. In particular, this best-fit model yielded , cm-2. The rest-frame energy of the Fe K is keV and its equivalent width with respect to the observed continuum is EW=340eV. At the Suzaku spectral resolution this emission line is unresolved; leaving the width free to vary we found 70 eV (at the 90% confidence level), thus we fixed it to be eV. The cross-normalisation factor between the Swift-BAT and the XIS-FI is 1.05. We stress that a different choice of the cut-off energy in the range between 100 and 300 keV does not affect significantly the best-fit reflection parameters obtained in this work. f The relative importance of the reflection component is given by the ratio between the normalizations of the primary absorbed power-law and the reflection component; in our case this ratio is 0.5, which at first order would correspond to a reprocessor covering a solid angle 2. The fraction of scattered radiation is . The observed 2–10 keV flux is erg cm-2 s-1 while the intrinsic 2–10 keV luminosity obtained with this model is 7.2erg s-1.
| Model Component | Parameter | Suzaku | XMM-Newton |
|---|---|---|---|
| Power law | |||
| Normalisationa | |||
| Scattered Component | Normalisationa | ||
| Absorber | NH | cm-2 | cm-2 |
| Thermal emission | kT | keV | keV |
| Normalisationc | |||
| Neutral reflection | Normalisationa | ||
| Fe K | Energy | keV | keV |
| EW | 340 eV | eV | |
| Normalisatione | 3.62 | 4.75 | |
| Ionised Absorber | NH | .. | cm-2 |
| log | .. | ||
| .. | 300 km | ||
| /dof | 104.5/103 | 190.7/197 | |
| F (0.5-2)keV | erg cm-2 s-1 | erg cm-2 s-1 | |
| F(2-10)keV | erg cm-2 s-1 | erg cm-2 s-1 | |
| F (14-150)keV | erg cm-2 s-1 | erg cm-2 s-1 | |
| L (0.5-2)keV | erg s-1 | erg s-1 | |
| L(2-10)keV | erg s-1 | erg s-1 | |
| L(14-150)keV | erg s-1 | erg s-1 |
a units of photons keV-1 cm-2 s-1.
b Due to a degeneracy between the normalisations of the primary power law and pexrav, the errors were computed fixing the reflection normalisation to its best-fit value.
c The normalisation of the thermal component is defined as where is the angular diameter distance, z is the redshift,
and are the electron and hydrogen density (cm-3) respectively, and dV is the volume from which the deprojected emission originates.
d The line is unresolved; the intrinsic width has been fixed to be 10 eV.
e units of photons cm-2 s-1.
4.2 Comparison with XMM-Newton data
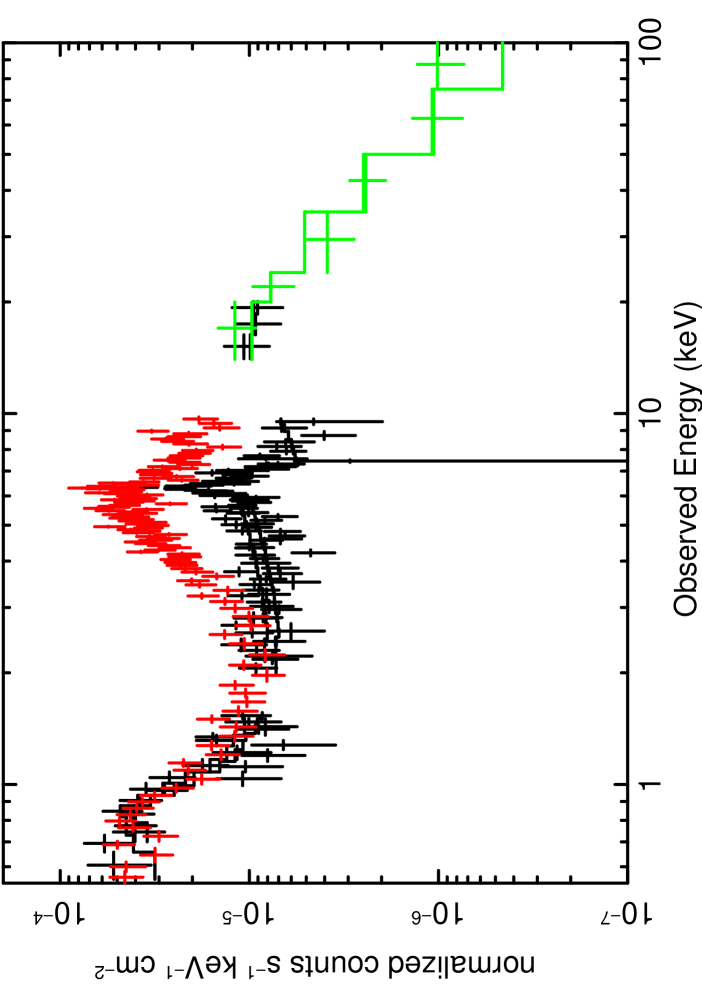
In Figure 4 we report the Suzaku XIS (black, lower spectrum), HXD (black) and Swift-BAT
spectra (green, in the electronic version only). In red (upper spectrum) we also show the XMM-Newton pn and MOS
data, revealing a dramatic change in the spectral curvature between 3 and
6 keV. This variation is most likely due to a
change in the amount of absorption of the primary radiation. To test this hypothesis we applied the Suzaku best-fit model to the XMM-Newton spectra, leaving only the absorbing column density () free to vary.
We also left both the cross-normalisation factors between the pn and
the MOS spectra and between Swift-BAT and pn data free to vary; they were found to be 1.02 and
1.06 respectively.
During the XMM-Newton observation the decreased by about one order of
magnitude (from cm-2 to cm-2);
this change in the amount of absorption is sufficient to explain the bulk of the differences between the observed XMM-Newton and Suzaku spectra.
For completeness, we also allowed to vary the photon index
(), the normalisation of both the power law components, the thermal
component and the K energy and normalisation. The fit yielded
/dof=213.9/199 and the only parameter changing well beyond the Suzaku errors is, as expected, the , decreasing to cm-2.
This confirms that the strong variation between XMM-Newton and Suzaku is due to a change in column density of 1.8 cm-2.
Prompted from this result we also inspected the 3 Swift-X-ray Telescope (XRT) observations taken in 2006 with a time lag of the order of 1–2 days from each other, and we found that the source was in a state similar to that observed by XMM-Newton. The exposure time of each of the observations is less than 10 ksec (8713, 8661 and 3667 sec respectively), thus the relatively low statistics does not allow us to establish if there is a variability between the single observations.
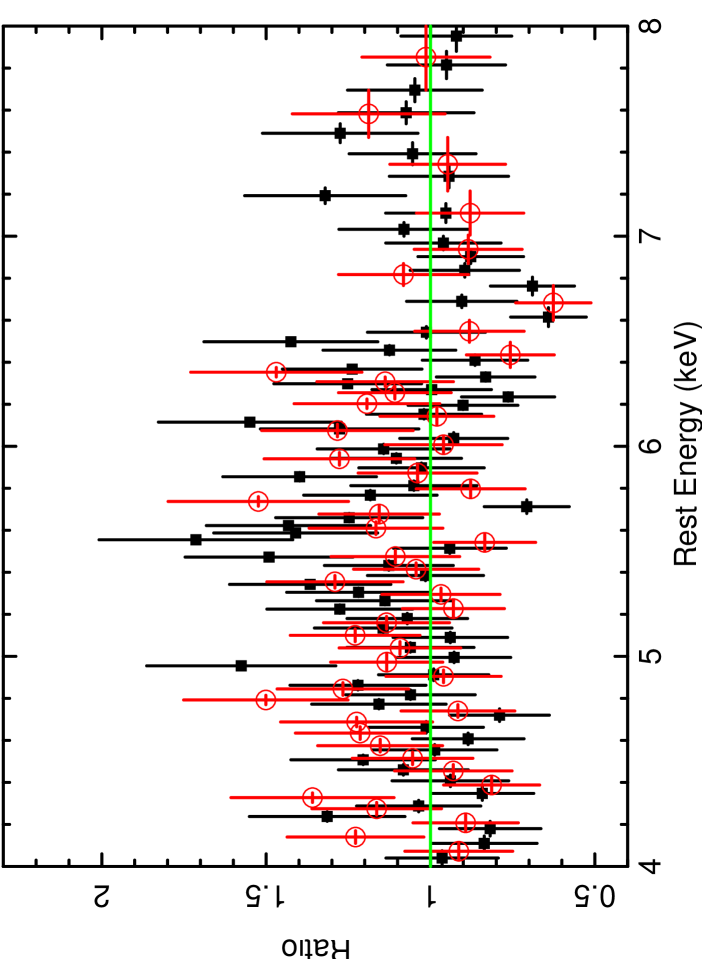
A closer inspection of the residuals in the 5–8 keV energy range to this best-fit model showed some residual
curvature between 5 and 6 keV, together with a possible absorption feature centered at 6.7 keV
(see Figure 5), which is present in both the pn and MOS spectra and
is suggestive of a more complex and likely ionized absorber.
After checking the significance of this absorption line, we included in the model an
additional ionized absorber (see §4.2.1). We note that, after accounting for the
absorption feature at 6.7 keV, the excess of curvature in the range 5–6 keV
is not present anymore.
The parameters of the XMM-Newton best-fit model are reported in table
1 and the final model setup is described in section
4.2.1. We note that the difference in the best-fit normalisations
of the thermal and scattering component between Suzaku and XMM-Newton are likely due to
a degeneracy between these two parameters. Indeed the 0.5–2 keV flux did not
strongly vary between the two observations.
The fraction of scattered radiation is . The
2–10 keV flux is erg cm-2 s-1 , while the 2–10 keV
luminosity, , is erg s-1, about a
factor 2.8 below the luminosity computed using only the Suzaku data. Although such a variation of the intrinsic luminosity is not unusual in AGN, part of this difference could be due to the geometry assumed by the models adopted for the high column density absorber.
Indeed we will show in section 4.3 that this difference
is smaller (a factor 1.7) when we adopt the Mytorus code for the absorber.
4.2.1 The keV absorption feature in the XMM-Newton observation
As a first step to model the absorption feature in the 6–7 keV band we added a Gaussian absorbing component; setting keV we
found that the centroid of the line is at E= keV, the normalisation is
and =24 for 2 dof. The absorption lines appears to be
marginally resolved; however leaving its width free to vary we can set only an upper limit keV,
while the energy centroid is found to be consistent within the errors
E=keV. The energy of this absorption line suggests an
association with absorption from highly ionized Fe (i.e. Fe xxv at E6.7
keV) and thus a clear signature of the presence of an ionized absorber. The presence
of an ionized absorber is not exceptional since recent sensitive
observations with Chandra, XMM-Newton, and Suzaku unveiled the presence of red- and blue-shifted
photoionized absorption lines both in type 1 and type 2 AGN as well as in Radio Quiet and Radio Loud AGN
(Tombesi et al., 2010b, 2011).
Thus, it appears that
there is a substantial amount of ionized gas in the nuclei of AGNs, which may be
linked to gas outflowing on parsec scales with velocities from hundreds of km/s
up to (Tombesi et al. 2010b). We note that
red- and blue-shifted absorption lines are predicted in several
theoretical models of failed disk winds (Proga & Kallman, 2004; Sim et al., 2010) or of aborted jet
(Ghisellini et al., 2004). However, before proceeding with any further modeling of the absorption feature we
checked its significance.
To assess the significance of the absorption feature we performed extensive Montecarlo simulations as detailed
below. We assumed as our null hypothesis model the best-fit model discussed at the end of section 4.2,
and we simulated S=3000 spectra (with the fakeit command in XSPEC), with the same exposure
time as the real data. Each one of these simulated spectra was then fitted with the null hypothesis model to
obtain a value, and we systematically searched for an absorption line in the
2–10 keV energy range, stepping the energy centroid of the Gaussian in increments of 0.1
keV and refitting at each step. We then obtained for each simulated spectrum a minimum and created a
distribution 3000 simulated values of the (compared to the null hypothesis model). This
indicates the fraction of random generated absorption features in the 2–10 keV band that are
expected to have a greater than a threshold value. If N of these simulated values are greater
than the real value, then the estimated detection confidence level is 1-N/S. Using this analysis we can then
conclude that the line detection is significant at 99.97 level.
In order to obtain a physical description of the absorber we replaced the Gaussian absorption line with a model representing a photoionized absorber, which has been produced using a multiplicative grid of absorption model generated with the xstarv 2.1 code (Kallman & Bautista, 2004). This grid describes an ionized absorber parametrised by its column density (), and its ionisation parameter, defined as:
| (1) |
where is the ionising luminosity between 1–1000 Rydbergs (13.6
eV to 13.6 keV), n is the hydrogen gas density in cm-3 and is the radial distance of the absorber
from the ionising source. Since there is no apparent broadening of the absorption line we assumed a
turbulence velocity of .
The inclusion
of this ionized absorber significantly improved the fit (/dof=190.7/197,
for 2 dof), with a column density of cm-2and an ionisation of log(. The improvement in the is determined solely by fitting the absorption feature in the 6–7 keV band, since an ionised absorber with such a high level of ionization does not produce any feature in the soft band of the continuum.
The parameters of the XMM-Newton best-fit model are reported in table 1 and the setup is the following:
wabs[ mekal + zpowerlw + zgauss + zgauss + pexrav + XSTAR *cabs *zphabs (zpowerlw)]
We can now estimate what is the maximum distance of this ionised absorber from the central black hole, using equation 1, relating the ionisation parameter, the density of the absorber and the continuum luminosity . In this case (in the energy range between 13.6 eV and 13.6 keV) is erg s-1. Assuming that the thickness of the absorber R= is smaller than the distance Rion (R/Rion 1), we can set an upper limit to the distance:
| (2) |
This maximum distance of pc is consistent with a location of the
ionised absorber within the Broad Line Region of the AGN. Indeed an estimate of the BLR size RBLR for NGC454E can be inferred by using the relation between RBLR and the monochromatic luminosity at 5100 Å, (Kaspi et al. 2005, ). Since the luminosity of the optical continuum cannot be measured directly from the spectrum, because of the strong absorption, we estimate from the intensity of the [OIII]5007Å line flux, assuming a mean F[OIII]5007Å/F(5100Å) ratio.
This ratio has been inferred from the AGN template presented in Francis et al. (1991) (). Using the [OIII]5007Å flux published in Johansson (1988) we obtain and, thus, an approximate size of the BLR of 0.05 pc, i.e. about 50 times .
Since we do not observe this absorption feature in the Suzaku spectrum we added to the Suzaku best-fit model a gaussian absorption line with the same parameters obtained with the XMM-Newton data. The lower limit for the detection of an absorption line with central energy of 6.75 keV and width of 0.05 keV, is -1.18 for Suzaku data. Thus, being the normalisation of this line -3.75 in the XMM-Newton spectrum, we can infer that the ionised absorber should be detectable by Suzaku. The simplest interpretation is that also the ionized absorber is variable; which is not surprising since there are several reported cases of variable absorption feautures (Tombesi et al., 2010b, 2011) (Braito et al. 2007; Cappi et al. 2009; Dadina et al. 2005; Risaliti et al. 2005). Moreover instability of the outflowing ionized absorbers is predicted both in disk winds models (Proga & Kallman 2004; Sim et al. 2010) or of aborted jet (Ghisellini et al., 2004). This will cause the presence of transient absorption features and variability of the derived outflowing velocities and their EW as observed in several sources (see e.g. Tombesi et al. 2010b)
4.3 A physical interpretation with Mytorus model
The models discussed so far, which are based on spectral components largely used from the astronomical community, do not treat both fluorescent lines and continuum components self-consistently. Furthermore all these spectral components may be deficient in one or more aspect of modelling the complex transmission and reflected spectrum of AGN over a broad energy range and for a large range of absorbing column densities (see section 2 of Murphy and Yaqoob, 2009 for a critical discussion of these points).
In order to alleviate these problems and, thus, to further assess the possible
geometry
and/or nature of the variable absorber, we tested the most recent model for the
toroidal
reprocessor 888http://www.mytorus.com/ (Murphy & Yaqoob, 2009).
This model, recently included in the XSPEC software package, is valid for column
densities
in the range to cm-2 and for energies up to 500 keV (the relativistic
effects
being taken into account); more importantly the reprocessed continuum and fluorescent
line emission
are treated self-consistently for the first time. This model assumes that the absorber geometry is toroidal with an opening angle of 60∘.
Since we are clearly seeing a variation of the absorbing column density along the
line of sight
we have used a spectral configuration of MyTorus that can mimic a clumpy absorber
and which also takes into account the fact that the Fe K is rather
constant (see table 1).
We have done this by decoupling the line-of-sight continuum passing through the reprocessor (or zeroth order continuum, see http://www.mytorus.com/manual/index.html) and the reflected (or scattered continuum, see mytorus model) continuum from reprocessor. In practice we allowed the column densities of the line-of-sight continuum and scattered-reflected continua to be independent of each other. The reflected continuum, and the fluorescent line emission which is consistently produced in the same location, is not extinguished by another column of intervening matter. Since the XMM-Newton spectrum unveiled the presence of an additional ionized absorber, which affects the line-of-sight continuum we also included an ionized absorber, which is modelled adopting the same XSTAR grid as described in section 4.2.1. In order to do that, we disentangled the absorbing column density of the line-of-sight (los) component from that for the scattered continuum plus fluorescent emission lines. The inclination angle of the los component has been fixed at 90 degrees; the inclination angle for the reflected/ scattered continuum plus line component component was, for simplicity, fixed at 0 degrees since the effect of the inclination angle on the shape of the scattered continuum is not sufficiently large when the scattered continuum is observed in reflection only. Physically, the situation we are modelling by means of this decoupling could correspond to a patchy reprocessor in which the scattered continuum is observed from reflection in matter on the far-side of the X-ray source, without intercepting any other “clouds,” , while the intrinsic continuum is filtered by clouds ”passing” through our line-of-sight to the central engine.
We applied this model to the the XMM-EPIC and Swift-BAT spectra and we found a god fit with the same absorbing column density (cm-2; dof=) filtering the line-of-sight intrinsic continuum and producing the scattered component (including the production of the fluorescent emission lines). The parameters of the ionized absorber are: cm-2and logerg cm s-1; these values are in good agreement with those found with the best-fit model described in table 1. The photon index of the primary power-law component is now and the intrinsic emitted luminosity is Lerg s-1. Using the Suzaku and Swift data, we found that a good fit can be obtained with an absorber producing the reflected components having an statistically consistent with that obtained using the XMM-Newton data (thus suggesting that this component is likely associated with the distant reflector or torus), while our line of sight to the central engine intercepts a column density cm-2.
In summary this analysis, which is based on a model which takes into account consistently the physical process in place within the X-ray absorber, shows that the change of state of NGC454E can be understood simply by a chance change in the line-of-sight obscuration ( cm-2) while the global obscurer remains unchanged. The intrinsic luminosity derived from the Suzaku data is L erg s-1. We note that using Mytorus the derived change of the intrinsic luminosity between the two data sets are in better agreement (a factor 1.7) with respect to those found in section 4.2. However, with the present statistic and the complexity of the observed spectra, we cannot rule out or confirm a possible variation in luminosity of about a factor 2, frequently observed in AGN; indeed by comparing the 54-months and 9-months BAT high energy (14–195 keV) spectra of this source, we found that the intensity is higher in the 9-months spectrum. However, fitting the spectra with a single absorbed power-law component, we found that a constant flux is also well within the errors on the best-fit normalizations of this primary power-law.
5 Summary and Conclusion
We have presented the results of Suzaku, XMM-Newton and Swift observations of the interacting system NGC454
(z=0.0122). The
bulk of the measured 2–10 keV emission comes from the active galaxy NGC454E (L
erg s-1); no emission from the center of the companion
galaxy (NGC454W) in the
interacting system is detected. The nuclear X-ray emission of NGC454E is filtered by an absorbing column density typical
of a Seyfert 2 galaxy, in agreement with the optical classification.
A comparison between Suzaku and XMM-Newton observations (taken 6 months later)
revealed a significant change in the
spectra of NGC454E in the energy range between 3 and 6 keV. This
variation can be well explained by a variability of
about an order of magnitude in the absorbing column density along the line of sight:
from cm-2(Suzaku) to cm-2(XMM-Newton). This study also adopted the most recent model for the toroidal reprocessor (Murphy & Yaqoob 2009), which takes into account consistently the physical processes in place within the X-ray absorber. Furthermore, regarding the XMM-Newton spectrum, we detected a statistically
significant absorption feature a 6.7 keV, a clear signature of the presence
of a ionised absorber, with
ionisation parameter log( and column density cm-2. The absence
of this feature in the Suzaku spectrum, despite its detectability, implies that it
has varied between the two observations.
Absorption lines associated with ionized iron have been now
observed in several sources and there is also a clear evidence
that these lines are variable as in the case of NGC454. Furthermore, in some cases
the measured blue-shifts of the energy centroids imply a large velocity of these
absorbers and a likely association with
powerful disk winds (King & Pound 2003), while in other cases
there is no measurable motion as in our case.
In summary, with respect to the absorbing column density
variability, NGC454E is a new member of the class of “changing
look” AGN, i.e. AGN that have been observed in both Compton-thin
(=) and reflection dominated states
(). A possible scenario is that a stable and likely distant absorber responsible
for the iron emission line is present. However, there is also a clear variation
of the of the line of sight absorber, probably indicative
of the clumpy nature of the rather neutral absorber
itself. Unfortunately the comparison between different observations,
typically performed at intervals of months to years
(as those discussed here), provides only upper limits to the
intrinsic time scales of variations and thus on the
possible location of the thicker obscuring material (obscuring
“torus” vs. Broad Line Region clouds). The low exposure of the Swift XRT 2006 observations, when the source was in a state similar to the XMM-Newton one, did not allow us to establish the variability on smaller time scales (i.e. intra-day) of the single observations . An improvement of the
estimates of velocity, distance and size from the central X-ray
source of the obscuring material could be obtained only through
monitoring observational campaigns within a few days or weeks and/or through the
search for variations within single long
observation. For what concerns the ionised absorber, as derived from our first order estimate of its distance from the central black hole (i.e. within pc), the most likely
location for this absorber is much closer in than the stable
and rather neutral one.
Acknowledgements
We warmly thank T. Yaqoob for the useful discussion and for helping us while fitting the Mytorus model to mimic the variable absorber. We thank the anonymous referee for many useful suggestions and comments that significantly improved the paper. This research has made use of data obtained from the Suzaku satellite and data obtained from the High Energy Astrophysics Science Archive Research Center (HEASARC), provided by NASA’s Goddard Space Flight Center. The authors acknowledge financial support from ASI (grant n. I/088/06/0, COFIS contract and grant n. I/009/10/0). VB acknowledge support from the UK STFC research council.
References
- Antonucci (1993) Antonucci, R. 1993, ARA&A, 31, 473
- Arp & Madore (1987) Arp, H. C., & Madore, B. F. 1987, A Catalogue of Southern Peculiar Galaxies and Associations (Cambridge: Cambridge Univ. Press)
- Baumgartner et al. (2011) Baumgartner et al, 2011 ApJS, submitted
- Bianchi et al. (2005) Bianchi, S., Guainazzi, M., Mattm, G., et al. 2005, A&A, 442, 185
- Bianchi et al. (2009) Bianchi, S., Piconcelli, E., Chiaberge, M., Bailòn, E. J., Matt, G., & Fiore, F. 2009, ApJ, 695, 781
- Boldt (1987) Boldt, E. 1987, Phys. Rep., 146, 215
- Braito et al. (2007) Braito, V., Reeves, J. N., Dewangan, G. C., George, I., Griffiths, R. E., Markowitz, A., Nandra, K., Porquet, D., Ptak, A., Turner, T. J., Yaqoob, T., & Weaver, K., 2007, ApJ, 670, 978
- Cappi et al. (2009) Cappi, M., Tombesi, F., Bianchi, S., et al. 2009, A&A, 504, 401
- Cusumano et al. (2010) Cusumano G., La Parola V., Segreto A., Ferrigno C., Maselli A., Sbarufatti B., Romano P., Chincarini G., Giommi P., Masetti N., Moretti A., Parisi P., Tagliaferri G., 2010, A&A, 524, A64
- Dadina et al. (2005) Dadina, M., Cappi, M., Malaguti, G., Ponti, G., & de Rosa, A. 2005, A&A, 442, 461
- Dadina (2008) Dadina, M. 2008, A&A, 485, 417
- Della Ceca et al. (2002) Della Ceca, R., Ballo, L., Tavecchio, F., et al. 2002, ApJ, 581, L9
- den Herder et al. (2001) den Herder, J. W., et al. 2001, A&A, 365, L7
- Dickey & Lockman (1990) Dickey, J. M., & Lockman, F. J. 1990, ARA&A, 28, 215
- Done (2010) Done C., 2010, arXiv, arXiv:1008.2287
- Ehle et al. (2001) Ehle, M., et al. 2001, XMM-Newton Users’ Handbook
- Elvis et al. (2004) Elvis, M., Risaliti, G., Nicastro, F., Miller, J. M., Fiore, F., & Puccetti, S. 2004, ApJ, 615, L25
- Fabian (2010) Fabian, A. C. 2010, IAU
- Francis et al. (1991) Francis P. J., Hewett P. C., Foltz C. B., Chaffee F. H., Weymann R. J., Morris S. L., 1991, ApJ, 373, 465 Symposium, 267, 341
- Gruber et al. (1999) Gruber, D. E., Matteson, J. L., Peterson, L. E., & Jung, G. V. 1999, ApJ, 520, 124
- Gehrels et al. (2004) Gehrels, N., Chincarini, G., Giommi, P., et al. 2004, ApJ, 611, 1005
- Ghisellini et al. (2004) Ghisellini, G., Haardt, F., & Matt, G. 2004, A&A, 413, 535
- Jansen et al. (2001) Jansen, F., et al. 2001, A&A, 365, L1
- Johansson (1988) Johansson, L. 1988, A&A, 191, 29
- Kaastra & Mewe (1993) Kaastra, J. S. & Mewe, R. 1993, A&AS, 97, 443
- Kallman & Bautista (2004) Kallman, T. R., Palmeri, P., Bautista, M. A., Mendoza, C., & Krolik, J. H. 2004,ApJS, 155, 675
- Kaspi et al. (2005) Kaspi, S., Maoz, D., Netzer, H., et al. 2005, ApJ, 629, 61
- King & Pounds (2003) King, A. R., & Pounds, K. A. 2003, MNRAS, 345, 657
- Kokubun et al. (2007) Kokubun, M., et al. 2007, PASJ, 59, 53
- Koyama et al. (2007) Koyama, K., Tsunemi, H., Dotani, T., et al. 2007, PASJ, 59, 23
- Lobban et al. (2011) Lobban, A. P., Reeves, J. N., Miller, L., et al. 2011, MNRAS, 414, 1965
- Magdziarz & Zdziarski (1995) Magdziarz, P., & Zdziarski, A. A. 1995, MNRAS, 273, 837
- Mateos et al. (2008) Mateos S. et al., 2008, A&A, 492, 51
- Mewe et al. (1986) Mewe, R., Gronenschild, E.H.B.M., and van den Oord, G.H.J. 1985,A&AS, 62, 197
- Murphy et al. (2007) Murphy, K. D., Yaqoob, T., & Terashima, Y. 2007, ApJ, 666, 96
- Murphy & Yaqoob (2009) Murphy, K. D., & Yaqoob, T. 2009, MNRAS, 397, 1549
- Mitsuda et al. (2007) Mitsuda, K., et al. 2007, PASJ, 59, 1
- Pounds et al. (2004) Pounds, K. A., Reeves, J. N., Page, K. L., & O’Brien, P. T. 2004, ApJ, 616, 696
- Proga & Kallman (2004) Proga, D., & Kallman, T. R. 2004, ApJ, 616, 688
- Puccetti et al. (2007) Puccetti, S., Fiore, F., Risaliti, G., Capalbi, M., Elvis, M., & Nicastro, F. 2007, MNRAS, 377, 607
- Ross & Fabian (2005) Ross & Fabian (2005), MNRAS, 358, 211
- Risaliti et al. (2002) Risaliti, G., Elvis, M., & Nicastro, F. 2002, ApJ, 571, 234
- Risaliti et al. (2005) Risaliti, G., Elvis, M., Fabbiano, G., Baldi, A., & Zezas, A. 2005, ApJ, 623, L93
- Risaliti et al. (2007) Risaliti, G., Elvis, M., Fabbiano, G., Baldi, A., Zezas, A., & Salvati, M. 2007, ApJ, 659, L111
- Risaliti et al. (2009) Risaliti, G., et al. 2009, ApJ, 696, 160
- Risaliti (2010) Risaliti, G. 2010, in American Institute of Physics Conference Series, Vol. 1248, American Institute of Physics Conference Series, ed. A. Comastri, L. Angelini, & M. Cappi, 351–354
- Risaliti et al. (2010) Risaliti G., Elvis M., Bianchi S., Matt G., 2010, MNRAS, 406, L20
- Shu et al. (2010) Shu, X. W., Yaqoob, T., Murphy, K. D., et al. 2010, ApJ, 713, 1256
- Sim et al. (2010) Sim, S. A., Proga, D., Miller, L., Long, K. S., & Turner, T. J. 2010, MNRAS, 408, 1396
- Spergel et al. (2003) Spergel, D. N., et al. 2003, ApJS, 148, 175
- Stiavelli et al. (1998) Stiavelli, M., Panagia, N., Carollo, M.C., Romaniello, M., Heyer, I., Gonzaga, S. 1998, ApJ 492, L135
- Strüder et al. (2001) Strüder, L., et al. 2001, A&A, 365, L5
- Takahashi et al. (2007) Takahashi, T., et al. 2007, PASJ, 59, 35
- Tombesi et al. (2010b) Tombesi F., Cappi M., Reeves J. N., Palumbo G. G. C., Yaqoob T., Braito V., Dadina M., 2010, A&A, 521, 57
- Turner et al. (2009) Turner, T. J., Miller, L., Kraemer, S. B., Reeves, J. N., & Pounds, K. A. 2009, ApJ, 698, 99
- Tombesi et al. (2011) Tombesi F., Cappi M., Reeves J. N., Palumbo G. G. C., Braito V., Dadina M., 2011, ApJ accepted
- Turner et al. (2001) Turner, M., et al. 2001, A&A, 365, L27
- Turner & Miller (2009) Turner T.J., Miller L., 2009, A&ARv, 17, 47
- Uttley et al. (2004) Uttley, P., Taylor, R. D., McHardy, I. M., et al. 2004, MNRAS, 347, 1345
- Weaver et al. (1996) Weaver, K. A., Nousek, J., Yaqoob, T., et al. 1996, ApJ, 458, 160
- Wilms et al. (2000) Wilms, J., Allen, A., & McCray, R. 2000, ApJ, 542, 914
- Yaqoob (1997) Yaqoob, T. 1997, ApJ, 479, 184