Near-Infrared and X-ray Quasi-Periodic Oscillations in Numerical Models of Sgr A*
Abstract
We report transient quasi-periodic oscillations (QPOs) on minute timescales in relativistic, radiative models of the galactic center source Sgr A*. The QPOs result from nonaxisymmetric structure in the accretion flow excited by MHD turbulence. Near-infrared (NIR) and X-ray power spectra show significant peaks at frequencies comparable to the orbital frequency at the innermost stable circular orbit (ISCO) . The excess power is associated with inward propagating magnetic filaments inside the ISCO. The amplitudes of the QPOs are sensitive to the electron distribution function. We argue that transient QPOs appear at a range of frequencies in the neighborhood of and that the power spectra, averaged over long times, likely show a broad bump near rather than distinct, narrow QPO features.
1 Introduction
High frequency quasi-periodic oscillations (QPOs) in the light curves of accreting black holes (e.g. Morgan et al. (1997); Strohmayer (2001); Gierliński et al. (2008); see Remillard & McClintock (2006) for a review) have attracted attention because they are a potential probe of strong gravitational fields. For example, QPO frequencies may be related to , the orbital frequency at the innermost stable circular orbit (ISCO)—a feature unique to the strong gravitational fields around black holes and possibly neutron stars. Since in general relativity depends only on black hole mass and spin , the QPO frequency, together with a mass estimate, could be used to infer . But this cannot be done with confidence absent a convincing QPO model.
It is difficult to discriminate between the many phenomenological and physical models of QPOs (e.g. Remillard & McClintock, 2006) using observations alone. Numerical experiments offer a potential route to testing QPO models (e.g. Kato, 2004; Schnittman et al., 2006; Chan et al., 2009; Henisey et al., 2009), but no numerical models have yet produced robust high frequency QPOs. Reynolds & Miller (2009), for example, find no QPOs at all, while in other cases QPOs observed in dynamical variables (Henisey et al., 2009) are not observed in the emergent radiation calculated from the same simulation (Dexter & Fragile, 2011), and in still other cases QPOs are observed only at certain times and viewing angles (Schnittman et al., 2006).
Still, accretion disks are complicated radiative and dynamical systems, and faithfully modeling all the physics relevant to QPOs is a formidable challenge. In low luminosity systems such as Sgr A*, however, the radiative and dynamical problems are decoupled and one might hope to build more nearly ab initio models (e.g. Mościbrodzka et al., 2009; Dexter et al., 2009, 2010; Mościbrodzka et al., 2011; Dolence et al., 2011b). Searches for QPOs in the near-infrared (NIR) and X-ray light curves of Sgr A* itself have resulted in reported detections (Genzel et al., 2003; Aschenbach et al., 2004; Bélanger et al., 2006; Eckart et al., 2006; Meyer et al., 2006a, b; Trippe et al., 2007), but these may not be statistically significant (Do et al., 2009; Meyer et al., 2008). The observational status of QPOs in Sgr A* is therefore unclear.
In this paper we present radiative models of Sgr A* based on three dimensional GRMHD simulations. We find clear evidence for QPOs in NIR and X-ray light curves and power spectral densities (PSDs) on minute timescales. We tie the QPOs to structure excited by MHD turbulence in the inner accretion flow. We discuss the QPOs’ detectability and argue that their amplitudes are likely to be reduced in Sgr A* relative to our simulations owing to the likely nonthermal origin of the NIR emission. We argue that the QPOs are transient and appear over a range of frequencies near and therefore likely result in a broad bump in PSDs averaged over sufficiently long intervals. Nonetheless, this is the first robust detection of a radiative QPO in a self-consistent dynamical black hole accretion model.
2 Model
We model Sgr A* as a hot, optically thin, geometrically thick accretion flow around a spinning black hole. The disk orbital and black hole spin angular momenta are aligned. We set the dimensionless spin based on axisymmetric models of the quiescent spectrum (Mościbrodzka et al., 2009). Modeling proceeds in two stages: first we evolve the disk using a GRMHD simulation, then we “observe” the disk through relativistic radiative transfer calculations.
The fluid is evolved with the conservative three dimensional GRMHD code harm3d (Noble et al., 2009; Gammie et al., 2003). The computational volume extends from within the horizon to in radius , [,] in colatitude , and [0,) in longitude with, respectively, zones. The zones are regularly spaced in modified Kerr-Schild coordinates which are logarithmic in radius and compressed near the equator to enhance resolution at small radii and within the main body of the disk. The initial conditions consist of a quasi-equilibrium Fishbone-Moncrief torus with pressure maximum near and inner edge at , small perturbations to the internal energy, and a weak purely poloidal magnetic field following isodensity contours. The disk is evolved for . After an initial transient phase, at , the simulation data is recorded every for use in radiative transfer calculations.
The radiation field is evolved with the relativistic Monte Carlo code grmonty (Dolence et al., 2009). grmonty treats synchrotron emission and absorption and Compton scattering. It includes all relativistic effects including finite light travel times through the time dependent GRMHD simulation data. Dimensional quantities are computed from the scale free GRMHD simulation by specifying two numbers: (Ghez et al., 2008; Gillessen et al., 2009b, a), and a disk mass unit (effectively the accretion rate). Following Dolence et al. (2011a), we use a smoothly varying time dependent to remove long term trends in the simulation data caused by draining of the initial disk onto the hole.
The radiation is recorded far from the hole and binned by photon frequency in 38 “cameras” distributed quasi-uniformly over the celestial sphere (see Dolence, 2011, for a detailed discussion of how photons are recorded). The final data set includes broadband spectra from radio to -rays in each camera with an integration time of spanning (see Dolence et al., 2011b, for details). The time-averaged spectra are in general agreement with constraints from sub-mm VLBI, the sub-mm spectral slope, and limits on the quiescent X-ray flux (Mościbrodzka et al., 2009) but underproduce NIR flux by a factor of (see § 4)111See Shiokawa et al. (2011) for a discussion of convergence of our GRMHD and radiative simulations..
3 Power Spectra
The numerical data consists of light curves . QPOs are strongest in the plane of the disk and absent when the disk is face-on222QPOs are detectable simultaneously at all viewing orientations except face-on.. For simplicity, then, we consider only light curves at , , recorded by the equidistant cameras in the equatorial plane. QPOs are detectable at all wavelengths , but we restrict attention to the NIR ( and ) and X-ray (integrated from keV) light curves since these are of greatest interest for Sgr A*.
Following Press et al. (1992), the light curves are divided into equal blocks. We compute power spectral densities (PSDs) for each of the segments composed of consecutive blocks and average these to obtain smoothed PSD estimates. We compute PSDs in both azimuthal wavenumber and in temporal frequency . Before Fourier transforming, the data is mean subtracted and Hamming windowed in time. The discrete Fourier transform is
| (1) |
and the normalized PSD is
| (2) |
where is the window function squared and summed as in Press et al. (1992) and is the mean squared signal. Since is real we need only consider the one-sided PSD defined at . With this choice () components circulate in the () direction. Summing over is equivalent to summing the PSDs from each camera, which is justified by symmetry. Averaging the PSD estimates over segments and cameras improves the signal-to-noise-ratio.
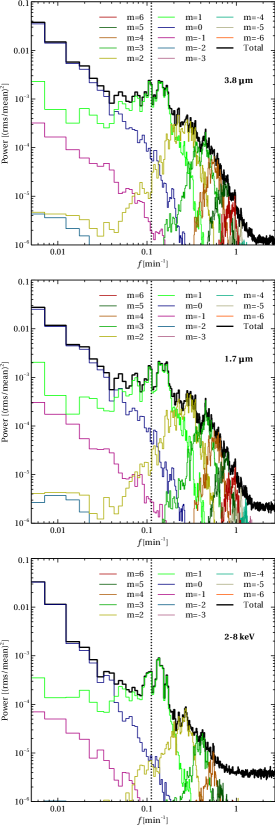
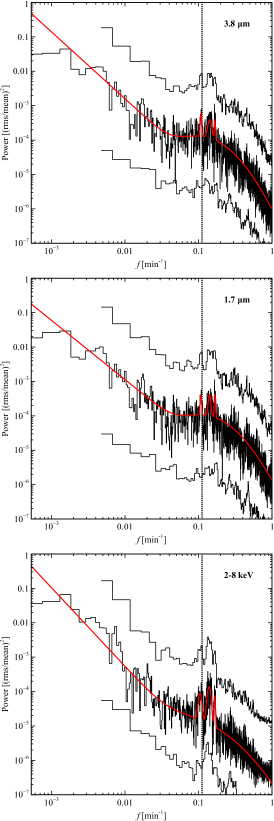
The normalized power spectra are shown in Fig. 1. The total power is shown as a heavy solid line in the , , and keV bands, and the contributions from each are shown as lighter colored lines. The ISCO orbital frequency is shown as a vertical dotted line. The main result of this work is the existence of several peaks superposed on a broad bump in the power spectrum near in all three bands. We identify these peaks as QPOs.
The PSDs show a power law dependence at low frequency, consistent with observations (e.g. Meyer et al., 2008; Do et al., 2009)333Our power spectrum does not sample frequencies low enough to see the PSD break reported by Meyer et al. (2009).. This low frequency component is dominated by fluctuations in the (axisymmetric) component of the flow. Near the ISCO frequency the component dominates the fluctuations and produces a broad, (), bump in the PSDs. Superposed on this broad feature are three peaks with centroids , , and 444, but the significance of this is unclear, which may be compared to . The peaks have . At higher frequency and each contributes a broad peak near . At the highest frequencies the PSDs are dominated by white noise due to Monte Carlo shot noise. The power in components is negligible.
4 Discussion
Where do the QPOs originate? The NIR and X-ray flux is dominated by emission from close to the equatorial plane. The QPO is therefore generated close to the ISCO, at , and not far from the event horizon at . It clearly probes the strong gravitational field regime.
The NIR flux is—in our model—thermal synchrotron emission from electrons in the high energy tail of the distribution function. The NIR emissivity is sensitive to magnetic field strength and temperature, which drop sharply with increasing radius. The mean NIR emission is therefore confined to a ring bounded at large radius by declining emissivity and at small radius by gravitational redshift and photon capture by the black hole555Optically thick disks, by contrast, generate emission in a broad annulus at ; perhaps this explains the lack of high frequency QPOs in the high, soft state in black hole binaries..
The mean X-ray flux is dominated by synchrotron photons from the high energy side of the synchrotron peak that are Compton upscattered once in almost the same ring that generates the NIR emission. This ring is bounded at large radius by a decreasing probability of a large energy amplification scattering due to decreasing temperature () and declining optical depth, and like the NIR emission is bounded at small radius by gravitational redshift and black hole photon capture. Compton scattering occurs over a finite radial range, however, and one would expect that finite light travel time effects would tend to average away fluctuations on timescales less than the light-crossing time. This is consistent with Fig. 1, where the power at drops off more sharply in the X-ray band than in the NIR: Compton scattering low-pass-filters the NIR signal.
The fluctuating component of the NIR and X-ray flux need not arise in the same place as the mean signal. We investigated the origin of the variable component by masking out emission from and recomputing segments of the light curve with a strong QPO signal. In these segments the QPO disappeared, confirming the importance of sub-ISCO emission in generating the QPO.
4.1 Camera footprint
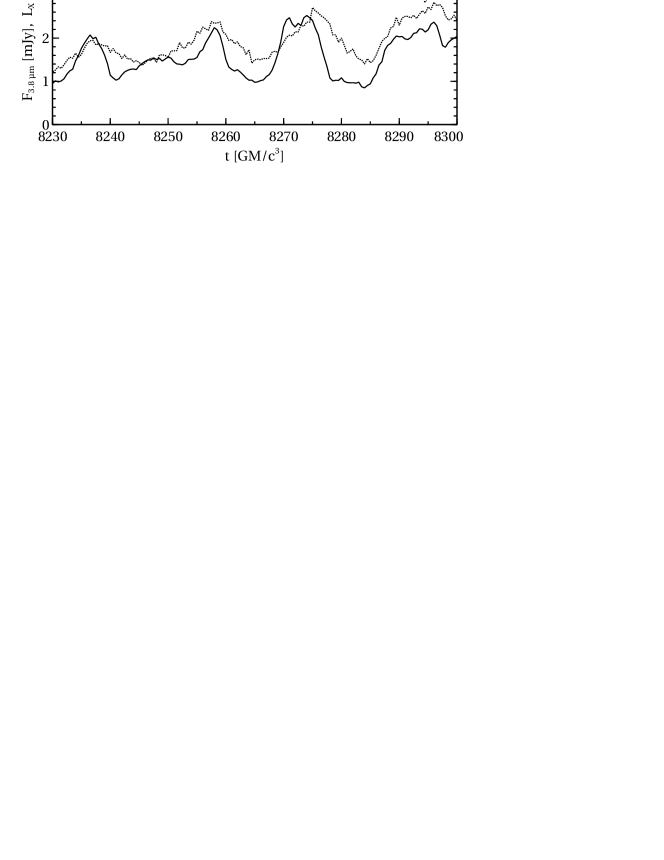
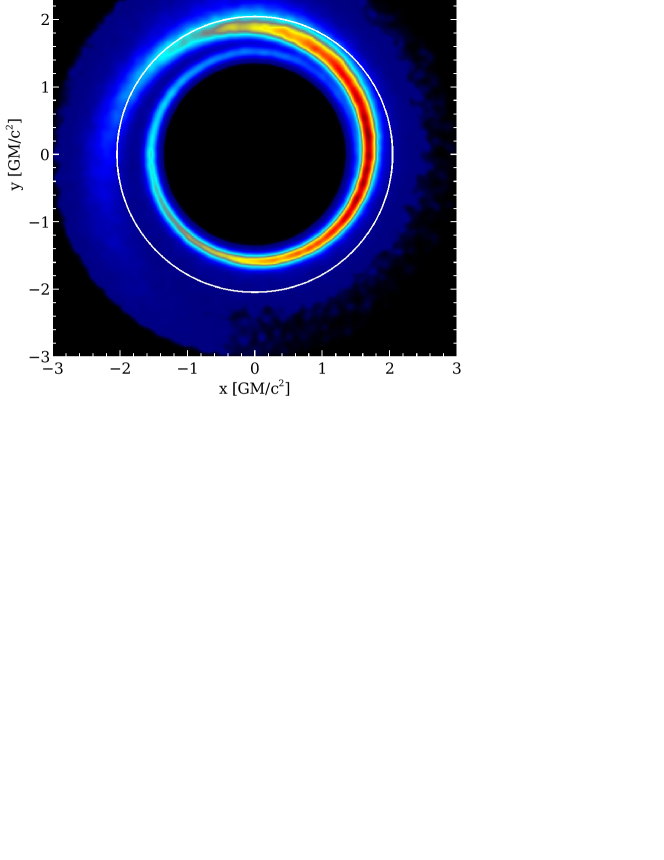
Because NIR and X-ray photons are generated so close to the event horizon, gravitational lensing, Doppler beaming, and time delays play a role in generating the observed signal. To investigate the geometry of the emission region we have focused on a small segment of the light curve where a QPO is particularly strong. Part of this curve is shown in Fig. 2. Within the segment we generated a vertically integrated map of the radius and azimuth (relative to the observing camera) of the origin of photons that are detected in the NIR. The resulting map of is shown in Fig. 3. The disk orbits counterclockwise around the hole and the camera is at the far right. Evidently each camera detects emission from a region that forms a slender, leading spiral around the hole. The spiral footprint extends for almost radians.
The camera footprint is radially narrow but azimuthally extended. Since the observation process convolves disk structure with the camera footprint, the footprint filters out fluctuations from azimuthally narrow structures (evident in Fig. 4; indeed most studies show flat spatial power spectra for disk turbulence from up to a few). The decline in power above (and thus, according to Fig. 1, with increasing ) is partially due to this smoothing effect of the camera footprint. The radial narrowness of the footprint also implies sensitivity to radially narrow structures. Radial infall of an axisymmetric emitting region through the footprint would yield variability. No nonaxisymmetric structure is required. Nevertheless, our analysis shows that the QPOs stem from structure in the emitting plasma.
4.2 Underlying flow structure
What is the structure that generates the QPOs? We investigate this by suppressing nonaxisymmetric structure in each fluid variable in turn and recalculating a segment of the light curve with a strong QPO signal. This procedure reveals that the QPOs are mainly generated by variations in magnetic field strength666Using an angle-averaged emissivity barely alters the QPO amplitude, so variations in field direction are not essential.; Fluctuations in the temperature contribute, but at a lower level. Lightcurves in which nonaxisymmetric structure in the magnetic field and temperature are removed show little variability.
If we ignore the dips in the power spectra between the peaks at and , the QPO is a broad feature with . The individual peaks at , , and have . On average they are, therefore, not very long-lived or coherent structures, as one might expect if they are due to turbulence in the disk. They are not orbiting blobs; we see no evidence for coherent, orbiting “hot spots” in the disk.
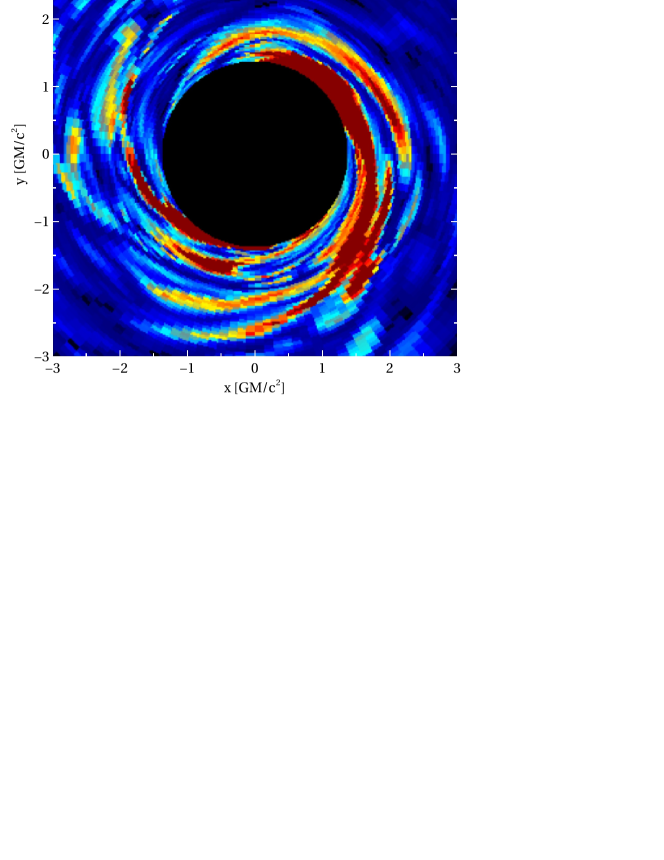
Figure 4 shows a single snapshot of in the midplane close to the black hole, which shows that there is large-scale structure in the magnetic field. Visual inspection of animations of similar images shows that trailing spiral magnetic filaments propagate inward and move approximately with the fluid velocity. That the QPO-generating features track the fluid velocity strongly suggests that the QPO frequency should scale with the orbital frequency at the ISCO, and therefore vary with , but we have not yet analyzed models with different spin.
4.3 Significance and persistence of individual peaks
Are our QPOs statistically significant? To check, we compute PSDs of the full unsegmented light curves and fit each with a sequence of nested models including from zero to three QPOs. Likelihood-ratio tests then indicate that all three QPOs are highly significant in all three power spectra, with p-values . The fitted PSDs and the best-fit models are shown in Fig. 5.
Though significant, the QPOs are not persistent. Figure 5 shows the PSDs from the first and last half of the simulation, averaged over segments as in Fig. 1. We see that the PSDs from the full simulation are very similar to those from the last half alone. This is because the last half of the simulation includes weak flares that dominate the total power. We also see that the PSDs from the first half show QPO-like features but with slightly different frequencies, though close to . This suggests that PSDs computed from longer time series would have broad bumps near , but finite length realizations of the light curves are likely to show narrower QPO signals at one or more frequencies that may reflect real quasi-periodic behavior. Our model shows transient QPOs with that appear stochastically at frequencies near .
4.4 Detectability
Are the QPOs detectable? Recall that our model underproduces the NIR flux of Sgr A* by a factor of 10–30. Also, the observed (Hornstein et al., 2007; Trap et al., 2011), whereas our model predicts a red spectral slope. This can be understood if the electron distribution function has a quasi-thermal core and a nonthermal, high-energy tail. For a power-law distribution of electrons with number density , , the emissivity is , so the observed NIR slope implies , a common slope for synchrotron-emitting sources. The change in NIR emissivity may affect the detectability of the QPO.
We have not yet incorporated a nonthermal tail of electrons into our time-dependent model (see Leung, 2010, where time-averaged models with a nonthermal tail can produce Sgr A*’s NIR flux). Naively, one would expect a nonthermal model to be less sensitive to than a thermal model: a nonthermal component with fixed has , i.e. , whereas in the NIR our thermal model has , where is a characteristic frequency for synchrotron emission. For parameters appropriate to the NIR in Sgr A*, , suggesting a reduced amplitude for a nonthermally generated QPO. On the other hand, the density of nonthermal electrons may be sensitive to and . That some nonlinear sensitivity of the emissivity to , , or is required is consistent with the absence of a QPO near the sub-mm peak, where the emissivity is only weakly sensitive to all three. An accurate assessment of QPO strength for any particular nonthermal component will require a full, time-dependent model.
Nonetheless, a prominent feature in the power spectrum close to in geometrically thick, optically thin accretion flows seems robust. Hot flows concentrate their emission in a narrow ring near the ISCO whereas optically thick disks do not. The emission is (strongly or weakly) variable due to the inevitable presence of turbulence in the accretion flow, and variation at frequencies due to small scale structure will inevitably be averaged away by the observing process.
5 Summary
We have performed GRMHD and radiative simulations of the accretion flow in Sgr A* and found prominent features near the ISCO orbital frequency in both NIR and X-ray light curves. These features are not present for face-on observers or in the millimeter or submillimeter. We have shown that: (1) the features have an structure on the celestial sphere as seen from the source, and are therefore due to structure in the source; therefore (2) full azimuthal domain models are required to accurately model the light curves of similar sources; (3) the variable emission arises near and inside the ISCO and therefore probes a strongly relativistic regime close to the event horizon; (4) observations in the NIR and X-ray bands are sensitive to a narrow spiral footprint on the disk midplane; (5) the variability, for our emission model, is dominated by variations in the magnetic field strength, with a lesser contribution from variations in the disk temperature; (6) the varying features move approximately with the fluid velocity, therefore (7) the centroid frequencies should be sensitive to the ISCO orbital frequency and therefore black hole spin. Discovery of similar features in the variability spectrum of Sgr A* would be an exciting opportunity to probe the spin of the galaxy’s central black hole.
References
- Aschenbach et al. (2004) Aschenbach, B., Grosso, N., Porquet, D., & Predehl, P. 2004, A&A, 417, 71
- Bélanger et al. (2006) Bélanger, G., Terrier, R., de Jager, O. C., Goldwurm, A., & Melia, F. 2006, Journal of Physics Conference Series, 54, 420
- Chan et al. (2009) Chan, C.-k., Liu, S., Fryer, C. L., Psaltis, D., Özel, F., Rockefeller, G., & Melia, F. 2009, ApJ, 701, 521
- Dexter et al. (2009) Dexter, J., Agol, E., & Fragile, P. C. 2009, ApJ, 703, L142
- Dexter et al. (2010) Dexter, J., Agol, E., Fragile, P. C., & McKinney, J. C. 2010, ApJ, 717, 1092
- Dexter & Fragile (2011) Dexter, J., & Fragile, P. C. 2011, ApJ, 730, 36
- Do et al. (2009) Do, T., Ghez, A. M., Morris, M. R., Yelda, S., Meyer, L., Lu, J. R., Hornstein, S. D., & Matthews, K. 2009, ApJ, 691, 1021
- Dolence et al. (2009) Dolence, J. C., Gammie, C. F., Mościbrodzka, M., & Leung, P. K. 2009, ApJS, 184, 387
- Dolence et al. (2011a) Dolence, J. C., Gammie, C. F., & Shiokawa, H. 2011a, in prep.
- Dolence et al. (2011b) Dolence, J. C., Gammie, C. F., & Shiokawa, H. 2011b, in prep.
- Dolence (2011) Dolence, J. C. 2011, PhD Thesis, University of Illinois
- Eckart et al. (2006) Eckart, A., Schödel, R., Meyer, L., Trippe, S., Ott, T., & Genzel, R. 2006, A&A, 455, 1
- Gammie et al. (2003) Gammie, C. F., McKinney, J. C., & Tóth, G. 2003, ApJ, 589, 444
- Genzel et al. (2003) Genzel, R., Schödel, R., Ott, T., Eckart, A., Alexander, T., Lacombe, F., Rouan, D., & Aschenbach, B. 2003, Nature, 425, 934
- Ghez et al. (2008) Ghez, A. M., Salim, S., Weinberg, N. N., Lu, J. R., Do, T., Dunn, J. K., Matthews, K., Morris, M. R., Yelda, S., Becklin, E. E., Kremenek, T., Milosavljevic, M., & Naiman, J. 2008, ApJ, 689, 1044
- Gierliński et al. (2008) Gierliński, M., Middleton, M., Ward, M., & Done, C. 2008, Nature, 455, 369
- Gillessen et al. (2009a) Gillessen, S., Eisenhauer, F., Fritz, T. K., Bartko, H., Dodds-Eden, K., Pfuhl, O., Ott, T., & Genzel, R. 2009a, ApJ, 707, L114
- Gillessen et al. (2009b) Gillessen, S., Eisenhauer, F., Trippe, S., Alexander, T., Genzel, R., Martins, F., & Ott, T. 2009b, ApJ, 692, 1075
- Henisey et al. (2009) Henisey, K. B., Blaes, O. M., Fragile, P. C., & Ferreira, B. T. 2009, ApJ, 706, 705
- Hornstein et al. (2007) Hornstein, S. D., Matthews, K., Ghez, A. M., Lu, J. R., Morris, M., Becklin, E. E., Rafelski, M., & Baganoff, F. K. 2007, ApJ, 667, 900
- Kato (2004) Kato, Y. 2004, PASJ, 56, 931
- Leung (2010) Leung, P. K. 2010, PhD Thesis, University of Illinois at Urbana-Champaign
- Meyer et al. (2008) Meyer, L., Do, T., Ghez, A., Morris, M. R., Witzel, G., Eckart, A., Bélanger, G., & Schödel, R. 2008, ApJ, 688, L17
- Meyer et al. (2009) Meyer, L., Do, T., Ghez, A., Morris, M. R., Yelda, S., Schödel, R., & Eckart, A. 2009, ApJ, 694, L87
- Meyer et al. (2006b) Meyer, L., Eckart, A., Schödel, R., Duschl, W. J., Mužić, K., Dovčiak, M., & Karas, V. 2006b, A&A, 460, 15
- Meyer et al. (2006a) Meyer, L., Schödel, R., Eckart, A., Karas, V., Dovčiak, M., & Duschl, W. J. 2006a, A&A, 458, L25
- Morgan et al. (1997) Morgan, E. H., Remillard, R. A., & Greiner, J. 1997, ApJ, 482, 993
- Mościbrodzka et al. (2011) Mościbrodzka, M., Gammie, C. F., Dolence, J. C., & Shiokawa, H. 2011, ApJ, 735, 9
- Mościbrodzka et al. (2009) Mościbrodzka, M., Gammie, C. F., Dolence, J. C., Shiokawa, H., & Leung, P. K. 2009, ApJ, 706, 497
- Noble et al. (2009) Noble, S. C., Krolik, J. H., & Hawley, J. F. 2009, ApJ, 692, 411
- Press et al. (1992) Press, W. H., Teukolsky, S. A., Vetterling, W. T., & Flannery, B. P. 1992, Numerical Recipes in FORTRAN. The Art of Scientific Computing (2nd ed.; Cambridge: Cambridge University Press)
- Remillard & McClintock (2006) Remillard, R. A., & McClintock, J. E. 2006, ARA&A, 44, 49
- Reynolds & Miller (2009) Reynolds, C. S., & Miller, M. C. 2009, ApJ, 692, 869
- Schnittman et al. (2006) Schnittman, J. D., Krolik, J. H., & Hawley, J. F. 2006, ApJ, 651, 1031
- Shiokawa et al. (2011) Shiokawa, H., Dolence, J. C., Gammie, C. F., Noble, S. C. 2011, ApJ, submitted
- Strohmayer (2001) Strohmayer, T. E. 2001, ApJ, 552, L49
- Trap et al. (2011) Trap, G., et al. 2011, A&A, 528, A140
- Trippe et al. (2007) Trippe, S., Paumard, T., Ott, T., Gillessen, S., Eisenhauer, F., Martins, F., & Genzel, R. 2007, MNRAS, 375, 764