Overspill avalanching in a dense reservoir network
Abstract
Sustainability of communities, agriculture, and industry is strongly dependent on an effective storage and supply of water resources. In some regions the economic growth has led to a level of water demand which can only be accomplished through efficient reservoir networks. Such infrastructures are not always planned at larger scale but rather made by farmers according to their local needs of irrigation during droughts. Based on extensive data from the upper Jaguaribe basin, one of the world’s largest system of reservoirs, located in the Brazilian semiarid northeast, we reveal that surprisingly it self-organizes into a scale-free network exhibiting also a power-law in the distribution of the lakes and avalanches of discharges. With a new self-organized-criticality-type model we manage to explain the novel critical exponents. Implementing a flow model we are able to reproduce the measured overspill evolution providing a tool for catastrophe mitigation and future planning.
Water is simultaneously the most relevant commodity for life and the primary medium through which people and the environment are affected by natural disasters Tilman99 ; Jury05 ; IPCC ; Parry07 ; Ward08 ; Piao07 . According to the Food and Agriculture Organization of the United Nations, the water demand in the last century has grown more than twice the population increase and as forecast, by , about people will be living in water scarcity FAO . This is not only related to the availability of freshwater but also with the lack of proper storage and distribution infrastructures. It is thus of paramount interest to understand how to guarantee an even spatial and temporal distribution of water, avoiding the imbalance between supply and demand. The first step in this direction, which we address here, is to analyze how the interplay between the rainfall and evaporation affects the filling level in the reservoirs and the network.
In semiarid environments like the Brazilian northeast it is common to have droughts drastically affecting the crops. The weather in the region is characterized by intermittent rains and long periods of water scarcity. The water supply, in the dry season, is assured by a dense set of surface reservoirs, which are essential for the sustainability of the region, since during the rainy season water is stored to be distributed afterwards. A proper reservoir size is crucial: while smaller reservoirs are typically unable to supply enough water throughout the entire dry season, due to the low storing capacity and high losses through evaporation and infiltration, too large reservoirs can have serious consequences for life sustainability. For example, if the storage capacity in a basin exceeds the volume equivalent to three times the average annual runoff, its water will not be sufficiently renewed Malveira12 . Not only the properties of each reservoir are relevant but also the way they are interconnected. For example, upstream reservoirs may retain a significant part of the collected water which enables an efficient spatial distribution by ensuring a continuous connection with other reservoirs even during dry seasons, when usually no water flows through the river network Mamede08 ; Trush00 ; LimaNeto11 . The available data from interferometric radar and weather stations Alsdorf00 ; Alsdorf07 ; Lincoln07 ; Syed10 provide the necessary ingredients for a systematic analysis of the existing network, which is fundamental to further planning for improvement. We introduce here a hydrological model for the evolution of water resources in the network and apply it to the upper Jaguaribe basin, a semiarid region in the Brazilian northeast, for which we have collected information about the rainfall and the distribution of reservoirs over two decades.
I The Reservoir Network
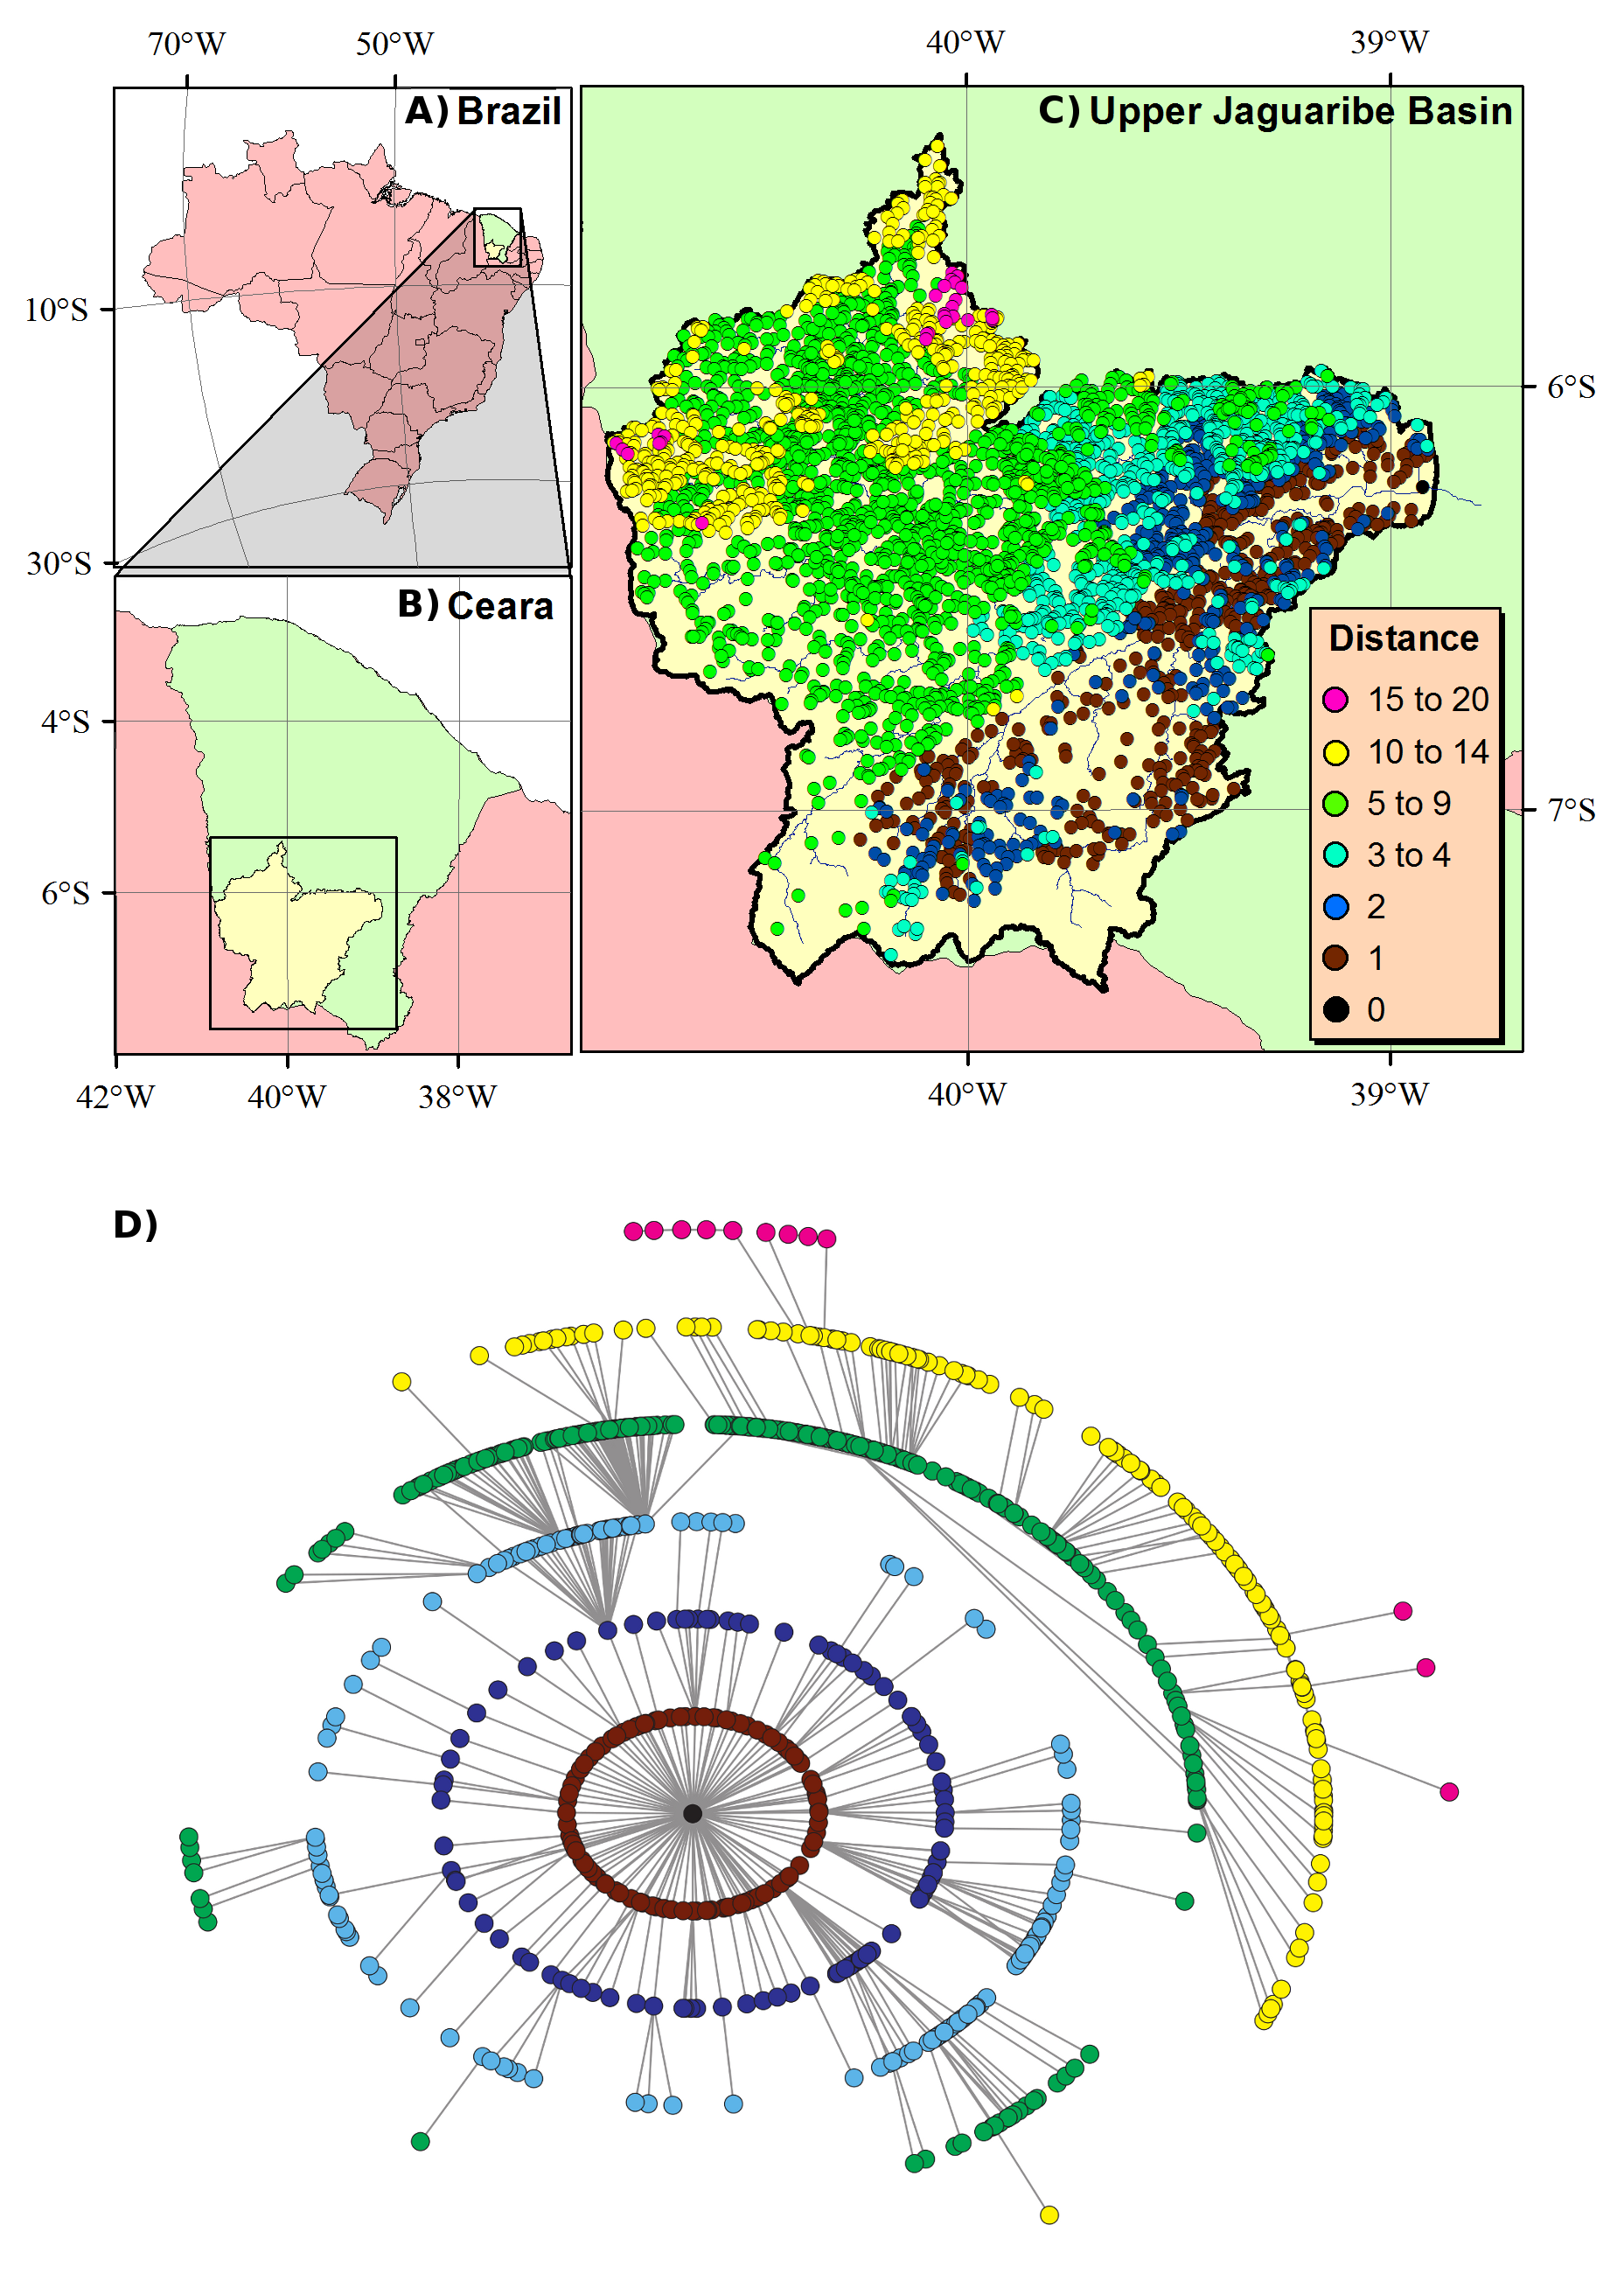
Located in the state of Ceará, northeast of Brazil, the upper Jaguaribe basin has a catchment area of about and almost reservoirs (see Fig. 1). Characterized by a broad reservoir-size distribution, ranging from to , this basin stores water for more than half-million people. It has an average annual rainfall of and a potential evaporation as high as . The weather conditions together with shallow soils above crystalline bedrocks make the rivers intermittent and leads to runoff rates below of the precipitation. The main river is the Jaguaribe, which contributes to the Orós reservoir located at the basin outlet, the black reservoir in Fig. 1 (northeast). The latter, with a storage capacity of , is the second largest reservoir of the state and an important water reserve, which yields about with an annual reliability level of , i.e., probability of being able to supply this amount every year.
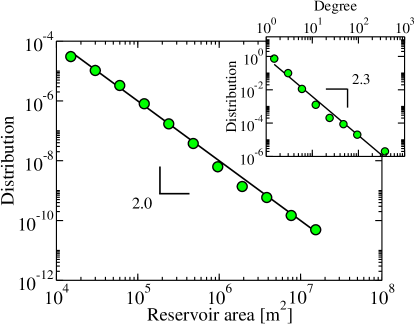
Analyzing satellite images from the wet years (see section Materials and Methods), we have identified the geographical location and size of each reservoir, as well as the connection between them. The location of the full set of reservoirs in the Jaguaribe basin is represented in Fig. 1 C. The color scheme stands for the distance from the outlet (Orós), in units of reservoirs. As shown in Fig. 1 D, to characterize the network we schematize it as a graph where reservoirs are nodes and the connections between them are links. The links are directional since flow goes from upstream to downstream, based on the height difference between reservoirs. The collected data disclose a network of reservoirs organized in a tree with low branching rate. All reservoirs have a single outlet connection but with a broad distribution of inlets. While most upstream reservoirs have no inlet connection, for the ones downstream typically multiple connections exist (see Fig. 1 D). The degree of the reservoir (i.e., number of connections) varies from one to around and the degree distribution , is a power law, , with a degree exponent , as shown in the inset of Fig. 2.
The satellite images from the wet years allow to measure the area () of each reservoir disclosing a power-law distribution of areas, , with (see Fig. 2). From the area, the storage capacity () can also be estimated. Molle Molle89 has studied reservoirs of the Brazilian semiarid region, a domain in the northeast and southeast of Brazil, and proposed an area/volume relation given by,
| (1) |
where and have been established empirically to be and . For the upper Jaguaribe basin, Mamede Mamede08 tested this equation for reservoirs showing satisfactory agreement. Since the capacity of a reservoir cannot be directly measured with the satellite imagery, we apply the same relation (Eq. 1) to the remaining reservoirs.
II Hydrological Model
The planning of an efficient reservoir network requires the analysis of its response to typical weather conditions. The amount of water in a reservoir is a dynamical quantity, with a positive contribution from precipitation and upstream inflow, while mechanisms such as groundwater infiltration, evaporation, and overflow tend to reduce it. To quantify the precipitation and evaporation, meteorological time series for monthly evaporation level and rainfall (volume per area) have been obtained for the weather stations of the region Funceme . From the topology of the basin, the watershed lines have been traced and the subbasin of each reservoir determined. The daily average of rainfall and evaporation in the subbasin is determined from the closest station. The net evaporation is estimated based on the mean reservoir area, while the contribution of the precipitation to the reservoir level accounts for both direct rainfall in its area and a fraction of the one falling in the area of the subbasin drained into it. The latter fraction is denoted as runoff and depends on factors such as soil constituents, vegetation coverage, rain intensity (both actual and preceding), and topography Easterling07 ; Barnett09 ; Koster10 ; Pagano10 . For simplicity, we take the same value of the runoff () for the entire region, i.e., of the rainfall in the subbasin, outside the reservoir, is considered to drain into the reservoir. As discussed below, a good agreement is found for the time evolution of the water volume in different reservoirs with this uniform runoff coefficient.
To model the time evolution of the water resources in the reservoir network we consider that initially each reservoir is at of its storage capacity (presented results are not affected by the initial conditions). Following the time series for the rainfall and evaporation, the inflow of water to each reservoir is computed on a daily basis accounting for three contributions: direct rainfall, water drained from the subbasin, and inflow from reservoirs upstream. Reservoirs are updated from upstream to downstream and the overflow is obtained from the difference between the total amount of water and the storage capacity. The exceeding water is transferred to the reservoirs downstream, where we neglect transmission losses through the river transport. When an overflow occurs, water is transferred to the next reservoir which can trigger a cascade of overflows of other reservoirs downstream. We denote as avalanche this type of events and we measure their size as the number of connected reservoirs which overflow within the same day.
III Water Transport
For simplicity, let us start by considering a uniform distribution of rainfall and evaporation over the entire region during two decades. At the subbasin level, a competition takes place between the increase of water due to the rain and upstream inflow and the evaporation. Reservoirs where the influx is larger than the outflux, after some initial filling time, are full and constantly overflowing, i.e., transferring water to the one downstream. On the other hand, reservoirs where losses are not compensated by incoming water, essentially dry out and overflow never occurs. As an example, we take a level of precipitation of and an evaporation of (per unit area and day), corresponding to the daily averages for the period between and . When we initialize the system with all reservoirs at of their capacity, after years, every day, one avalanche affecting reservoirs occurs. This scenario is not observed in reality since both the precipitation and evaporation are asymmetrically distributed in space and time. Therefore, a meaningful modeling of the water transport requires a proper quantitative description of these two key processes.
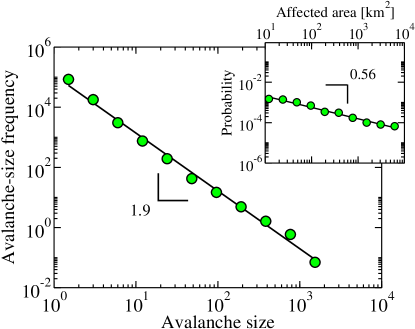
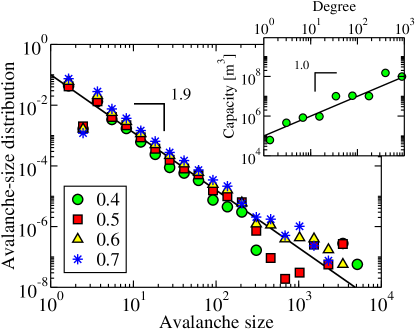
Inserting the time series for rainfall and evaporation from till the end of , we have followed the dynamics of the reservoir network and measured the size of the avalanches as well as the volume of water storage at each reservoir. We define the avalanche size as the number of connected reservoirs from which water overflows during the same day. Over these two decades, in the rainy seasons, many avalanches are observed with sizes ranging over three orders of magnitude. Most of the avalanches solely affect two reservoirs, but large ones also occur (see Supporting Video). The avalanche-size histogram , shown in Fig. 3, scales with the avalanche size as , with . The power law behavior is related to the absence of a characteristic scale in the avalanches (see section Stochastic Model). In the considered time interval, the largest observed avalanche occurred during the day th of and involved about reservoirs, i.e., more than of the entire set. In the inset of Fig. 3 we also show the distribution of the area affected during an avalanche. The affected area is defined as the total area of catchments related to the overflowing reservoirs. This distribution scales as , with . This low value of reveals that large scale events evolving extended catchment areas also occur.
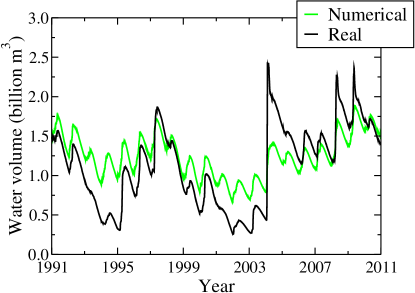
A constant runoff of has been considered. The exponent of the avalanche-size histogram is resilient over a wide range of runoff coefficients (below ). For large values of runoff some reservoirs have a large inflow of water when compared to the outflow and, once full, they overflow every day. While the exponent of the avalanche-size histogram does not depend on the runoff coefficient, to reproduce the measured water volume of each reservoir, a proper value is required. As pictured in Fig. 4, with the considered runoff, the water volume is satisfactorily reproduced over most of the considered time range. Slight differences between the simulation and real values occur after long periods of intensive rain. As discussed by Koster et al. Koster10 , in this case the runoff coefficient could have been affected by the antecedent rainfall. As observed for , after long periods of intensive rain, the wet soils enhance the runoff, promoting the drainage of a larger volume of water from the subbasin to the reservoir and thus larger avalanches.
IV Stochastic Model
The most striking result unveiled by our hydrological model is the power-law avalanche-size distribution. This result resembles the fingerprint of self-organized critical (SOC) systems disclosed by P. Bak Bak96 though with a different exponent than SOC on scale-free trees Goh03 ; Luque08 . SOC is characterized by branching, where the discharge into neighbors might trigger also their discharge under slow driving. However, none of these features appears in the reservoir networks. Rain falls synchronously on several reservoirs and, while the inflow connections are scale free, the outflow occurs through one single connection (no branching). Furthermore, water coming from the synchronous overspill at two (or more) upstream reservoirs joins on downstream ones and increases the amount of water transported through a single branch.
Let us consider the following model for the same set of reservoirs from the upper Jaguaribe basin. Each reservoir is characterized by its amount of water . Iteratively, a unit volume of water is added to randomly selected reservoirs. Though on average each reservoir receives the same amount of water, at iteration a reservoir can be selected more than once. To each reservoir a threshold is assigned such that if the amount of water in the reservoir exceeds this threshold, , overspill occurs and a fraction of water is transferred to the downstream reservoir while the remaining water is dissipated (evaporation and transmission losses). Since the inset of Fig. 5 shows a linear relation between the capacity of a reservoir and its number of connections (degree), we take as equal to the degree. In the main plot of Fig. 5 we show the avalanche-size distributions for different values of dissipation obtained simulating the above model on the reservoirs identified in the upper Jaguaribe basin. For a wide range of , results are consistent with a power-law distribution extended over three orders of magnitude with the same exponent obtained with the hydrological model in Fig. 3 (solid line).
V Final Remarks
In summary, we found some unexpected scale-free behavior in the dynamics of water transport on a reservoir network, using available data for the geographical distribution of reservoirs as well as the time series of rainfall and water evaporation. The hydrological model for the in- and outflow balance at each reservoir reveals an excellent qualitative and, in most of the cases, quantitative agreement for the upper Jaguaribe basin over two decades. The analysis of these reservoirs, with satellite imagery, discloses a tree-like scale-free network with a power-law distribution of capacities. Our model for the water transport shows a cascade dynamics of connected spilling over reservoirs characterized by overflows extended over three orders of magnitude in length scales. The introduced stochastic model grasps the main features observed with the hydrological model. With this scheme it is now possible to characterize the role of the network topology, spatial and time correlation of the rainfall, and evaporation, on water flow. The proposed tools aim also to help the planning of new reservoirs by numerically testing their impact under typical weather conditions, avoiding either scarcity over dry seasons or floods in rainy ones. Despite the degree of agreement between numerical and real data, further improvement of the model may reproduce even more details. Future work can account for the temporal evolution of the network itself and its impact in the region Poff07 . In this study the water transport between reservoirs has been considered to occur within one day and without transmission losses, a more detailed description of the mass transport could also be included Keer07 ; Moyle07 . Upstream reservoirs also serve as sediment detention basins, retaining a considerable amount of sediment generated within the catchment and extending the lifetime of larger reservoirs located downstream Mamede08 ; LimaNeto11 , affecting the storage capacity and, consequently, the entire dynamics Araujo06 ; Malmon05 . Understanding the impact of such mechanism may also be an interesting focus of research.
VI Materials and methods
To identify the reservoirs in the network and quantify their maximum capacity we analyzed images from three wet years, namely, 2004, 2008, and 2009. These images, collected by the satellites LANDSAT (1, 2, 3, 5, and 7) and CBERS (2 and 2B), were obtained from the website of the “Instituto Nacional de Pesquisas Espaciais” INPE . The LANDSAT generates images in seven bandwidths: three in the visible region, one in the near infrared, two in the mid-infrared, one in the thermal infrared, and a panchromatic one. By properly selecting reference points, the obtained images have been georeferenced and prepared to be used in the Geographical Information System (GIS). Through unsupervised classification techniques, which do not require any further information besides the images, the data have been processed and pixels grouped by spectral features to identify the ones corresponding to water reservoirs. An additional handmade filtering was necessary to avoid misleading information due to the presence of clouds. By superposing the images for different years, it was possible to locate each reservoir and trace its perimeter, obtaining the maximum area. With the relation proposed by Molle Molle89 , Eq. 1, the maximum capacity of each reservoir has been estimated. The drainage network was obtained from the analysis of high-resolution elevation data, collected by the Shuttle Radar Topography Mission (SRTM) from NASA Farr07 ; SRTM , by tracing the watershed lines, and afterward each reservoir was located in this network. The dataset with the network and geographical localization of each reservoir is available as Supporting Information. The daily average of rainfall for each reservoir is obtained from the closest weather stations and the evaporation is estimated from the monthly average over several decades Funceme . The pan evaporation data accounts for the evaporation on the surface of the reservoir (about of class A pan evaporation) Linacre94 , for the infiltration, as well as for the water extracted for several uses (about ) Molle89 ; Malveira12 .
Acknowledgements.
We acknowledge financial support from the ETH Risk Center. We also acknowledge the Brazilian agencies CNPq, CAPES and FUNCAP, and the Pronex grant CNPq/FUNCAP, for financial support. This study has mainly been supported by a grant of the ETH North-South Centre. We thank COGERH – Water Management Agency for providing data about several reservoirs.References
- (1) Tilman D (1999) Global environmental impacts of agricultural expansion: The need for sustainable and efficient practices. Proc Natl Acad Sci USA 96:5995-6000.
- (2) Jury W A, Vaux H J (2005) The role of science in solving the world’s emerging water problems. Proc Natl Acad Sci USA 102:15715-15720.
- (3) Intergovernmental Panel on Climate Change: http:://www.ipcc.ch/
- (4) Parry M L, Canziani O F, Palutikof J P, van der Linden P J, and Hanson C E, Editors (2007) Contribution of Working Group II to the Fourth Assessment Report of the Intergovernmental Panel on Climate Change. Cambridge University Press, Cambridge, United Kingdom.
- (5) Ward F A, Pulido-Velazquez M (2008) Water conservation in irrigation can increase water use. Proc Natl Acad Sci USA 105:18215-18220.
- (6) Piao S, Friedlingstein P, Ciais P, de Noblet-Ducoudre N, Labat D, Zaehle S (2007) Changes in climate and land use have a larger direct impact than rising CO2 on global river runoff trends. Proc Natl Acad Sci USA 104:15242-15247.
- (7) Food and Agriculture Organization of the United Nations: http://www.fao.org/
- (8) Malveira V T C, de Araújo J C, Guentner A (2012) Hydrological impact of a high-density reservoir network in the semiarid north-eastern Brazil. To be published in the Journal of Hydrologic Engineering.
- (9) Mamede G L (2008) Reservoir sedimentation in dryland catchments: modeling and management. PhD Thesis, University of Potsdam, Germany.
- (10) Trush W J, McBain S M, Leopold L B (2000) Attributes of an alluvial river and their relation to water policy and management. Proc Natl Acad Sci USA 97:11858-11863.
- (11) Lima Neto I E, Wiegand M C, de Araújo J C (2011) Sediment redistribution due to a dense reservoir network in a large semi-arid Brazilian basin. Hydrolog Sci J 56:319-333.
- (12) Alsdorf D E, Melack J M, Dunne T, Mertes L A K, Hess L L, Smith L C (2000) Interferometric radar measurements of water level changes on the Amazon floodplain. Nature 404:174-177.
- (13) Alsdorf D E, Bates P, Melack J, Wilson M, Dunne T (2007) Spatial and temporal complexity of the Amazon flood measured from space. Geophys Res Lett 34:L08402.
- (14) Lincoln T (2007) Flood of data. Nature 447:393.
- (15) Syed T H, Famiglietti J S, Chambers D P, Willis J K, Hilburn K (2010) Satellite-based global-ocean mass balance estimates of interannual variability and emerging trends in continental freshwater discharge. Proc Natl Acad Sci USA 107:17916-17921.
- (16) Fundação Cearense de Meteorologia e Recursos Hídricos: http://www.funceme.br/
- (17) Easterling W E (2007). Climate change and the adequacy of food and timber in the 21st century. Proc Natl Acad Sci USA 104:19679.
- (18) Barnett T, Pierce D W (2009) Sustainable water deliveries from the Colorado River in a changing climate. Proc Natl Acad Sci USA 106:7334-7338.
- (19) Koster R D, Mahanama S P P, Livneh B, Lettenmaier D P, Reichle R H (2010) Skill in streamflow forecasts derived from large-scale estimates of soil moisture and snow. Nat Geosci 3:613-616.
- (20) Pagano T C (2010) Hydrology: Soils, snow and streamflow. Nature Geoscience 3:591-592.
- (21) Companhia de Gestão dos Recursos Hídricos: http://www.cogerh.com.br/
- (22) Bak P (1996) How nature works: the science of self-organized criticality (Springer-Verlag. New York).
- (23) Goh K-I, Lee D-S, Kahng B, Kim D (2003) Sandpile on scale-free networks. Phys Rev Lett 91:148701.
- (24) Luque B, Miramontes O, Lacasa L (2008) Number theoretic example of scale-free topology inducing self-organized criticality. Phys Rev Lett 101:158702.
- (25) Poff L R, Olden J D, Merritt D M, Pepin D M (2007) Homogenization of regional river dynamics by dams and global biodiversity implications. Proc Natl Acad Sci USA 104:5732-5737.
- (26) Keer R A (2007) River-level forecasting shows no detectable progress in two decades. Science 316:1555.
- (27) Moyle P M, Mount J F (2007) Homogeneous river, homogeneous faunas. Proc Natl Acad Sci USA 104:5711-5712.
- (28) de Araújo J C, Guentner A, Bronster A (2006) Loss of reservoir volume by sediment deposition and its impact on water availability in semiarid Brazil. Hydrolog Sci J 51:157-170.
- (29) Malmon D V, Reneau S L, Dunne T, Katzman D, and Drakos P G (2005) Influence of sediment storage on downstream delivery of contaminated sediment. Water Resour. Res. 41:W05008.
- (30) Instituto Nacional de Pesquisas Espaciais: http://www.inpe.br/
- (31) Molle F (1989) Evaporation and infiltration losses in small reservoirs. Serie Hydrologia 25, SUDENE/ORSTOM, Recife, Brazil.
- (32) Farr T G et al. (2007) The Shuttle Radar Topography Mission. Rev. Geophys. 45:RG2004.
- (33) Shuttle Radar Topography Mission: http://www2.jpl.nasa.gov/srtm/
- (34) Linacre E T (1994) Estimating U. S. Class A pan evaporation from few climate data. Water International 19:5-14.