Edmond L. Bergerb, Qing-Hong Caoa, Chuan-Ren Chenb,
Jiang-Hao Yuc, Hao Zhangb,daDepartment of Physics and State Key Laboratory of Nuclear Physics
and Technology, Peking University, Beijing, 100871, China bHigh Energy Division, Argonne National Laboratory, Argonne, IL 60439, USA cDepartment of Physics and Astronomy, Michigan State University, East Lansing, MI 48824, USA dIllinois Institute of Technology, Chicago, Illinois 60616-3793, USA
Abstract
A large forward-backward asymmetry is seen in both the top quark rapidity distribution
and in the rapidity distribution of charged leptons from top quarks produced at the
Tevatron. We study the kinematic and dynamic aspects of the relationship
of the two observables arising from the spin correlation between the charged lepton and the
top quark with different polarization states. We emphasize the value of both measurements, and
we conclude that a new physics model which produces more right-handed than left-handed top
quarks is favored by the present data.
Introduction. The observed forward-backward asymmetry in the rapidity distribution of top
quarks Aaltonen:2011kc ; Abazov:2011rq at the Tevatron deviates by about two standard deviations () from standard model (SM) expectations Kuhn:1998jr .
In addition to , the D0 group also reports a positive forward-backward asymmetry of charged leptons from top quark decays of compared with the small value from SM Abazov:2011rq .
The deviation of the asymmetries may be contrasted with the good agreement of the overall rate for top quark production with SM predictions.
In this Letter, we focus on the kinematic and dynamic relationship between and .
We investigate how the distribution of leptons in the laboratory frame is related to the polarization state of the top quark parent.
We show in a model-independent manner that current data on the ratio of the two asymmetries imply that more right-handed than
left-handed top quarks are produced. This is a second and independent indication from asymmetry data of discrepancy from the SM since an equal number of right- and left-handed top quarks is predicted in the SM. We urge confirmation of the D0 result by the CDF collaboration and with the full data set in D0. Measurements of both and are especially valuable because their correlation can be related through top quark polarization to the underlying dynamics of top quark production.
We begin with a discussion of the angular distribution of decay leptons, first in the rest frame of the top quark and then in the laboratory frame.
Subsequently, we derive the relationship of and separately for left- and right-handed top quarks. Different models of new physics produce top quarks with different proportions of left- and right-handed polarization.
We use a model wprime and an axigluon model axi1 to deduce their different expectations for . The model and other models Shu:2009xf with more right- than left-handed top quarks tend to be preferred by the data provided that the constraint of the overall rate is satisfied.
Kinematics. In the top quark rest frame, the distribution in the polar angle of a decay lepton is Mahlon:1995zn
(1)
where denotes the top quark helicity; for a right-handed
(), and for a left-handed top quark (). The angle is measured
with resect to the direction of motion of the top quark in the laboratory frame.
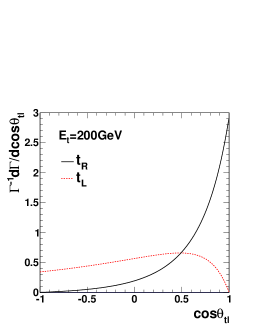
Figure 1:
distribution in the boosted frame for a top quark
with .
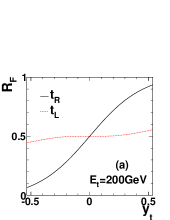
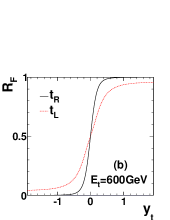
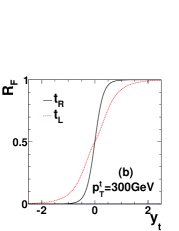
Figure 2:
(a) The ratio as a function of for a top quark with and (b) .
Once the top quark is boosted, the angular distribution of the charged lepton relative to the
direction of motion of the top quark is sensitive to
the energy of the top quark . We derive
(2)
where , , and is the angle
between and its parent top quark in the boosted frame.
As illustrated in Fig. 1, for ,
about of follow the top quark (i.e., ) for
a , and almost for a .
The top quark rapidity is where
is the longitudinal (z-component) of the top quark momentum. The forward direction
is specified as the direction of the incident proton beam. The probability for finding a positive
charged lepton in the forward region when it originates from a top quark with a velocity
, rapidity , and polarization is denoted
(3)
where () is the number of leptons in the
forward (backward) region in the laboratory.
After lengthy algebra, we derive
(4)
for , where .
To illustrate the effect of the top quark boost, we plot
as a function of in Fig. 2(a,b). We choose two characteristic top quark energies,
and 600 GeV.
The former energy represents top quarks produced around the threshold region, while the latter
pertains for highly boosted top quarks.
When a top quark moves perpendicular to the beam line, i.e. , there is an equal
number of leptons in the forward and backward regions, i.e. , independent
of and .
For , increases rapidly with
because most of the leptons move close to the direction of motion of the top quark after being
boosted to the lab frame. We
can also see that when becomes larger, i.e. the top quark is more energetic and the lepton
is more boosted, rapidly reaches its maximum value .
On the contrary, in the case of ’s, the ratio does not vary significantly with owing
to the anti-boost effect on . For GeV, the boost causes
to distribute nearly uniformly, and is around . When the energy of ’s is large enough, the large boost forces most
of the charged leptons from top quark decays to move along the top quark direction of motion, even
if they move against the top quark direction of motion in the top quark rest frame. The boost yields a
large value in the region of large . The competing influences leave the curve slightly below the curve.
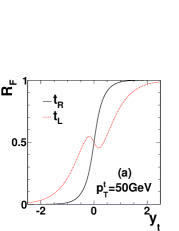
Figure 3: (a) as a function of
for top quarks with fixed and (b) .
In Fig. 3, we show how varies with and . The distributions for ’s do not vary greatly with because most follow . However,
the shapes of the curves for ’s are very
different between the low and high regions. As the top
quark moves forward, i.e. for fixed , the boost becomes more significant as the energy of the
top quark is increased. Therefore, more leptons are forced to move along the direction of the top quark. On
the other hand, some fraction of the decay leptons which are initially in the forward/backward region
() will then be in the backward/forward region.
In summary, two factors affect : the boost and the rearrangement of the distribution of
charged leptons in the forward () and backward () regions.
The former always increases while the latter may increase or decrease depending on at .
Generally speaking, when the initial boost is not significant (low ), decreases when
increases from , as we see in Fig. 3(a). For large enough boost
(), always increases with ; the critical value is obtained from
.
and . Positive indicates more top quarks are produced in
the forward region than in the backward region.
Both and can generate a positive .
However, would need a large boost along the beam
line to overcome the fact that most of
from its decay move against it in its rest frame, while
can yield a positive even for top quarks near
the threshold region. Therefore, the observed positive
and indicate that
the top quark polarization may be playing a non-trivial role. In this section we present a general
analysis of the correlation between and , to prepare for a better
understanding of the numerical results derived from new physics (NP) models.
Assuming the large is generated mainly by NP,
can be divided into the contributions from different polarizations of top quarks:
(5)
where
(6)
Here, denotes the forward-backward asymmetry of the top quark
with polarization generated only by NP, while is
the fraction of top quarks with polarization in events induced
by NP, and ) is the ratio of NP signal events to
the total observed events.
One advantage of decomposing into different top quark polarizations
is to monitor the chirality of the couplings of NP particles to top quarks. Another advantage is to
make the connection between and more transparent.
As discussed earlier, the ratio depends on the top quark kinematics
(, and ). To compute the probability for a charged lepton in the
forward region, one must convolute the top quark production cross section with
on an event-by-event basis, i.e.
(7)
where labels the production rate for a top quark with specific kinematics
(, , ).
The lepton asymmetry generated by a top quark with
polarization is, therefore,
(8)
Because cannot exceed 1, we have .
When is close to a constant ,
e.g. around the threshold () for left-handed top quark
or for a highly boosted top quark,
the lepton asymmetry
can be simplified as
when the pair is produced around the threshold region;
•
in the large region.
Although Eq. (9) is approximate, it helps in understanding the NP prediction obtained
from a complete numerical calculation.
New physics models: axigluon and . We examine two models of new physics, an axigluon
model axi1
and a flavor-changing model wprime . In the axigluon () model we assume for simplicity that the interaction of
to the SM quarks is purely pseudo-vector-like
(10)
where denotes the first two generation quarks and the third generation
quarks. The coupling is the strong coupling strength; and are the
coupling strength of to
and , respectively.
The absence of deviation from the SM expectation in the measured
distribution Aaltonen:2011kc ; Abazov:2011rq
indicates the should be heavy and broad. Its contribution is therefore
through interference with the SM channel.
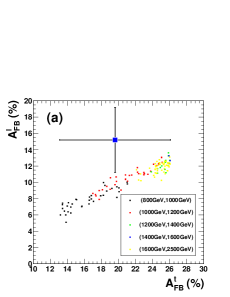
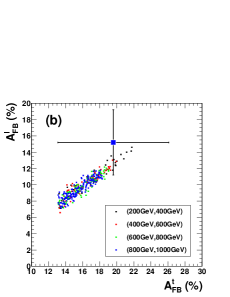
Figure 4: Correlation between and for (a) the axigluon
and (b) the models. The point corresponding to the D0 data is also shown.
The numbers within the parentheses label the lower and upper limits of the mass of the
NP object.
For comparison, the SM values are
(off the left side of the plots in (a) and (b)), and
.
The top quarks are generated unpolarized owing to the pseudo-vector coupling of
the to the SM fermions, and
(11)
Since the cross section is greatest near the threshold region where
and , the expression for
becomes .
We plot our axigluon model predictions for and
in Fig. 4(a).
We first scan the theoretical parameter space (, and )
to fit Tevatron data on
and the total production cross section within .
These parameters are then used to calculate .
The figure shows a clear correlation between and . The best fit to the
correlation is .
To fit both and within , the mass of the
must be greater than TeV. For masses this great, top quarks from decays
are highly boosted and cause more to move along the direction of
the top quarks.
We remark here that if the is found as a resonance in the
mass distribution, the chirality structure of its coupling to can possibly be determined
at the LHC Berger:2011hn .
A different class of NP models to explain the is based
on -channel kinematics.
A model with a non-universal massive neutral vector boson Jung:2009jz is disfavored because it implies an excessive rate for same-sign
top quark production at the 7 TeV LHC Berger:2011ua .
We consider in this paper a flavor-changing which couples an incident -quark to the
produced -quark wprime ,
(12)
where is the weak coupling.
In the model, in addition to the SM process
the pair can also be produced via a -channel process with
a mediator.
In the region , the nonzero helicity
amplitudes are
(13)
where .
In order to produce top quarks in the forward region, one needs
, which is always true for the region of masses (heavier than the top quark) considered in this paper.
At the Tevatron the distribution of the top quark in production peaks around , and therefore most of the
top quarks are not significantly boosted. We can also easily see that in the model.
Since the -channel propagator contributes a minus sign, arises from
a competition between the square of the purely NP term and the interference term of NP with the SM.
The strong correlation is fit well
by .
Moreover, for a relatively light () GeV, both and can be
consistent with the D0 data within .
The ratio of the
predicted to
peaks near in the axigluon model and near in the model. The data from D0 shows about .
The ratio in the SM is close to .
The model generates a larger than the axigluon model because it produces
more right-handed top quarks. The comparison to the D0 point shown in Figs. 4(a,b) indicates
that top quark events with a large proportion of right-handed top quarks are favored. Constraints on flavor-changing
currents in the model allow only right-handed couplings to the top quark, consistent with the D0
results. There is no direct evidence of the handedness of the coupling in the massive gluon models. The D0 result
could be interpreted as an indirect clue for the chiral couplings of the massive gluon.
Summary.
We study the kinematic and dynamic aspects
of the relationship between the asymmetries and based on the spin correlation between charged leptons
and the top quark with different polarization states. Owing to the spin correlation in top quark decay,
and are strongly positively correlated for right-handed top quarks. However, for left-handed
top quarks, the nature of the correlation depends on how boosted the top quark is. For large enough , will also generate a large , similar to that for . However, if is not boosted, from it will be less than for a
positive . Since most of the events are produced in the threshold region, one may use the large positive
values of and measured at D0 to conclude that production of left-handed top quarks is disfavored.
Confirmation of the D0 result and greater statistics are essential. There is great value in making measurements of
both and because their correlation can be related through top quark polarization to the underlying
dynamics of top quark production.
Acknowledgements.
The work of E.L.B., C.R.C. and H.Z. is supported in part by the U.S.
DOE under Grants No. DE-AC02-06CH11357. H.Z. is also supported by DOE under the Grant No. DE-FG02-94ER40840.
The work of J.H.Y. is supported in part by the U.S. National Science Foundation
under Grand No. PHY-0855561.
References
(1)
T. Aaltonen et al. [CDF Collaboration],
Phys. Rev. D 83, 112003 (2011).
(2)
V. M. Abazov et al. [D0 Collaboration], Phys. Rev. D 84, 112005 (2011).
(3)
J. H. Kühn and G. Rodrigo, Phys. Rev. Lett. 81, 49 (1998);
Phys. Rev. D 59, 054017 (1999).
(4)
K. Cheung, W. Y. Keung and T. C. Yuan, Phys. Lett. B 682, 287 (2009).
(5)
P. Ferrario and G. Rodrigo, Phys. Rev. D 80 (2009) 051701;
P. H. Frampton, J. Shu and K. Wang, Phys. Lett. B 683, 294 (2010);
Q.-H. Cao, D. McKeen, J. L. Rosner, G. Shaughnessy, and C. E. M. Wagner, Phys. Rev. D81, 114004 (2010).
(6)
J. Shu, T. M. P. Tait and K. Wang,
Phys. Rev. D 81, 034012 (2010);
A. Djouadi, G. Moreau and F. Richard,
Phys. Lett. B 701, 458 (2011);
D. Krohn, T. Liu, J. Shelton and L. T. Wang,
arXiv:1105.3743 [hep-ph];
A. Falkowski, G. Perez and M. Schmaltz,
arXiv:1110.3796 [hep-ph].
(7)
G. Mahlon and S. J. Parke,
Phys. Rev. D 53, 4886 (1996).
(8)
E. L. Berger, Q. H. Cao, C. R. Chen and H. Zhang,
Phys. Rev. D 83, 114026 (2011).
(9)
S. Jung, H. Murayama, A. Pierce, and J. D. Wells, Phys. Rev. D81, 015004 (2010).
(10)
E. L. Berger, Q. H. Cao, C. R. Chen, C. S. Li and H. Zhang,
Phys. Rev. Lett. 106 (2011) 201801;
S. Chatrchyan et al. [CMS Collaboration],
JHEP 1108 (2011) 005