Studying Supernovae in the Near-Ultraviolet with the
NASA Swift UVOT Instrument
Abstract:
Observations in the near- and mid-ultraviolet (NUV: 2000–3500) performed with the NASA Swift UVOT instrument have revealed that optically-normal SNe Ia feature NUV-optical color evolution that can be divided into NUV-blue and NUV-red groups, with roughly one-third of the observed events exhibiting NUV-blue color curves. Combined with an apparent correlation between NUV-blue events and the detection of unburned carbon in the optical spectra, the grouping might point to a fundamental difference within the normal SN Ia classfication. Recognizing the dramatic temporal evolution of the NUV-optical colors for all SNe Ia, as well as the existence of this sub-division, is important for studies that compare nearby SNe Ia with intermediate or high- events, for the purpose of the cosmological utilization of SNe Ia. SN 2011fe is shown to be of the NUV-blue groups, which will be useful towards interpretation of the gamma-ray line results from the INTEGRAL SPI campaign on SN 2011fe.
1 UVOT Color Curves of Normal SNe Ia
SNe Ia are luminous events that synthesize an appreciable fraction of the iron-peak elements in the universe (Iwamoto et al. 1999) and can be utilized to measure large distances. SN Ia distance estimates have revealed that the expansion of the universe is accelerating (Riess et al. 1998; Perlmutter et al. 1999). There is considerable interest in extending the current utilization of SNe Ia, both by better understanding the SN Ia event and by widening the rest-frame wavelength ranges being utilized. The near-ultraviolet wavelength (NUV: 2000–3500) range, including the range covered by the U-band, has posed challenges for the efforts to understand type Ia supernovae (SNe Ia).
The UVOT instrument on the NASA Swift mission possesses the ability to quickly schedule observations of a new supernova, increasing the chances of observing the important early epochs. The 30cm UVOT telescope employs 3 NUV filters (, , ) and three optical filters (,,), and SNe are typically observed with all six filters at all epochs. Brown et al. (2009) presented photometry from the first 2.5 years of UVOT observations, 2243 total observations of 25 SNe. The photometry presented in Brown et al. (2009) was studied for light curve properties in Milne et al. 2010 (hereafter M10) and for absolute magnitudes in Brown et al. 2010 (hereafter B10). Among the findings reported in those works, it was shown that the color evolution of the UVOT- and NUV filters relative to the optical () band was both dramatic and relatively homogeneous within the sub-class of normal SNe Ia.111We employ the definition of normal SNe Ia to be events with broad light curves peaks, and thus not “narrow-peaked” and being photometrically and spectroscopically normal, and thus not 02cx-like, 00cx-like, 08ha-like, etc.. The colors become rapidly bluer until 6 days pre-peak in the filter, then abruptly become redder from 20 days. There was a lone significant outlier to the color evolution, SN 2008Q, which featured a similar shape to the color evolution, offset to bluer NUV-optical colors at all early epochs. Screening 2008Q, the low-scatter suggested that the rest-frame band might be a useful filter for standard candle applications, since the rest-frame filter is a primary filter in standard candle studies. The absolute magnitudes of the peak magnitudes of the UVOT- light curves were able to be fit with a linear luminosity-width relation (LWR). The scatter about that band LWR was similar to what was seen in the and filters. The LWR for the filter had somewhat larger scatter and the and filters had large scatter, suggesting that the cosmological utilization of SNe Ia might only extend, at farthest, to the wavelength range sampled by the filter.222 and refer to “red-tail corrected” and filters. See B10 for details of the method used to try to account for contamination of those filters from longer wavelength emission.
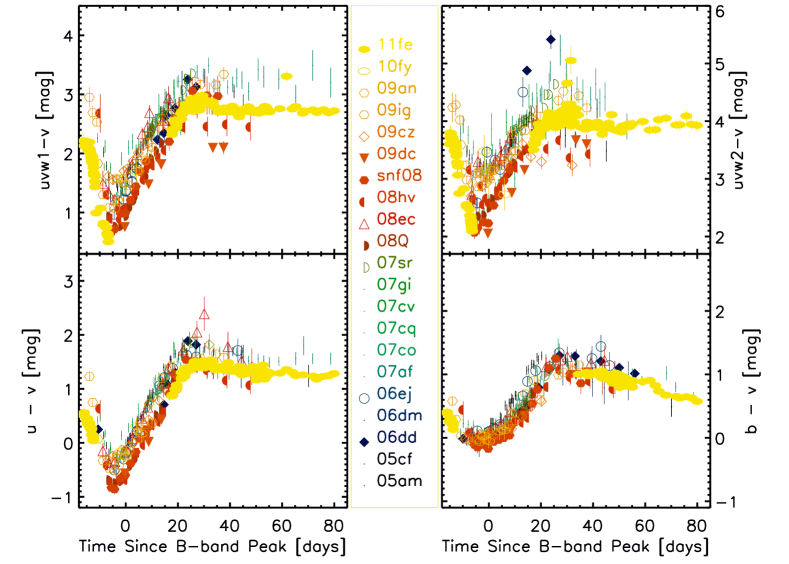
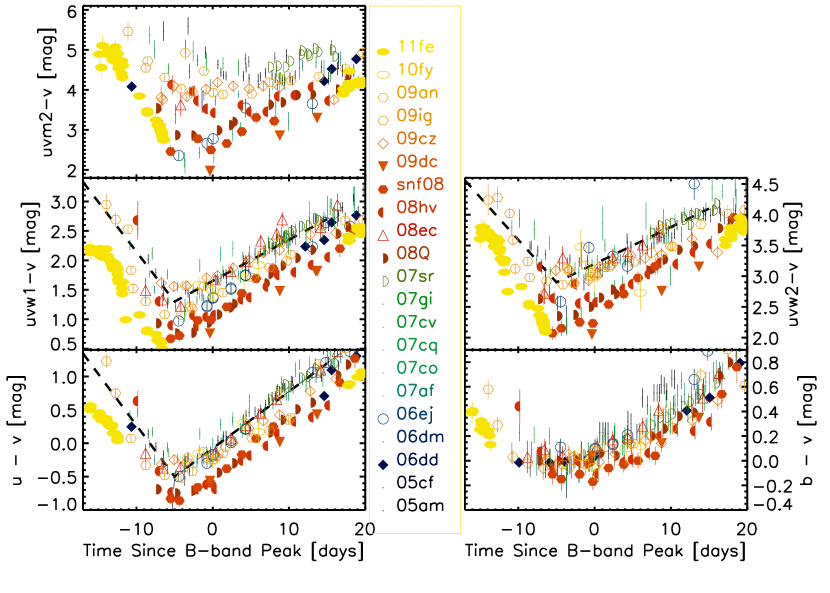
New SNe Ia have been observed since M10 and B10. In particular, more events were observed that featured colors similar to those seen in SN 2008Q. The colors curves for 21 normal SNe Ia for which template-subtracted photometry has been obtained, is shown in Figures 1 & 2, where Figure 2 is a zoomed in version of Figure 1. The basic features shown in M10 are present for this larger sample, with the added recognition that 6 of 21 SNe are bluer in the NUV- colors. The NUV-blue events appear to follow an evolution that is similar to the larger collection of NUV-red events, but for being offset by 0.4 magnitudes.
2 NUV Colors versus Unburned Carbon
The recognition that roughly one-third of the optically normal SNe Ia were appreciably bluer in the NUV- colors led to the obvious search for correlation with parameters derived from the optical observations such as the light curve peak-width (i.e. Phillips 1993), the blueshift of spectral features (i.e. HV/N, Wang et al. 2009), or time-variation of the blueshift of spectral features (i.e. HVG/LVG, Benetti et al. 2005), The Nearby Supernova Factory team, concentrating on the search for unburned carbon in the optical spectra, first recognized that all the UVOT SNe Ia that feature blue NUV-optical colors also had featured unburned carbon in the early-epoch spectra with SNe Ia (Thomas et al. 2011). This potential correlation presents an interesting opportunity to directly tie NUV emission to explosion physics, as detectable unburned carbon is possibly the signature of a burning front that fails farther from the surface than normal. The optical signature of unburned carbon becomes difficult to detect with epoch, typically disappearing before optical peak. If the NUV-blue/carbon correlation holds up, the NUV-optical colors might prove the best way to distinguish this variety of explosion.
Two other papers have been published that explore the search for unburned carbon features in optical spectra, the Parrent et al. (2011) analysis of archival SN spectra, and the Folatelli et al. (2011) analysis of Carnegie Supernova Project () spectra. The two papers increase the sample of events for which UVOT colors can be compared with the carbon search. Further, the paper quantified the time-evolution of the pseudo equivalent width of the carbon feature, which can eventually be used to improve from a binary, yes/no determination of the existence of carbon in future UVOT works (Milne et al., in preparation).
3 SN 2011fe and Iron-peak Nucleosynthesis
Swift UVOT observed SN 2011fe extensively, with observations being initiated by the Palomar Transient Factory upon recognition that there was a new supernova in M101 (Nugent et al. 2011). The UVOT observations provided solid constraints upon the explosion epoch of the SN, but perhaps more importantly upon early-epoch emission from the interaction of the SN shock with potential companion stars. That study concluded that a Main Sequence companion at a distance of a few solar radii experiencing Roche Lobe overflow was excluded at a 95% confidence level for realistic viewing angles (Brown et al. 2012). The UVOT campaign continues into 2012, allowing SN 2011fe to be compared with the other normal SNe Ia. Figures 1 & 2 show the color curves of SN 2011fe plotted with other normal, low-extinction SNe Ia. The SN 2011fe photometry employed special observing modes and reduction to account for coincidence loss, but the SN observations were still saturated near peak in the optical filters. This accounts for the gap in color curves in Figures 1 and 2. SN 2011fe is clearly of the NUV-blue category, and unburned carbon has been detected in the optical spectra (Nugent et al. 2011). This is important to mention as the INTEGRAL campaign that was executed on SN 2011fe may provide the best detection of gamma-ray line emission in a SN Ia due to 56Ni decay products.333Preliminary analysis suggests only upper limits, both for 56Ni gamma-ray lines, Isern et al. 2011a, and for 56Co gamma-ray lines, Isern et al. 2011b. Wang et al. (2011) presented NUV and optical photometry and early-epoch spectra of four SNe Ia, utilizing HST and ground-based telescopes. One SN in that sample, SN 2004dt, was NUV-blue, permitting a spectroscopic study of a NUV-blue event. The spectra reveal an excess in the 2900–3500 wavelength range, when compared with spectra of the other SN Ia events. Emission in that wavelength range is typically atributed to the degree of absorption from iron-peak elements, so the NUV excess for the NUV-blue events might point to relatively little iron-peak absorption. If this is caused by a low abundance of iron-peak elements near the surface of the ejecta SN 2011fe might feature weaker gamma-ray line emission than might be seen in NUV-red events. It is important to point out that there are many alternative explanations for the NUV excess (see Wang et al. (2011)). This possibility will be interesting to explore as theoretical models attempt to explain the multi-wavelength evolution of the emission from this historic SN Ia event.
References
- [1] Benetti, S., et al. 2005, ApJ, 623, 1011
- [2] Brown, P.J., et al. 2009, AJ, 137, 4517
- [3] Brown, P.J., et al. 2010, AJ, 721, 1608
- [4] Brown, P.J., et al. 2011, ApJ submitted, astroph 1110.2538
- [5] Folatelli, G., et al. 2011, in press, astroph 1110.3789
- [6] Isern, J., et al. 2011a, ATEL, 3683
- [7] Isern, J., et al. 2011b, ATEL, 3822
- [8] Iwamoto, K., et al. 1999, ApJS, 125, 439
- [9] Nugent, P., et al. 2011, Nature, 480, 344
- [10] Milne, P.A., et al. 2010, AJ, 721, 1627
- [11] Parrent, J.T., et al. 2011, ApJ, 732, 30
- [12] Perlmutter, S., et al. 1999, ApJ, 517, 565
- [13] Phillips, M. M. 1993, ApJ, 413, L105
- [14] Riess, A. G., et al. 1998, AJ, 116, 1009
- [15] Thomas, R.C., et al. 2011, ApJ, 743, 27
- [16] Wang, X., et al. 2009, ApJ, 697, 380
- [17] Wang, X., et al. 2011, ApJ, in press, astroph 1110.5809