XMMU J0541.8-6659, a new supernova remnant
in the Large Magellanic Cloud††thanks: Based on observations with XMM-Newton, an ESA Science Mission with instruments and contributions directly funded by ESA Member states and the USA (NASA).
Abstract
Context. The high sensitivity of the XMM-Newton instrumentation offers the opportunity to study faint and extended sources in the Milky Way and nearby galaxies such as the Large Magellanic Cloud (LMC) in detail. The ROSAT PSPC survey of the LMC has revealed more than 700 X-ray sources, among which there are 46 supernova remnants (SNRs) and candidates.
Aims. We have observed the field around one of the most promising SNR candidates in the ROSAT PSPC catalogue, labelled [HP99] 456 with XMM-Newton, to determine its nature.
Methods. We investigated the XMM-Newton data along with new radio-continuum, near infrared and optical data. In particular, spectral and morphological studies of the X-ray and radio data were performed.
Results. The X-ray images obtained in different energy bands reveal two different structures. Below 1.0 keV the X-ray emission shows the shell-like morphology of an SNR with a diameter of 73 pc, one of the largest known in the LMC. For its thermal spectrum we estimate an electron temperature of (0.49 0.12) keV assuming non-equilibrium ionisation. The X-ray images above 1.0 keV reveal a less extended source within the SNR emission, located 1′ west of the centre of the SNR and coincident with bright point sources detected in radio-continuum. This hard component has an extent of 0.9′ (i.e. 13 pc at a distance of 50 kpc) and a non-thermal spectrum. The hard source coincides in position with the ROSAT source [HP99] 456 and shows an indication for substructure.
Conclusions. We firmly identify a new SNR in the LMC with a shell-like morphology and a thermal spectrum. Assuming the SNR to be in the Sedov phase yields an age of 23 kyr. We explore possible associations of the hard non-thermal emitting component with a pulsar wind nebula (PWN) or background active galactic nuclei (AGN).
Key Words.:
galaxies: Magellanic Clouds, ISM: supernova remnants1 Introduction
The study of supernova remnants (SNRs) is crucial for a complete understanding of the chemical composition and evolution of the ISM in a galaxy because of their energy and matter inputs into the interstellar medium (ISM). The sample of SNRs studied in our Galaxy is biased because of the high absorption in the Galactic disk. Therefore, observations of nearby galaxies allow us to perform unbiased population studies and constrain the physical properties of the sources in detail. It is thus also possible to better understand the evolution and structure of the ISM in the Milky Way.
Located at a distance of kpc to the Earth (Freedman et al.,, 2001; Macri et al.,, 2006), the Large Magellanic Cloud (LMC) offers the ideal laboratory for studying a large sample of different types of objects (such as SNRs) in greater detail than in any other galaxy. Since its first detection in X-rays (Mark et al.,, 1969), the LMC has been extensively observed, but the major step forward came from more than 200 observations in a field centred on the LMC, which have been performed with the ROSAT Position Sensitive Proportional Counter (PSPC) from 1990 to 1994. For a description of the ROSAT mission and PSPC detectors, see Trmper, (1982), Briel & Pfeffermann, (1986) and Pfeffermann et al., (1987). This survey revealed 758 sources (Haberl & Pietsch,, 1999, hereafter labelled HP99), among which 46 sources were classified as firmly identified SNRs or candidates.
Several SNRs in the LMC have been investigated using observations with ROSAT (Filipović et al.,, 1998; Williams et al.,, 1999), Chandra X-ray Observatory (Hughes et al.,, 2006; Seward et al.,, 2010) and XMM-Newton (Williams et al.,, 2004; Klimek et al.,, 2010; Crawford et al.,, 2010) satellites, allowing a more detailed view of their morphologies and spectra. Badenes et al., (2010) have studied the size distribution of the SNRs in the Magellanic Clouds (MCs), which has a maximum at 40 pc and may extend up to sizes of 100 pc. With an extent of over 100 pc, SNR 0450-70.9 and SNR 0506-6542 (DEM L 72) are among the largest SNRs detected in the LMC (Williams et al.,, 2004; Cajko et al.,, 2009; Desai et al.,, 2010; Klimek et al.,, 2010), which may be highly evolved (age up to 100 kyr). The size distribution of the MC SNRs as well as those in our Galaxy or the neaby spiral galaxy M 33 cannot be explained only by the Sedov expansion model for SNRs, but seems to be largely affected by the ambient ISM densities (Bandiera & Petruk,, 2010; Badenes et al.,, 2010, and references therein).
Furthermore, multi-frequency observations of several SNR candidates located in the LMC have enabled their firm identification based on morphological and spectral criteria (Bojičić et al.,, 2007; Crawford et al.,, 2010) and have revealed a strong correlation between the X-ray sources and the emission observed by the Magellanic Cloud Emission Line Survey (MCELS; Smith et al.,, 2000). Indeed, an enhancement of the [S ii] and H coincident with the X-ray emission can be observed in most cases. In particular, the ratio [S ii]/H is often higher than 0.4 (Levenson et al.,, 1995; Williams et al.,, 2004). However, several SNRs in the Magellanic Clouds such as SNR LMC J0528-6714 or/and SMC SNR J010505-722319 do not have any optical emission.
While the emission of the gas shocked by the shock waves of SNRs is mainly of thermal nature, there can also be a pulsar or a pulsar wind nebula (PWN) in a SNR, which produce non-thermal emission. Pulsars are rapidly rotating neutron stars characterised by short periods (up to a few 10 s) and high surface magnetic fields (Manchester et al.,, 2005). The dissipation of the rotational energy of pulsars via magnetised particle winds can be at the origin of PWNe (Gaensler & Slane,, 2006). A high percentage of PWNe known in our Galaxy have been detected in X-rays, and present a power-law spectra with a mean spectral index of = –1.8 0.6 (Kargaltsev & Pavlov,, 2008, 2010). Sensitive X-ray observations have enabled the detection of several PWNe and candidates within the Magellanic Clouds, with similar properties as PWNe in the Milky Way (Gaensler et al.,, 2003; Williams et al.,, 2005; Owen et al.,, 2011).
There are now over 50 well-established SNRs in the LMC (Badenes et al.,, 2010; Klimek et al.,, 2010, and references therein) and some additional 20 SNR candidates (Bozzetto et al., in prep., ). This would comprise one of the most complete samples of SNRs in external galaxies. Therefore, it is of prime interest to study LMC SNRs and compare them with SNRs in other galaxies such as M 33 (Long et al.,, 2010), M 83 (Dopita et al.,, 2010), the Small Magellanic Cloud (SMC; Filipović et al.,, 2005; Payne et al.,, 2007; Filipović et al.,, 2008) and our Galaxy (Stupar et al.,, 2008; Green,, 2009).
The SNR candidates in the ROSAT PSPC catalogue have been classified based on the X-ray spectrum and spatial extent. Additional comparison to radio data taken with the Molonglo Observatory Synthesis Telescope (MOST; =843 MHz; Turtle & Mills,, 1984) and with optical data of MCELS has shown that there are ROSAT PSPC sources with radio or optical counterparts indicative of an SNR but with a hard X-ray spectrum and therefore no typical SNR characteristics in X-rays. The source [HP99] 456 is one of the most promising new SNR candidates of this kind, with hard emission detected by ROSAT PSPC and a possible radio or optical counterpart. It has been recently re-investigated through new observations with XMM-Newton and the Australia Telescope Compact Array (ATCA; Hughes et al.,, 2007).
In this paper, we report on the results of the analysis of new XMM-Newton and ATCA follow-up observations of the source [HP99] 456. Section 2 presents the observations and analysis techniques. Results of the multi-frequency analyses are presented in Section 3. Section 4 presents the discussion on the SNR properties and on the different scenarios to explain the non-thermal emission. In particular, we explore a possible association of this second component with a PWN or an AGN. Conclusions are presented in Section 5.
2 Observations and data reduction
2.1 X-rays
The XMM-Newton satellite is an X-ray observatory operated by the European Space Agency (ESA). The source [HP99] 456 has been proposed for observations with XMM-Newton (Obs. Id. 0651880101, P.I. : M. Sasaki). This paper presents results of the X-ray analysis of a 20 ks observation obtained on this source.
The source [HP99] 456 has been observed on 2010 June 06 (from 04:18:56 to 09:52:50 UT) with the European Photon Imaging Camera (EPIC) in full-frame mode and thin filters. Using the EPIC MOS1, MOS2 and pn CCDs, it offers the opportunity to perform sensitive X-ray observations of a field of the sky of diameter of 30′. More detailed technical descriptions of the EPIC cameras are presented by Turner et al., (2001) and Strder et al., (2001).
The EPIC data were analysed with SAS v10.0.0111Science Analysis Software: http://xmm.esac.esa.int/sas/.. The exposure time, after removing periods of high background, is 11 ks. Pixels flagged as bad were not taken into account and screening on the patterns (from 0 to 12 for MOS; from 0 to 4 for pn), corresponding to the canonical set of valid X-ray events (calibrated on the ground) was applied for the image and spectral analyses. We performed source detection by using the SAS tasks eboxdetect and emldetect.
2.2 Radio-continuum
The field of [HP99] 456 was observed with the Australia Telescope Compact Array (ATCA) on 2010 November 29, with an array configuration 6C, at wavelengths of 3 and 6 cm (9000 and 5500 MHz), and a bandwidth of 2 GHz (ATCA project C2367). The observations were carried out in snap-shot mode, totalling about 1 hr of integration over a 12 hr period. PKS B1934-638 was used for flux and bandpass calibration and PKS 0530-727 was used for phase calibration. Standard calibration, editing and imaging techniques (Sault & Killeen,, 2011) were used. Large bandwidth multifrequency clean (Sault & Wieringa,, 1994) was used to deconvolve the image. We point out that interferometers such as the ATCA suffer from missing flux owing to the lack of short spacings, which significantly affects the overall detection of extended emission like that from SNRs.
2.3 Optical
The Magellanic Cloud Emission Line Survey (MCELS)222MCELS : http://www.ctio.noao.edu/mcels/ was carried out from the 0.6 m University of Michigan/CTIO Curtis Schmidt telescope, equipped with a SITE CCD, which gave a field of 1.35° at a scale of 2.4″ pixel-1 (Smith et al.,, 2006; Winkler et al., in prep, ). Both the LMC and SMC were mapped in narrow bands corresponding to H, [O iii] (=5007 Å), and [S ii] (=6716, 6731 Å), plus matched red and green continuum bands. All data were continuum subtracted, flux-calibrated and assembled into mosaic images (a small section of which is shown in Figure 6).
3 Data analysis
3.1 X-ray morphology
The morphological analysis was performed in three energy ranges : 0.2 – 1.0 keV (soft band), 1.0 – 2.0 keV (medium band), 2.0 – 4.5 keV (hard band). For each energy interval, exposure-corrected images were obtained using SAS tools using the following method.
First, X-ray data were cleaned using the selection procedure described in the previous section. We computed event images and exposure maps using the filtered dataset. Then we applied a mask to remove bad pixels from the three instruments. We divided each resulting event image by the corresponding exposure map and smoothed the resulting images with a Gaussian filter using asmooth. Finally, we added the event images from the different instruments for each energy band.
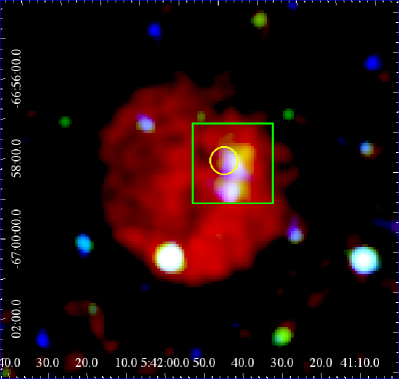
Figure 1 shows the RGB exposure-corrected image around the unidentified source [HP99] 456 obtained with the EPIC data in the three bands defined above (red: 0.2 – 1.0 keV; green : 1.0 – 2.0 keV; blue : 2.0 – 4.5 keV) after subtraction of the instrumental background (see caption). The emission seen in the hardest band is similar to the medium band. This morphological analysis reveals the existence of two distinct emitting regions:
-
1.
A soft emitting region: below 1.0 keV, the X-ray emission is dominated by a bright thermal (for more details, see Section 3.2) component. It presents a shell-like morphology with an extent of 5.0′ 4.6′.
-
2.
A hard emitting region: above 1.0 keV, the X-ray analysis reveals a less extended harder component. Its centre is located 1′ west from the centre of the soft shell-like emission and presents an elongated morphology of length 0.9′. The position is consistent with the ROSAT position of [HP99] 456.
The presence of the hard emitting region coincident with the ROSAT source suggests that [HP99] 456 is unrelated to the shell-like emission region. Therefore, we designated the soft, shell-like source XMMU J0541.8-6659 according to its approximate central coordinates. Additional details on the positions and extents of both emitting regions are summarised in Table 2. The count rates of the EPIC-pn observations are listed in the last column.
| R.M.S | Beam Size | STotal | Reference | ||
|---|---|---|---|---|---|
| (MHz) | (cm) | (mJy) | (″) | (mJy) | |
| 843 | 36 | 1.5 | 43.043.0 | 0.045 | Mills et al., (1984) |
| 1377 | 20 | 1.5 | 45.045.0 | 0.029 | Hughes et al., (2007) |
| 4800 | 6 | 0.6 | 30.030.0 | 0.008 | Dickel, (2005) |
| 8640 | 3 | 0.6 | 12.012.0 | 0.004 | Dickel, (2005) |
| 5500 | 6 | 0.1 | 2.82.2 | — | This Work |
| 9000 | 3 | 0.1 | 2.82.2 | — | This Work |
| Emitting | Ra | Dec | Size | Position angle | pn count rate |
|---|---|---|---|---|---|
| region | (hh:mm:ss.d) | (∘:′:″) | (′) | (∘) | (cts s-1) |
| Soft emission | 05:41:51.5 | -66:59:02.8 | 5.0 4.6 | –45 | (18 2) 10-2 |
| Hard emission | 05:41:39.4 | -66:58:45.8 | 0.9 0.45 | –15 | (2.8 0.3) 10-2 |
3.2 X-ray spectral analysis
The following sections present the results of the subsequent spectral analyses of the two spectral components mentioned above. We first describe the method used to estimate the contribution from the intrinsic detector and X-ray background for each emitting region. The spectral analysis was performed using the XSPEC v 12.6.0 package (Arnaud,, 1996; Dorman & Arnaud,, 2001).
Point sources that were detected using the method described in Section 2.1 were excluded from the spectral analysis.We used data between 0.3 keV and 5.0 keV because no significant emission is detected at higher energies.
3.2.1 Estimation of the instrumental background
We estimated the contribution from the intrinsic instrumental background using the filter wheel closed (FWC) data (Freyberg et al., 2001a, ; Freyberg et al., 2001b, ). The intrinsic background is composed of internal electronic noise as well as continuous and fluorescent X-ray emission induced by high-energy particles. This background is measured by operating the EPIC instruments in the “closed” filter wheel position, where no photons from astrophysical sources can be observed. The FWC spectrum needs to be renormalised using the continuum at higher energies.
3.2.2 Estimation of the X-ray background
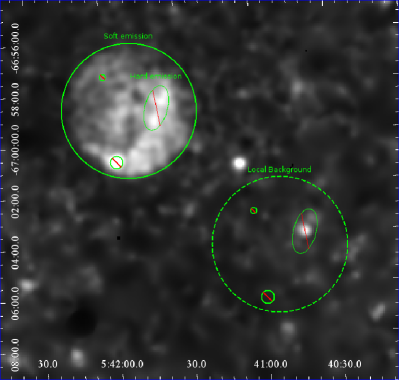
The contribution of the X-ray local background emission was derived from the same observation as the source itself. We defined a region located close to our source (see Figure 2), and extracted the spectrum from the observation and the FWC data. We estimated the renormalisation factor of the FWC spectrum with respect to the observed spectrum using the total count rates measured above 5 keV in the corners outside the field of view of the EPIC camera. The value of the renormalisation factor is 1.3.
The spectrum of the diffuse emission after subtracting the instrumental background can be modelled as a sum of the following three components:
-
•
a soft component, modelling the emission from the local bubble with a collisional plasma, non-equilibrium model (NEI; Borkowski et al.,, 1994, 2001; Hamilton et al.,, 1983; Liedahl et al.,, 1995)333For more details on XSPEC models, please see http://heasarc.nasa.gov/xanadu/xspec/manual/manual.html assuming a low temperature (0.1 keV);
-
•
a hard component modelled with an absorbed NEI model with a temperature of 0.3 keV, which stands for the emission from the Galactic halo;
-
•
an absorbed power-law of spectral index , to describe the extragalactic unresolved emission.
The parameters are fixed to values similar to those used by Kuntz & Snowden, (2010).
The two last components are convolved with a Tbingen-Boulder ISM absorption model (TBABS). The Galactic foreground hydrogen column density of cm-2 was derived from Stark et al., (1992) and was used for the absorption in the Galaxy.
| Parameter | Value |
|---|---|
| NH (1021 cm-2) in the Galaxy | 0.6 (fixed) |
| NH (1021 cm-2) in the LMC | 0 (fixed) |
| kT (keV) | 0.49 0.12 |
| Ionisation timescale* (s cm-3) | (1.5 0.7) 1010 |
| Absorbed flux (0.3 – 5.0 keV, erg/cm2/s) | |
| Absorbed luminosity (0.3 – 5.0 keV, erg/s) | |
| Unabsorbed luminosity (0.3 – 5.0 keV, erg/s) | |
| Reduced | 1.27 |
| Degrees of freedom | 86 |
| *: The ionisation timescale = ne t, where ne is the electron number | |
| density and t is the age of the gas. | |
3.2.3 Soft emission region
The X-ray emission below 1.0 keV is dominated by a structure presenting a shell-like morphology with a maximal diameter of 5.0′ and centred at RA(J2000) = 05h41m51.5s, DEC(J2000) = –66°59′03.8″. Photons located within the region corresponding to the hard X-ray emitting region, as defined in Table 2, were excluded from the source spectrum to avoid any contamination, as were detected point sources visible in Fig. 1.
The spectrum of the shell-like structure was obtained after the subtraction of the instrumental background. The X-ray background was estimated using a local background spectrum extracted from the same data. The source spectrum and the local background were modelled simultaneously in XSPEC by using a background model consisting of the components as explained in the previous section. All parameters of the three background components were fixed except the normalisations. The normalisations of the background components and the parameters of an additional model component for the shell emission were free fit parameters.
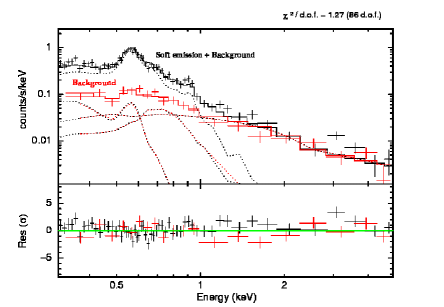
The spectral analysis of the soft circular emitting region reveals a thermal spectrum. It can be modelled with a single-temperature non-equilibrium ionisation collisional plasma model (VNEI; Borkowski et al.,, 1994, 2001; Hamilton et al.,, 1983; Liedahl et al.,, 1995) with a temperature of (0.49 0.12) keV with an absorption of NH = 0.6 1021 cm-2 for the Galactic foreground (with solar abundances) and a value of NH for the absorption in the LMC. The abundances were fixed to 0.5 of the solar system abundances for the emission and absorption taking place in the LMC. This value is the standard mean value for the LMC (Russell & Dopita,, 1992). The value of NH for the LMC turned out to tend towards 0 with an 90 % C.L. upper limit of 0.4 1021 cm-2. This parameter was therefore fixed to 0.
The resulting spectrum is presented in Fig. 3. The corresponding spectral parameters are given in Table 3.
3.2.4 Hard emission region
The X-ray emission above 1.0 keV is dominated by a narrow structure of length 0.9′ located 1′ to the west of the centroid of the shell-like thermal emission, as seen from Figure 1. Above 1.0 keV, the hard source has a surface brightness of 5.8 10-3 counts/s/arcmin2, i.e. 6 times the background level, which has a surface brightness of 9.4 10-4 counts/s/arcmin2. There is indication for substructure in the X-ray image, which could be caused by multiple sources. The ROSAT source [HP99] 456 coincides with the northern part of the narrow structure.
To analyse the spectrum of this second component again the instrumental background spectrum was subtracted and the X-ray spectrum was modelled simultaneously, this time using the surrounding shell-like emission as the local background. The normalisations of the component corresponding to the X-ray background components were renormalised to the area and were fitted, along with the spectral parameters of the hard emitting region.
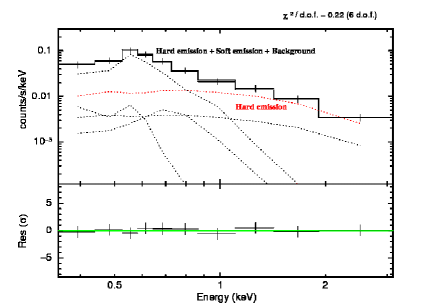
The spectrum of the hard emitting region is non-thermal and can be modelled in the 0.3 – 5.0 keV energy range with an absorbed power-law with a spectral index of , with an absorption of NH = 0.6 1021 cm-2 for the Galactic foreground (fixed, with solar abundances) and a value of NH for the absorption in the LMC of NH = (0.58 0.53) 1021 cm-2. This yields an absorbed flux of erg/cm2/s (reduced = 0.22 for 6 degrees of freedom). The resulting spectrum is shown in Fig. 4. In particular, the contribution from the hard X-ray emitting region is represented in red.
An alternative technique was used to derive the spectrum of the hard emitting region. Instead of using the FWC data, we extracted a background spectrum from a nearby region located within the shell and subtracted it from the source spectrum. This method yields consistent results for the hard emission.
3.3 Radio
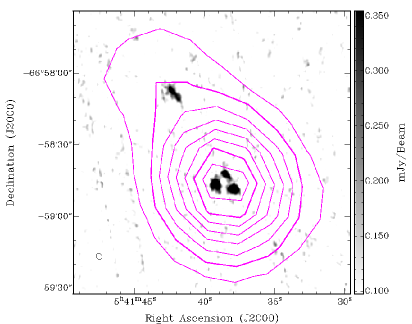
New high-resolution (2″) radio-continuum observations resolved low-resolution emission into three bright sources within the hard X-ray emitting region (Fig. 5). For comparison, the size of the radio image shown in Fig. 5 is represented in Fig. 1. In particular, three bright sources can be seen coinciding with the central position of this hard non-thermal X-ray emitting region. The brightest source (the most eastern one) has a spectral index of = –0.5 0.1 with integrated flux densities of (0.850.05) mJy at 5.5 GHz and (0.670.05) mJy at 9.0 GHz.
Our estimate of the SNR overall radio spectral index (excluding central point source; using ux densities from mosaic surveys only and listed in Table 1 i.e. observations from 843, 1377, 4800, 8640 MHz) is = –1.0 0.2, which is more typical for younger SNRs.
3.4 Optical
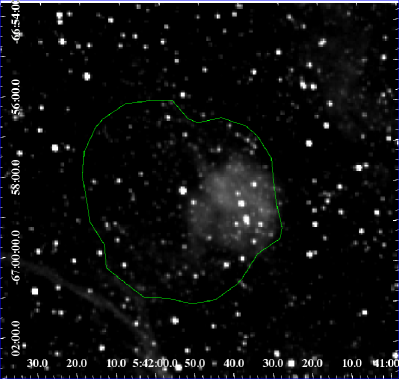
The emission from optical lines (H and [S ii]) derived from the MCELS were considered. The H emission in the surroundings of [HP99] 456 are presented in Fig. 6. This image shows a possible correlation between the western part of the shell-like X-ray thermal emission observed by XMM-Newton, the low-resolution radio-continuum and the H emission line, as seen in Figures 5 and 6. However, we acknowledge that this correlation could be a chance coincidence because the H “cloud” could be an unrelated Hii region.
Low-resolution radio-continuum images at 36, 20, 6 and 3 cm show good alignment with the optical (MCELS) feature and also coincide with the maximum emission from the X-rays.
Supernova remnants can show significant H, [S ii] and [O iii] line emission if they are in the radiative phase. In this case, the flux ratio [S ii]/H is a crucial parameter to distinguish between SNRs and e.g., Hii regions (Levenson et al.,, 1995). However, the [S ii]/H ratio around [HP99] 456 is 0.3, which is not necessarily indicative of SNR emission.
H emission is spatially coincident with the hard emitting region, but additional studies are required to determine if they are associated or not.
4 Discussion
Thanks to the high sensitivity of XMM-Newton, a recent observation of the field of [HP99] 456 has revealed the existence of two emitting components. The softer component presents a circular morphology and is firmly identified as a new SNR, designated XMMU J0541.8-6659. The nature of the emitting region with harder spectrum is still unclear, but we examined the possible identification as a PWN or a background AGN.
4.1 Properties of the newly identified SNR XMMU J0541.8-6659
X-ray data reveal a large structure of soft emission close to the ROSAT PSPC source [HP99] 456 in the LMC. Analyses performed in different energy ranges indicate that this source dominates the X-ray emission below 1.0 keV.
The spectrum of the SNR XMMU J0541.8-6659 can be modelled with an absorbed component representing a plasma in non-equilibrium ionisation characterised by a temperature of 0.49 keV, which is the average of the typical temperature of previously detected SNRs in the LMC. We note that the spectral parameters quoted in Table 3 are consistent with the parameters of the unambiguously identified SNRs in the LMC (Klimek et al.,, 2010; Levenson et al.,, 1995; Williams et al.,, 1999, 2004). It further supports the identification of this thermal emission with a SNR.
The soft emitting region is firmly identified as a new SNR, in view of its morphology and X-ray spectrum. It has a maximum diameter of 5.0′, which corresponds to a maximum extent of 73 pc at a distance of 50 kpc. Therefore, XMMU J0541.8-6659 is one of the largest SNR observed in the LMC (Williams et al.,, 1999; Klimek et al.,, 2010).
However, the large extent of the source does not necessarily imply an old age for the SNR. Indeed, assuming the SNR to be in the Sedov phase, the dynamic age of the source can be estimated using the shock temperature as follows :
| (1) |
where is the Boltzmann constant, is the temperature of the shock, which is comparable here to the plasma temperature estimated in Section 3.2.3, is the radius of the shock (in pc) and is the age of the SNR (in yr).
From the spectral fit yielding a plasma temperature of keV, we derived an age of 23 kyr. This value is well below the age of previous largely-extended SNRs detected in the LMC (e.g. Klimek et al.,, 2010; Williams et al.,, 2004).
This result means that the large extent of the source is not due to its high age, but rather to an expansion in a probably rarefied ambient medium. This is not surprising knowing the position of XMMU J0541.8-6659 at the north-east part of the LMC, where the gas density is quite low.
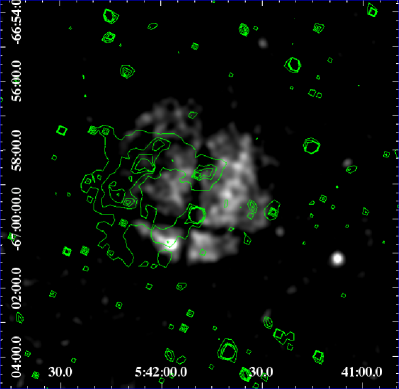
As a legacy project of the Spitzer Space Telescope, a survey of the Magellanic Clouds has been carried out called “Surveying the Agents of Galaxy Evolution” (SAGE)444Spitzer-SAGE: http://sage.stsci.edu/index.php (Meixner et al.,, 2006) to obtain images and spectra of the dust emission. A uniform survey of the LMC was performed in a 7∘ 7∘ by the Infrared Array Camera (IRAC, dedicated to near infrared observations at wavelength 3.6, 4.5, 5.8, and 8 m) and Multiband Imaging Photometer for Spitzer (MIPS, mid- and far-infrared observations at wavelengths 24, 70, and 160 m). The near-infrared emission (at 5.8 m) in the region surrounding the source [HP99] 456 is presented in Fig. 7. Spitzer-SAGE observations (Meixner et al.,, 2006) reveal dust emission spatially coincident with the eastern half of the shell-like soft emitting region. However, there is no clear indication that this dust emission is associated to the source XMMU J0541.8-6659.
4.2 Hard emission region: a PWN or background AGN?
Energy-dependent morphological studies of the X-ray emission in the surroundings of [HP99] 456 have revealed an extended elongated structure located within the SNR, which dominates the X-ray emission above 1.0 keV. Its centre is located 1′ from the centre of the SNR. This hard emission region has an apparent extent of 0.9′, corresponding to 13 pc at a distance of 50 kpc and a non-thermal spectrum. However, the angular resolution of XMM-Newton does not allow us to clarify if this hard source is indeed extended (with substructure) or if it is a conglomerate of point sources. A careful look at the ROSAT images reveals that the position of [HP99] 456 is consistent with the hard source detected with XMM-Newton and in particular with the more northern knot in the hard emission (see Fig. 1). Hence, a possible association between the soft and the hard components and the exact nature of the hard X-ray source remains unclear. The radio observations reveal several point sources at the position of the northern X-ray knot. This may point towards an identification as a pulsar with PWN. However, equivalently, one may argue for an existence of several background sources such as AGN. We investigate the different scenarios below.
Firstly, we examine the possibility that the hard X-ray emitting region is associated to background AGN. With a flux of erg cm-2 s-1 (0.5 – 2 keV), we expect to see 12 AGN per square degree in the sky (Rosati et al.,, 2002). We have an 8 % probability for an AGN inside a 5.0’x4.5’ SNR shell. This low probability and the non-detection of any similar morphological (jet-like) structure either in radio, IR or in optical renders an association of the hard X-ray component with an AGN quite unlikely.
It is worth noticing that the different values of absorption obtained during the spectral fit of the hard and soft emitting regions may indicate that they are located at different distances from us. While the absorption of the shell is consistent with the SNR being located in the LMC, the slightly higher absorption of the hard emission suggests that the source might be located behind the SNR.
Secondly, we consider the possible association of the hard X-ray component with a PWN. Three radio sources are embedded in the hard and narrow X-ray component. The brightest radio source presents a spectrum that can be modelled with a power-law of index which is consistent with spectra of pulsars. If this radio source is indeed a pulsar, then it might power a PWN that would be seen in the X-ray domain. Timing observations are required to confirm or invalidate this identification. Furthermore, it is worth noticing that with a spectral index of , the spectrum of the hard X-ray emitting source is similar to spectra of PWNe in the Milky Way (spectral indices ranging from –2.5 to –1.2; Kargaltsev & Pavlov,, 2008, 2010) but also typical for AGN.
The multi-frequency observations along with the spectral and morphological results of our X-ray and radio data analyses do not uniquely identify the nature of the hard X-ray emission embedded in the SNR XMMU J0541.8-6659. Deeper X-ray observations with higher angular resolution are required to differentiate between the two scenarios.
5 Conclusions
A recent X-ray observation with XMM-Newton of [HP99] 456 previously discovered by ROSAT led to the identification of a new SNR (XMMU J0541.8-6659) in the LMC, which presents a shell-like morphology and a soft thermal spectrum. No clear correlation can be found between the X-ray and optical emission. The physical properties (temperature, size, etc.) of this new SNR are consistent with SNRs previously identified in the LMC by X-ray observations (Levenson et al.,, 1995; Klimek et al.,, 2010; Williams et al.,, 1999, 2004).
Additional analyses of the XMM-Newton data have revealed a harder and narrower emitting region within the shell, which may be a PWN or background AGN. This emission is likely the counterpart of the hard source discovered by ROSAT. Follow-up observations with ATCA revealed several radio point sources coincident with the hard emitting region, one of which could be a pulsar. Deeper observations of the hard X-ray emitting region with the Chandra X-ray Observatory will help to distinguish between the different scenarios and to unveil its nature.
Acknowledgements
The XMM project is supported by the Bundesministerium fr Wirtschaft und Technologie/Deutsches Zentrum fr Luft- und Raumfahrt (BMWI/DLR, FKZ 50 OX 0001) and the Max-Planck Society.
The Australia Telescope Compact Array is part of the Australia Telescope, which is funded by the Commonwealth of Australia for operation as a National Facility managed by the CSIRO.
This work is based in part on observations made with the Spitzer Space Telescope, obtained from the NASA/IPAC Infrared Science Archive, both of which are operated by the Jet Propulsion Laboratory, California Institute of Technology under a contract with the National Aeronautics and Space Administration.
The Magellanic Clouds Emission Line Survey (MCELS) data are provided by R. C. Smith, P. F. Winkler, and S. D. Points. The MCELS project has been supported in part by NSF grants AST-9540747 and AST-0307613, and through the generous support of the Dean B. McLaughlin Fund at the University of Michigan, a bequest from the family of Dr. Dean B. McLaughlin in memory of his lasting impact on Astronomy. The National Optical Astronomy Observatory is operated by the Association of Universities for Research in Astronomy Inc. (AURA), under a cooperative agreement with the National Science Foundation.
M.-H. Grondin is supported by the BMBF/DLR grant #50-0R-1009.
References
- Arnaud, (1996) Arnaud, K.A., 1996, Astronomical Data Analysis Software and Systems V, eds. G. Jacoby and J. Barnes,p17, ASP Conf. Series, 101, 17
- Badenes et al., (2010) Badenes, C. , Maoz, D. & Draine, B. T., 2010, MNRAS, 407, 1301
- Bandiera & Petruk, (2010) Bandiera, R, & Petruk, O., 2010, A&A, 509, 34
- Bojičić et al., (2007) Bojičić, I. S., Filipović, M.D., Parker, Q. A., Payne, J. L., Jones, P. A., Reid, W., Kawamura, A. & Fukui, Y., 2007, MNRAS, 378, 1237
- Borkowski et al., (1994) Borkowski, K. J., Sarazin, C. L. & Blondin, J. M., 1994, ApJ, 429, 710
- Borkowski et al., (2001) Borkowski, K. J., Lyerly, W. J., & Reynolds, S. P., 2001, ApJ, 548, 820
- (7) Bozzetto, L. et al, 2011, A&A, in prep.
- Briel & Pfeffermann, (1986) Briel, U. G., Pfeffermann, E., 1986, Nuclear Instruments and Methods in Physics Research Section A, 242, 376
- Cajko et al., (2009) Cajko, K. O., Crawford, E. J. & Filipović, M. D., 2009, Serbian Astronomical Journal, 179, 55
- Crawford et al., (2010) Crawford, E. J., Filipović, M. D., Haberl, F., Pietsch, W., Payne, J. L. & de Horta, A. Y., 2010, A&A, 518, 35
- Desai et al., (2010) Desai, K. M., Chu, Y.-H., Gruendl, R. A., Dluger, W., Katz, M., Wong, T., Chen, C.-H. R., Looney, L. W., Hughes, A., Muller, E., Ott, J. & Pineda, J. L., 2010, Astron. J, 140, 584
- Dickel, (2005) Dickel, J. R., 2005, American Astronomical Society Meeting 207, 27, 1403
- Dopita et al., (2010) Dopita, M. A., Blair, W. P., Long, K. S., et al., 2010, ApJ, 710, 964
- Dorman & Arnaud, (2001) Dorman, B. & Arnaud, K. A., 2001, Astronomical Data Analysis Software and Systems X, eds. F.R. Harnden, Jr., F.A. Primini, & H. E. Payne, 238, 415
- Filipović et al., (1998) Filipović, M. D., Pietsch, W., Haynes, R. F., White, G. L., Jones, P. A., Wielebinski, R., Klein, U., Dennerl, K., Kahabka, P. & Lazendic, J. S., 1998, A&AS, 127, 119
- Filipović et al., (2005) Filipović, M. D., Payne, J. L., Reid, W., Danforth, C. W., Staveley-Smith, L., Jones, P. A. & White, G. L., 2005, MNRAS, 364, 217
- Filipović et al., (2008) Filipović, M. D., Haberl, F., Winkler, P. F., Pietsch, W., Payne, J. L., Crawford, E. J., de Horta, A. Y., Stootman, F. H. & Reaser, B. E., 2008, A&A, 485, 63
- Freedman et al., (2001) Freedman, W. L., Madore, B. F., Gibson, B. K., et al., 2001, ApJ, 553, 47
- (19) Freyberg, M. J., Pfeffermann, E. & Briel, U. G., 2001, Proc. Symposium ”New visions of the X-ray Universe in the XMM-Newton and Chandra era”, November 2001, ESTEC, Netherlands
- (20) Freyberg, M. J., Briel, U. G., Dennerl, J., Haberl, F., Hartner, G., Kendziorra, E. & Kirsch, M., 2001, Proc. Symposium ”New visions of the X-ray Universe in the XMM-Newton and Chandra era”, November 2001, ESTEC, Netherlands
- Gaensler et al., (2003) Gaensler, B. M., Hendrick, S. P., Reynolds, S. P., & Borkowski, K. J., 2003, ApJL, 594, 111
- Gaensler & Slane, (2006) Gaensler, B. M. & Slane, P. O., 2006, ARA&A, 44, 17
- Green, (2009) Green, D. A., 2009, Bulletin of the Astronomical Society of India, 37, 45
- Haberl & Pietsch, (1999) Haberl, F. & Pietsch, W., 1999, A&AS, 139, 277
- Hamilton et al., (1983) Hamilton, A. J. S., Sarazin, C. L. & Chevalier, R. A. , 1983, ApJS, 51,115
- Hughes et al., (2006) Hughes, J. P., Rafelski, M., Warren, J. S., Rakowski, C., Slane, P., Burrows, D. & Nousek, J., 2006, ApJL, 645, 117
- Hughes et al., (2007) Hughes, A., Staveley-Smith, L., Kim, S., Wolleben, M. & Filipović, M., 2007, MNRAS, 382, 543
- Kargaltsev & Pavlov, (2008) Kargaltsev, O. & Pavlov, G. G., 2008, AIPC, 983, 171
- Kargaltsev & Pavlov, (2010) Kargaltsev, O. & Pavlov, G. G., 2010, AIPC, 1248, 25
- Klimek et al., (2010) Klimek M. D., Points, S. D., Smith, R. C., Shelton, R. L. & Williams, R., 2010, ApJ, 725, 2281
- Kuntz & Snowden, (2010) Kuntz, K. D. & Snowden, S. L., 2010, ApJS, 188, 46
- Long et al., (2010) Long, K. S., Blair, W. P. & Winkler, P. F., 2010, ApJS, 187, 495
- Levenson et al., (1995) Levenson, N. A., Kischner, R. P., Blair, W. P. & Winkler, P. F., 1995, Astron. J, 110, 739
- Liedahl et al., (1995) Liedahl, D. A., Osterheld, A. L. & Goldstein, W. H., 1995, ApJ, 438, L11
- Macri et al., (2006) Macri, L. M., Stanek, K. Z., Bersier, D., Greenhill, L. J. & Reid, M. J., 2006, ApJ, 652, 1133
- Manchester et al., (2005) Manchester, R. N., Hobbs, G. B., Teoh, A., & Hobbs, M., 2005, Astron. J, 129, 1993
- Mark et al., (1969) Mark, H., Price, R., Rodrigues, R., Seward, F. D. & Swift, C. D., 1969, ApJ, 155, L143
- Meixner et al., (2006) Meixner, M. , Gordon, K. D., Indebetouw, R., et al., 2006, Astron. J, 132, 2268
- Mills et al., (1984) Mills, B. Y., Turtle, A. J., Little, A. G. & Durdin, J. M., 1984, Australian Journal of Physics, 37, 321
- Owen et al., (2011) Owen, R. A., Filipović, M. D., Ballet, J., et al., 2011, A&A, 530, 132
- Payne et al., (2007) Payne, J. L., White, G. L., Filipović, M. D. & Pannuti, T. G., 2007, MNRAS, 376, 1793
- Pfeffermann et al., (1987) Pfeffermann, E., Briel, U. G., Hippmann, H., et al., 1987, Soft X-ray optics and technology; Proceedings of the Meeting, Berlin, Berlin, Society of Photo-Optical Instrumentation Engineers, 733, 519
- Rosati et al., (2002) Rosati, P., Tozzi, P., Giacconi, R., et al., 2002, ApJ, 566, 667
- Russell & Dopita, (1992) Russell, S. C. & Dopita, M. A., 1992, ApJ, 384, 508
- Sault & Wieringa, (1994) Sault, R. J., & Wieringa, M. H. 1994, A&AS, 108, 585
- Sault & Killeen, (2011) Sault, B. & Killeen, N., 2011, Users Guide (Australia Telescope National Facility)
- Seward et al., (2010) Seward, F. D., Williams, R. M., Chu, Y.-H., Gruendl, R. A. & Dickel, J. R., 2010, Astron. J, 140, 177
- Smith et al., (2000) Smith, R. C., Leiton, R. & Pizarro, S., 2000, ASP Conference Proceedings, 221, 83
- Smith et al., (2006) Smith, R. C., Points, S., & Winkler, P. F., 2006, NOAO Newsletter, 85, 6
- Stark et al., (1992) Stark, A. A., Gammie, C. F., Wilson, R. W., Bally, J., Linke, R. A., Heiles, C. & Hurwitz, M., 1992, ApJ, 79, 77
- Strder et al., (2001) Strder, L., Briel, U., Dennerl, K., et al., 2001, A&A, 365, L18
- Stupar et al., (2008) Stupar, M., Parker, Q. A. & Filipović, M. D., 2008, MNRAS, 390, 1037
- Trmper, (1982) Trmper, J., 1982, Advances in Space Researches, 2, 241
- Turner et al., (2001) Turner, M. L. J., Abbey, A., Arnaud, M., et al., 2001, A&A, 365, L27
- Turtle & Mills, (1984) Turtle, A. J & Mills, B. Y., 1984, Astronomical Society of Australia, 5, 537
- Williams et al., (1999) Williams, R. M., Chu, Y.-H., Dickel, J. R., Petre, R., Smith, R. C. & Tavarez, M., 1999, ApJS, 123, 467
- Williams et al., (2004) Williams, R. M., Chu, Y.-H., Dickel, J. R., Gruendl, R. A., Shelton, R., Points, S. D. & Smith, R. C., 2004, ApJ, 613, 948
- Williams et al., (2005) Williams, R. M., Chu, Y., Dickel, J. R., et al. 2005, ApJ, 628, 704
- (59) Winkler, P. F. et al., 2011, in prep