On the search for quantum criticality in a ferromagnetic system UNi1-xCoxSi2
Abstract
Polycrystalline samples of the isostructural alloys UNi1-xCoxSi2 () were studied by means of x-ray powder diffraction, magnetization, electrical resistivity and specific heat measurements, at temperatures down to 2 K and in magnetic fields up to 5 T. The experimental data revealed an evolution from strongly anisotropic ferromagnetism with pronounced Kondo effect, observed for the alloys with and being gradually suppressed with rising Co-content, to spin-glass-like states with dominant spin fluctuations, seen for the sample with . Extrapolation of the value of yields a critical concentration , at which the magnetic ordering entirely disappears. This finding is in line with preliminary data collected for stoichiometric UCoSi2.
pacs:
75.40.-s; 71.27.+aI Introduction
Since a few years the unusual physical behaviors of -electron systems being at the verge of magnetic ordering have been at the very forefront of modern condensed matter physics [Stewart, 2001, 2006; Coleman and Schofield, 2005; v. Löhneysen et al., 2007; Gegenwart et al., 2008]. The so-called quantum phase transition (QPT) occurs at the absolute zero temperature and is driven by quantum fluctuations, instead of thermal fluctuations associated with phase transitions at finite temperatures. If such a transition has a continuous (2nd order) character one speaks about a quantum critical point (QCP).
Most of the hitherto performed experimental studies on the quantum criticality (independently of the theoretical scenarios considered) were devoted to numerous non-stoichiometric alloys and stoichiometric compounds based on cerium, ytterbium or uranium, which exhibit antiferromagnetic correlations [Stewart, 2001, 2006]. Ferromagnetic quantum phase transitions are much less known both from the theoretical and experimental point of views [Stewart, 2001, 2006; Kirkpatrick and Belitz, 2003]. Therefore, it is particularly tempting to investigate systems in which ferromagnetism can be tuned down to the absolute zero temperature by external parameters, like pressure, magnetic field or/and composition. Amidst very rare examples of alloys, in which ferromagnetism gets suppressed (or induced) by chemical doping, one can mention i.a. UxTh1-xCu2Si2 [Lenkewitz et al., 1997], NixPd1-x [Nicklas et al., 1999], CePd1-xNix [Kappler et al., 1997], CePd1-xRhx [Sereni et al., 2007; Pikul et al., 2006; Westerkamp et al., 2009], URu2-xRexSi2 [Bauer et al., 2005], URh1-xRuxGe [Huy et al., 2007a] and UCoGe1-xSix [de Nijs et al., 2008]. The number of stoichiometric compounds for which the presence of pressure-induced ferromagnetic QPT has been demonstrated is extremely small, with the most prominent examples being UGe2 [Saxena et al., 2000], URhGe [Aoki et al., 2001], UCoGe [Huy et al., 2007b]. Remarkably, up to date the only stoichiometric ferromagnet claimed to exhibit a second-order quantum phase transition seems CePt [J. Larrea et al., 2005].
The ternary uranium silicides UTSi2 (T = Fe, Co, Ni), crystallizing with the orthorhombic CeNiSi2-type crystal structure, were reported to span a variety of magnetic properties driven by the hybridization between U - and T -electronic states. Whereas UNiSi2 is a ferromagnetically ordered ( = 95 K) Kondo lattice with relatively well localized -electrons [Kaczorowski, 1996; Taniguchi et al., 1998; Das et al., 2000], UCoSi2 behaves as a spin fluctuation system, and UFe1-ySi2 shows features of a weakly temperature dependent Pauli paramagnet [Kaczorowski, 1996]. The previous findings motivated us to undertake a detailed study on the solid solution UNi1-xCoxSi2 (), with the main focus on the alloys being close to a ferromagnetic instability, expected to occur for a certain Co-content . Our first attempt was to check for a possible non-Fermi-liquid character of the dc magnetic susceptibility, electrical resistivity and heat capacity of the specimens having nearly critical composition. The aim of this paper is to show that the ferromagnetic behavior in UNi1-xCoxSi2 is observed in a nearly complete solution range and that the critical concentration is fairly close to 1. In other words, our experimental data point at possible ferromagnetic quantum critical behavior in stoichiometric UCoSi2.
II Experimental details
Polycrystalline samples of the solid solutions UNi1-xCoxSi2 () were synthesized by conventional arc melting the nominal amounts of the constituents under protective atmosphere of an argon glove box. The pellets were subsequently wrapped in a tantalum foil, sealed in evacuated silica tubes, and annealed at 800∘C for 2 weeks. Quality of the products was verified by means of x-ray powder diffraction measurements (X’pert Pro PANalytical diffractometer with Cu K radiation; = 1.54056 Å). Magnetic properties were studied at temperatures ranging from 1.7 up to room temperature and in applied magnetic fields up to 5 T, using a Quantum Design SQUID (superconducting quantum interference device) magnetometer and a Cryogenics AC susceptometer. The electrical resistivity was measured down to 4.2 K in zero magnetic field using a standard DC four-point probe method implemented in a home-made setup, on bar-shaped specimens with spot-welded electrical contacts. Heat capacity studies were carried out at temperatures 2 K – 300 K and in applied magnetic fields up to 9 T employing a thermal relaxation technique implemented in a Quantum Design PPMS (Physical Property Measurement System).
III Results and discussion
III.1 Crystal structure
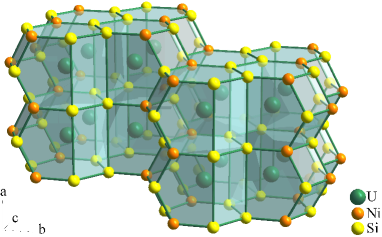
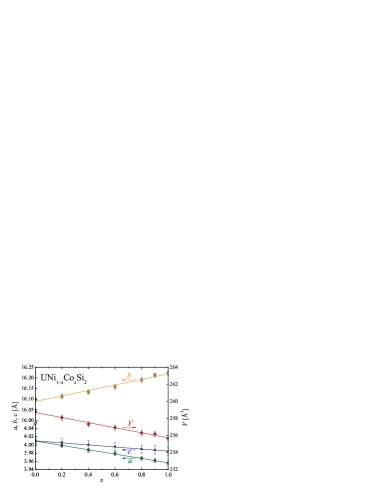
Analysis of the experimental x-ray powder diffraction patterns obtained for the alloys UNi1-xCoxSi2 (not shown here) revealed that all the specimens used in the present study were nearly single phases with very small amount (less than 5%) of same unidentified impurity phase. Rietveld refinements confirmed that the entire system crystallizes with the orthorhombic () CeNiSi2-type structure [Fig. 1(a)]. The lattice parameters derived for UNiSi2 ( = 4.006 Å, = 16.070 Å and = 4.002 Å) are in good agreement with the literature data [Kaczorowski, 1996]. As can be inferred from Fig. 1(b), the isostructural, partial substitution of Ni atoms by about 0.8% larger Co atoms expands linearly the unit cell along the axis (in total by %) yet reduces it along the and axes (in total by % and %, respectively), leading eventually to the contraction in the unit cell volume of the system by about %. The lattice parameters of the terminal compound UCoSi2 were found to be equal to = 3.956 Å, = 16.223 Å and = 3.984 Å, being close to those reported previously [Kaczorowski, 1996].
III.2 Magnetic properties
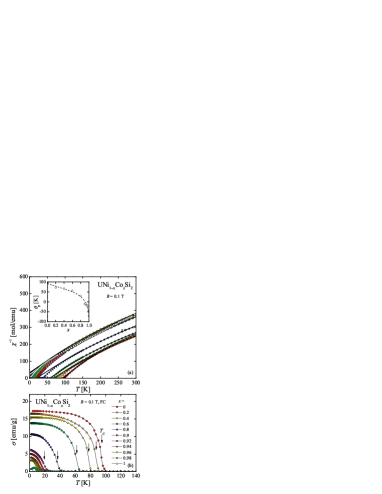
Figure 2(a) presents the inverse molar magnetic susceptibility of the alloys UNi1-xCoxSi2 () as a function of temperature . As seen, above about 150 K all the experimental curves exhibit quasi-linear behavior that can be described by the modified Curie–Weiss law:
| (1) |
where is the effective magnetic moment, is the paramagnetic Weiss temperature, and is a temperature independent term accounting for Pauli paramagnetism of the conduction electrons and diamagnetism of the core electrons. Least squares fits of Eq. (1) to the experimental data [see the solid lines in Fig. 2(a)] yielded for each UNi1-xCoxSi2 compound a value of and emu/mol. In turn, was found to decrease monotonically from 95 K in UNiSi2 to K in UCoSi2 [see the inset to Fig. 2(a)]. The experimental value of is moderately reduced in comparison to the theoretical one, calculated for free U3+ (3.62 ) or U4+ (3.58 ) ions, and is somewhat larger than usually observed in conventional metals. It suggests that the uranium electrons in UNi1-xCoxSi2 are partly delocalized, as commonly observed in U-based intermetallics. Because and hardly changes upon increasing one can conclude, that the degree of delocalization of the electrons in this system remains unaffected by the Ni/Co substitution. In turn, the decreasing positive can be ascribed to weakening of an inter-site ferromagnetic coupling between the uranium magnetic moments. For large it becomes obscured by a negative contribution most likely due to strong electronic correlations or an inter-site antiferromagnetic coupling.
Figure 2(b) displays the temperature dependencies of the magnetization of UNi1-xCoxSi2. The characteristic Brillouin-shaped anomalies on indicate the ferromagnetic ordering in the alloys with . Upon increasing the Co content, the Curie temperature decreases from 95 K in UNiSi2 (in agreement with the literature data [Kaczorowski, 1996]) down to 8.6 K in UNi0.04Co0.96Si2. Simultaneously, the magnitude of the magnetization notably decreases. Eventually, for , the ferromagnetic anomaly evolves into a broad maximum of unclear origin, while in pure UCoSi2 no anomaly in is observed down to 1.7 K.
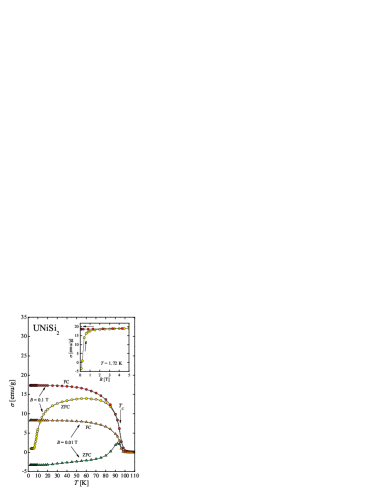
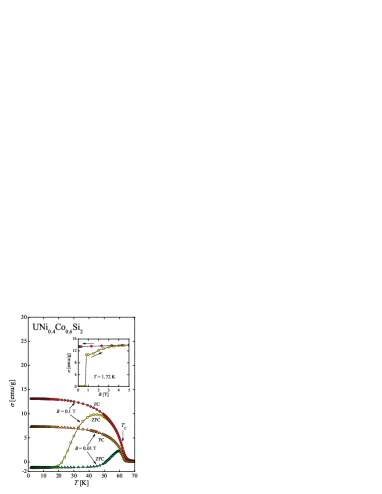
The results of detailed investigations of the magnetic properties of two representative compositions from the range , namely UNiSi2 and UNi0.4Co0.6Si2, are displayed in Figs. 3 and 4, respectively. For both compounds measured in zero-field-cooled and field-cooled regimes shows a pronounced bifurcation below the Curie temperature, characteristic of strongly anisotropic ferromagnets with pronounced domain effects. The negative values of the ZFC magnetization result most likely from the presence of remnant magnetic field, hardly avoidable in experiments performed using standard superconducting magnets. The overall shape of the isothermal field dependence of the magnetization measured deeply in the ordered state [see the insets to Figs. 3 and 4] provides another strong evidence for the ferromagnetic ground state in UNiSi2 and UNi0.4Co0.6Si2. In particular, in low magnetic fields the magnetization rapidly increases with and saturates at high fields, reaching at = 5 T a value corresponding to about 1.2 (UNiSi2) and 0.9 (UNi0.4Co0.6Si2). Remarkably, the two curves exhibit strongly hysteretic behavior and very high remanence of about 19 (for ) and 13.5 emu/g (for ), both features being characteristic of hard ferromagnets. The magnetic properties of the other alloys UNi1-xCoxSi2 from the range are qualitatively very similar to those of UNiSi2 and UNi0.4Co0.6Si2, yet the hysteresis and the saturated moment both gradually diminish with increasing .
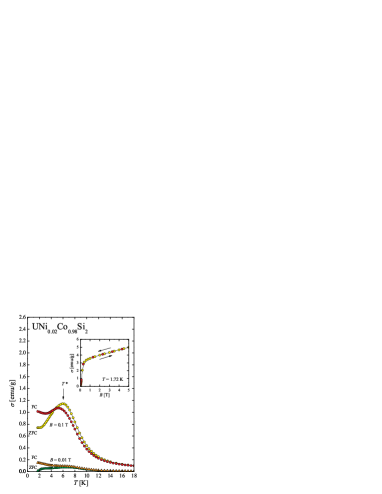
Figure 5 presents the magnetic properties of UNi0.02Co0.98Si2. Apparently, the overall shape of the FC curve measured for this composition is much different from that observed for the ferromagnetically ordered alloys (i.e. with ). In particular, the Brillouin-like curvature is not seen, and instead the curve forms a broad maximum at about 6 K. Moreover, the magnitude of the magnetization of UNi0.02Co0.98Si2 is almost 20 times smaller than the value measured for the parent compound UNiSi2 [Fig. 3], the hysteresis in [see the inset to Fig. 5] is hardly visible, and does not saturate in high fields. All these features indicate a change in the character of the magnetic ordering from the long-range ferromagnetic one for to a spin-glass-like state for , probably governed by an interplay of competing ferromagnetic and antiferromagnetic interactions.
In agrement with the previous report [Kaczorowski, 1996], the terminal alloy UCoSi2 is a Curie-Weiss paramagnet down to the lowest temperature studied (cf. Fig. 2). Accordingly, its magnetization does not exhibit any hysteresis effect neither in the field nor the temperature dependence (not shown here).
III.3 Electrical resistivity

Temperature dependencies of the electrical resistivity of the UNi1-xCoxSi2 alloys are plotted in Fig. 6. In the paramagnetic region, the electrical resistivity of the alloys with increases with decreasing temperature. Upon further substitution of Ni atoms by Co atoms, the curve changes its slope into a positive one in the entire temperature range studied.
At low temperatures, pronounced drops of the resistivity manifest the ferromagnetic phase transitions in the alloys with . Positions of the anomalies in , defined as inflection points in (cf. Fig. 7), correspond to the Curie temperatures estimated from the magnetization data [cf. Fig. 2(b)]. For the Co-rich alloys UNi0.04Co0.96Si2 ( = 8.6 K) and UNi0.02Co0.98Si2 ( = 6 K), the phase transitions are hardly visible in the resistivity data.
The increase of the resistivity with decreasing , that is observed for in the paramagnetic region, may result from the spin-flip Kondo scattering the conduction electrons on magnetic moments of the uranium atoms. Indeed, the experimental data can be described above by the formula [Kaczorowski, 1996]:
| (2) |
where the first term stands for temperature independent scattering the conduction electrons on static defects and disordered magnetic moments, and the second one describes the Kondo effect. Solid lines in Fig. 7 display the results of the least-square fits for UNiSi2 [ = 319.6(1) cm, = 52.6(1) cm] and UNi0.4Co0.6Si2 [ = 396.2(1) cm, = 16.9(1) cm]. The values of the fitting parameters for UNiSi2 are of the same order as hose given in Ref. Kaczorowski, 1996. The observed decrease in the value of on going from UNiSi2 to UNi0.4Co0.6Si2 manifests suppression of the Kondo effect in the system with increasing , in line with the observed evolution of towards strongly bent metallic-like dependence found for the Co-rich samples.
In the ordered region, the resistivity of both alloys is dominated by the contributions due to scattering the conduction electrons on ferromagnetic spin waves [Kaczorowski, 1996]:
| (3) |
where is the residual resistivity, is a gap in the spin-waves spectrum, and is a coefficient of proportionality. Fits of Eq. (3) to the experimental data below about yielded the values = 13.9 cm, = 0.06(1) cm/K2 and = 87(1) K for UNiSi2, and = 201.8 cm, = 0.05(1) cm/K2 and = 15(1) K for UNi0.4Co0.6Si2 (see the dashed lines in Fig. 7). The values obtained for UNiSi2 somewhat differ from those reported in Ref. Kaczorowski, 1996, most probably due to distinctly different ranges of the data analysis.
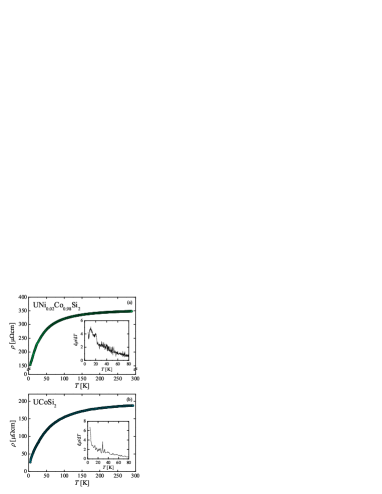
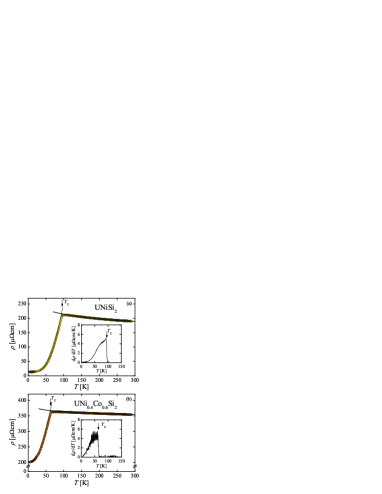
Figure 8 presents the temperature dependencies of the electrical resistivity of the Co-rich sample UNi0.02Co0.98Si2 and the terminal compound UCoSi2. As seen, the overall shapes of these two curves are reminiscent of metallic systems with strong spin fluctuations, like e.g. Np, Pu, or UAl2. Both and the derivative calculated for UCoSi2 are featureless down to the lowest temperatures studied. Also for UNi0.02Co0.98Si2 no anomaly in the electrical transport is seen, which could be associated with the feature at revealed in the magnetic susceptibility data (broad and blurred extremum observed in is likely due to experimental noise).
III.4 Specific heat
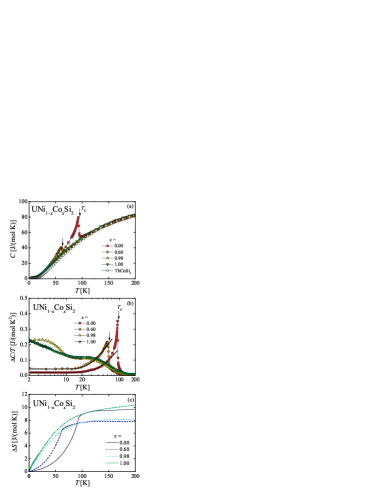
Figure 9(a) presents the temperature variations of the specific heat of selected UNi1-xCoxSi2 alloys and their isostructural phonon counterpart ThCoSi2. Above about 110 K, the heat capacity data obtained for each alloy overlap the curve of the latter compound, indicating that in this temperature range the possible Schottky contribution due to crystal electric field is negligibly small in comparison to the total specific heat measured. Presence of a distinct -shaped peak in at confirms bulk character of the long-range ferromagnetic ordering in UNiSi2. For UNi0.40Co0.60Si2 the magnetic anomaly is still clearly visible, yet it is significantly smaller and somewhat broader. In contrast, in the C(T) data of the Co-richest alloy UNi0.02Co0.98Si2 hardly any singularity is seen. The encountered evolution of the -peak is entirely in line with the suppression of the ferromagnetic order in UNi1-xCoxSi2 observed in the and characteristics.
Figure 9(b) displays the temperature dependencies of the excess specific heat due to -electrons divided by , obtained for a few UNi1-xCoxSi2 subtracting the data of nonmagnetic ThCoSi2 from the heat capacity of these alloys. The specific heat of the ferromagnetically ordered compounds can be described below about by the formula developed for thermally excited ferromagnetic magnons (cf. Ref. Gopal, 1966):
| (4) |
where is the Sommerfeld coefficient due to partly delocalized -electrons of uranium, stands for the gap in the spin-wave spectrum, and is a coefficient of proportionality. Least squares fits of Eq. (4) to the experimental data yielded for UNiSi2: = 20(1) mJ/(molK2), = 36(1) mJ/(molK4) and = 81(1) K, and for UNi0.40Co0.60Si2: = 42(1) mJ/(molK2), = 50(1) mJ/(molK4) and = 54(1) K.
As can be inferred from Fig. 9(b), in the derived for UNi0.02Co0.98Si2 there is no -shaped anomaly, and only a broad hump occurs in the vicinity of = 6 K, i.e. near the temperature of the anomaly evidenced in the magnetization curve [compare Fig. 2(b)]. Consequently, this feature in the specific heat data might be interpreted as a result of short range magnetic ordering or spin-glass state formation.
Another interesting feature, well visible in the specific heat of UNi0.02Co0.98Si2, is a broad maximum located at about 30 K [Fig. 9(b)]. Similar anomaly is present also in pure UCoSi2 [Fig. 9(b)] and in Th-doped UCoSi2. Preliminary results obtained for the latter alloys (to be published elsewhere) show that the position of this anomaly is independent of Th-content, yet its magnitude scales with the dilution of the uranium sublattice. This finding clearly indicates a single-ion character of the hump, which probably results from splitting the the multiplet in crystalline-electric-field potential. Closer look at the data allows to recognize some faint features at 30 K also in UNiSi2 and UNi0.40Co0.60Si2 [Fig. 9(b)], being in line with the latter hypothesis. However, the Schottky contribution is here largely obscured by the magnetic contribution due to the ferromagnetic ordering.
Figure 9(c) displays the temperature dependencies of the increase in the magnetic entropy , defined as:
| (5) |
where is the lower temperature limit in our experiments. As seen, in UNi1-xCoxSi2 increases with increasing temperature up to about 100 K and then saturates at about 9 J/(mol K). The latter value is close to (where is the universal gas constant), which is expected for a thermally populated triplet or pseudotriplet. Assuming that the system studied has a magnetic doublet as a ground state, the first excited level is a singlet, lying about 100 K above the ground level. Negligible increase of above 100 K suggests that the next excited CEF level (of unknown degeneracy) lies well above 300 K. Similar magnitude of CEF splitting is often observed in U-based systems.
The enlarged electronic contribution to the specific heat of UNiSi2 and UNi0.40Co0.60Si2 is a fingerprint of strong electronic correlations. Based on the value of the coefficient both materials can be qualified as moderately-enhanced Fermi liquids. Upon further increasing the Co-content the low-temperature heat capacity evolves into dependence, especially well resolved in UCoSi2, characteristic of non-Fermi liquid systems.
IV Summary
The presented experimental data revealed that the ferromagnetism and pronounced Kondo effect, observed in UNiSi2, is gradually suppressed upon stepwise substitution of Ni by Co. While in the UNi1-xCoxSi2 alloys with the phase transition exhibits clearly the ferromagnetic character, in the sample with a spin-glass-like state with dominant spin fluctuations is seen. Whether any short-range order occurs in UCoSi2 below 2 K, remains an open question.
Since the change of the unit cell volume of the system UNi1-xCoxSi2 is relatively small and has different sign along the main crystallographic axes, the partial Ni/Co substitution cannot be treated as an approximation of hydrostatic pressure. Also the magnetic sublattice of uranium ions remains unaltered in the presented experiments. Therefore, the observed evolution of the physical properties of UNi1-xCoxSi2 results most probably from electron doping, because the electron configurations of nickel and cobalt differ from each other by one electron on the shell.
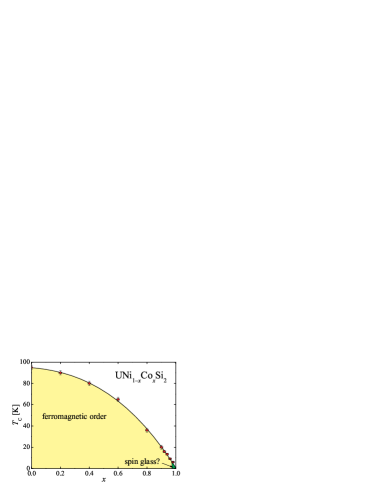
Most interestingly, the extrapolation of the curve to (Fig. 10) suggests the stoichiometric UCoSi2 compound to be near the ferromagnetic quantum phase transition. Further experiments, performed at mK temperature range on single crystalline samples of UCoSi2, are needed to verify the latter hypothesis. In this context, particularly tempting seems a conjecture on the presence in UCoSi2 of quantum critical point governed by ferromagnetic fluctuations and exclusion of the possibility of a rapid change of the character of the correlations in the alloys with .
Acknowledgements.
This work was supported by the Polish Ministry of Science and Higher Education within grant no. N N202 102338.References
- Stewart (2001) G. R. Stewart, Rev. Mod. Phys. 73, 797 (2001).
- Stewart (2006) G. R. Stewart, Rev. Mod. Phys. 78, 743 (2006).
- Coleman and Schofield (2005) P. Coleman and A. J. Schofield, Nature 433, 226 (2005).
- v. Löhneysen et al. (2007) H. v. Löhneysen, A. Rosch, M. Vojta, and P. Wölfle, Rev. Mod. Phys. 79, 1015 (2007).
- Gegenwart et al. (2008) P. Gegenwart, Q. Si, and F. Steglich, Nature Physics 4, 186 (2008).
- Kirkpatrick and Belitz (2003) T. R. Kirkpatrick and D. Belitz, Phys. Rev. B 67, 024419 (2003).
- Lenkewitz et al. (1997) M. Lenkewitz, S. Corsépius, G.-F. v. Blanckenhagen, and G. R. Stewart, Phys. Rev. B 55, 6409 (1997).
- Nicklas et al. (1999) M. Nicklas, M. Brando, G. Knebel, F. Mayr, W. Trinkl, and A. Loidl, Phys. Rev. Lett. 82, 4268 (1999).
- Kappler et al. (1997) J.-P. Kappler, M. J. Besnus, P. Haen, and J. Sereni, Physica B 230–232, 162 (1997).
- Sereni et al. (2007) J. G. Sereni, T. Westerkamp, R. Küchler, N. Caroca-Canales, P. Gegenwart, and C. Geibel, Phys. Rev. B 75, 024432 (2007).
- Pikul et al. (2006) A. P. Pikul, N. Caroca-Canales, M. Deppe, P. Gegenwart, J. G. Sereni, C. Geibel, and F. Steglich, J. Phys.: Condens. Matter 18, L535 (2006).
- Westerkamp et al. (2009) T. Westerkamp, M. Deppe, R. Küchler, M. Brando, C. Geibel, P. Gegenwart, A. P. Pikul, and F. Steglich, Phys. Rev. Lett. 102, 206404 (2009).
- Bauer et al. (2005) E. D. Bauer, V. S. Zapf, P.-C. Ho, N. P. Butch, E. J. Freeman, C. Sirvent, and M. B. Maple, Phys. Rev. Lett. 94, 046401 (2005).
- Huy et al. (2007a) N. T. Huy, A. Gasparini, J. C. P. Klaasse, A. de Visser, S. Sakarya, and N. H. van Dijk, Phys. Rev. B 75, 212405 (2007a).
- de Nijs et al. (2008) D. E. de Nijs, N. T. Huy, and A. D. Visser, Phys. Rev. B 77, 140506 (2008).
- Saxena et al. (2000) S. S. Saxena, P. Agarwal, K. Ahilan, F. M. Grosche, R. K. W. Haselwimmer, M. J. Steiner, E. Pugh, I. R. Walker, S. R. Julian, P. Monthoux, et al., Nature 406, 587 (2000).
- Aoki et al. (2001) D. Aoki, A. Huxley, E. Ressouche, D. Braithwaite, J. Flouquet, J.-P. Brison, E. Lhotel, and C. Paulsen, Nature 413, 613 (2001).
- Huy et al. (2007b) N. T. Huy, A. Gasparini, D. E. de Nijs, Y. Huang, J. C. P. Klaasse, T. Gortenmulder, A. de Visser, A. Hamann, T. Görlach, and H. v. Löhneysen, Phys. Rev. Lett. 99, 067006 (2007b).
- J. Larrea et al. (2005) J. Larrea J., M. B. Fontes, A. D. Alvarenga, E. M. Baggio-Saitovitch, T. Burghardt, A. Eichler, and M. A. Continentino, Phys. Rev. B 72, 035129 (2005).
- Kaczorowski (1996) D. Kaczorowski, Solid State Commun. 99, 949 (1996).
- Taniguchi et al. (1998) T. Taniguchi, H. Morimoto, Y. Miyako, and S. Ramakrishnan, J. Magn. Magn. Mater. 177–181, 55 (1998).
- Das et al. (2000) A. Das, S. K. Paranjpe, P. Raj, A. Satyamoorthy, K. Shashikala, and S. K. Malik, Solid State Commun. 114, 87 (2000).
- Gopal (1966) E. S. R. Gopal, Specific Heats at Low Temperatures (Plenum Press, New York, 1966).