20xx Vol. 9 No. XX, 000–000
Discovery of Balmer Broad Absorption Lines in the Quasar LBQS 1206+1052
Abstract
We report the discovery of Balmer broad absorption lines (BALs) in the quasar LBQS 1206+1052 and present a detailed analysis of the peculiar absorption line spectrum. Besides Mg II doublet, BALs are also detected in He I* multiplet at Å arising from metastable helium level, and in H and H from excited hydrogen H I* level, which are rarely seen in quasar spectra. We identify two components in the BAL troughs of 2000 km s-1 width: One component shows an identical profile in H I*, He I* and Mg II with its centroid blueshifted by km s-1. The other component is detected in He I* and Mg II with km s-1. We estimate the column densities of H I*, He I*, and Mg II, and compare them with possible level population mechanisms. Our results favor the scenario that the Balmer BALs originate in a partially ionized region with a column density of cm-2 for an electron density of cm-3 via Ly resonant scattering pumping. The harsh conditions needed may help to explain the rarity of Balmer absorption line systems in quasar spectra. With an -band PSF magnitude of 16.50, LBQS 1206+1052 is the brightest Balmer-BAL quasar ever reported. Its high brightness and unique spectral properties make LBQS 1206+1052 a promising candidate for follow-up high-resolution spectroscopy, multi-band observations, and long-term monitoring.
keywords:
galaxies: active — quasar: absorption lines — quasar: individual (LBQS 1206+1052)1 Introduction
Outflows from active galactic nuclei (AGN) play an important role in galaxy evolution. Gas in AGN may be accelerated to high velocities by thermal pressure (Begelman et al., 1983), radiation pressure due to line and continuum absorption (Proga & Kallman, 2004), magneto-centrifugal forces (Everett, 2005), or their combinations. The outflowing gas is potentially crucial to maintaining the accretion process by carrying away angular momentum; to chemical evolution in AGN by funneling metal-enriched circum nuclear gas into their hosts (Hamann, 1999; Wang et al., 2009); and to regulating the co-growth of the black holes and the bulges of their host galaxies by feedback of energy and momentum (e.g. Tremaine et al., 2002; Ferrarese & Merritt, 2000), and thus quenching the gas supply to the nuclear activity and the host star formation process (e.g. Granato et al., 2004; Di Matteo et al., 2005).
AGN outflows often manifest themselves as blueshifted absorption lines, commonly classified into three categories depending on their width (Hamann & Sabra, 2004): (1) broad absorption-lines (BALs) with km s-1; (2) narrow absorption lines (NALs) with km s-1; (3) mini-BALs with in between. NALs are very common with a detection rate of about 60% in Seyfert galaxies (Crenshaw et al., 1999) and 50% in quasars (Hamann & Sabra, 2004). BALs are seen in of optically selected quasars111The frequency depends on the specific quasar samples and different BAL picking techiques, ranging from to (e.g. Tolea et al. (2002); Reichard et al. (2003); Trump et al. (2006); Gibson et al. (2009); Ganguly & Brotherton (2008)). NALs can originate from gas either intrinsic or intervening to AGN, while BALs are generally believed to be intrinsic to AGN. All known BAL quasars show high-ionization broad absorption lines (HiBAL), including C IV, Si IV and N V. About of BAL quasars present low-ionization broad absorption-lines (LoBALs) besides HiBALs, such as Al III, Al II, and Mg II (Weymann et al., 1991; Reichard et al., 2003; Zhang et al., 2010). A minority (another ) (Hall et al., 2002) of LoBAL quasars exhibit additional absorption in Fe II and Fe III from both ground and excited levels (FeLoBAL). Even rarer are excited He I* absorption lines, and Balmer absorption lines are the extreme rarities.
Only 5 Balmer-absorption AGNs have been reported thus far: NGC 4151 (Hutchings et al., 2002), SDSS J083942.11+380526.3 (Aoki et al., 2006), SDSS J125942.80+121312.6 (Hall, 2007), SDSS J102839.11+450009.4 (Wang et al., 2008), and SDSS J172341.10+555340.5 (Aoki, 2010). Three of the five are formally classified as FeLoBALs222The two non-FeLoBALs are NGC 4151 and SDSS J102839.11+450009.4. The former shows Fe II NALs (Hutchings et al., 2002), and Fe II NALs are marginally detected in the later (Wang et al., 2008). . The high occurrence rate of both Fe II and Balmer absorption lines indicates that they are closely related, in spite of the small number of such AGN. Their UV spectra are often profuse in excited Fe II* absorption lines that are help to constrain the density of absorption gas (de Kool et al., 2001). We would have a more complete picture of the physical condition and geometry, incorporating ionization state with He I* as a useful tracer. Interestingly, both of NGC 4151 (Hutchings et al., 2002) and SDSS J102839.11+450009.4 (Wang et al., 2008) show He I* NALs, which are the only Balmer-absorption AGN with He I* covered by previous spectroscopy with negligible contamination. Note that only a handful of He I* absorption AGN have been reported in the literature333Previously known He I* absorption AGN include Mrk 231 (Boksenberg et al., 1977; Rudy et al., 1985), NGC 4151 (Hutchings et al., 2002; Anderson, 1974), Q 2359-1241 (Arav et al., 2001). Wang et al. (2008) reported SDSS J102839.11+450009.4 as a remarkable strong narrow Fe II emission-line quasars with He I* 3889, 3189, 2796 narrow absorption lines. Recently, Leighly et al. (2011) reported first observation of the infrared line He I* , which is 23 times stronger than optical He I* and could determine a much lower column density.. The co-occurrence of He I* and Balmer absorption lines is again remarkably high.
Balmer absorption lines arise from the absorption by shell excited hydrogen atoms. H I* level could be populated by recombination, collisional excitation and Ly resonant scattering (Hall, 2007; Wang et al., 2008). He I* lines arise from absorption by highly metastable level He I* with transition probability s-1. Transitions from to different upper levels include He I* in the infrared (Leighly et al., 2011), in the optical, and in the UV. The population of this level comes from the recombination of He+ ion. A plenty of eV photons are needed to ionize neutral helium, while there should not exist too many eV photons to ionize He I* . Diffuse stellar background provides too many photons to ionize the He I* level, and thus these lines are not easily seen in the interstellar medium. We can therefore safely associate the incidence of neutral helium line with an AGN environment (Rudy et al., 1985). Ignoring second-order effects, recombinations of He+ to He I* is mainly balanced with collisional de-excitation of this level (Arav et al., 2001). Upon that, He I* lines can be used to set a lower limit on the He+ column density, or a lower limit to H II column density with an assumed abundance.
Potentially we could have a good chance to explore the properties of AGN Balmer absorption line region (ALR). Due to their rarity, however, it is not yet clear whether AGN with Balmer ALR form an unusual class, or they are otherwise normal AGN with our line-of-sight (LOS) happened to penetrate Balmer ALR, which exists in most if not all AGN, but with an extremely small global covering factor (GCF). It is not even known how rare Balmer-absorption AGN are. Discovery of more such AGN are obviously helpful for understanding their intriguing nature.
In this paper, we report the new identification of Balmer BALs in LBQS 1206+1052, which was identified during the large bright quasar survey (Hewett et al., 1995) and recently classified as a LoBAL (Gibson et al., 2009). It is in fact one of Balmer-absorption quasars we recently identified during our systematic search in the quasar catalog from the 7th data release (Schneider et al., 2010) of Sloan Digital Sky Survey (SDSS, (York et al., 2000)). With band PSF magnitude of 16.50, the high brightness of LBQS 1206+1052 makes it an excellent candidate for high resolution spectroscopic follow-up and for long-term variability campaign which are crucial for absorption line study. The paper is organized as follows. In § 2, we analyze the SDSS spectrum and measure column densities of H I*, He I*, and Mg II. The results are discussed in § 3. § 4 is a brief summary of our main conclusions.
2 SDSS Spectroscopy
2.1 Continuum and Emission Line Spectrum
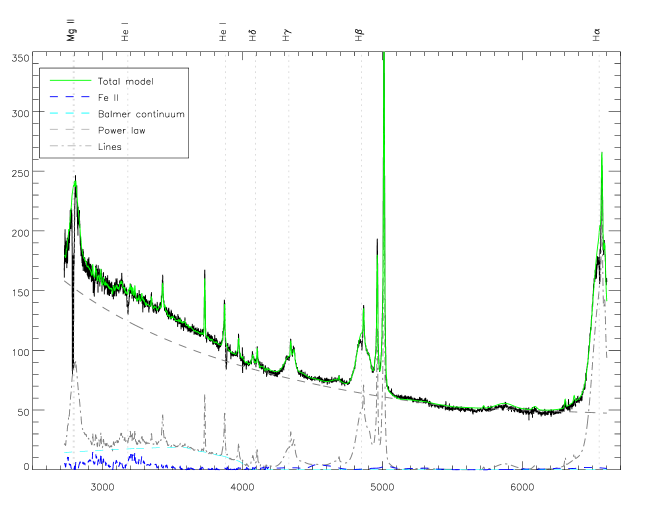
LBQS 1206+1052 was targeted as a quasar candidate for spectroscopy, and was observed by SDSS 2.5m telescope on 2003-03-24 with an exposure time of 3165 seconds. It is very bright with optical PSF magnitudes of 17.19, 16.63, 16.50, 16.34, 15.92 at , , , , bands. The SDSS spectrum, retrieved from SDSS Data Release 7 database, is corrected for a Galactic reddening of mag (Schlegel et al., 1998), and brought to the source rest-frame for further analysis with the systemic redshift (), re-measured from [O III] as described below. The spectrum is shown in Figure 1. In the rest wavelength range of Å, BALs are evident in H, H, He I* 3889, 3189, 2946, and Mg II 2796, 2803 with a velocity range of km s-1.
Properly modeling of continuum and emission lines is essential to derive absorption line parameters. In the observed quasar spectrum, prominent broad and narrow emission lines are siting on top of pseudo-continuum, consisting of thermal emission from the accretion disk, Balmer continuum from broad line region or disk, the blended FeII lines and high order Balmer lines. We fit the pseudo-continuum and emission lines in two steps as follows. In the first step, the pseudo-continuum is modeled with three components: a single power law to mimic emission from accretion disk, a Balmer continuum plus high order Balmer lines, and blended Fe II emission lines.
Following Dietrich et al. (2003) and Tsuzuki et al. (2006) , the Balmer continuum is expressed by for Å, where is the normalization coefficient at Balmer edge Å and in which is optical depth at Balmer edge ( Å), and is the Planck function at an electron temperature , which is assumed to be K (Dietrich et al., 2003). High order Balmer lines up to are also used in the fit. Relative strengths of these lines are fixed using the line emissivities for Case B, K and cm-3 as calculated by Storey & Hummer (1995), and each line is assumed a Gaussian profile with a FWHM of 3000 km s-1. The relative flux of the high order Balmer lines to the flux of the Balmer continuum at the edge is fixed using the results in Wills et al. (1985). Thus these blended high order Balmer lines and the Balmer continuum join smoothly, forming a pseudo-continuum (Wills et al., 1985). Note that none of the assumptions concerning the Balmer continuum and high order Balmer lines will have significant effect on the measurement of absorption lines because all these features are quite broad.
The optical and UV Fe II emission are modeled separately with broadened empirical templates derived from observed quasar spectra. For optical band long-ward of Å, we use a template extracted from the optical spectrum of proto-type narrow line Seyfert 1 galaxy I Zw 1 Véron-Cetty et al. (2004). The template includes both the broad and narrow component, the latter also includes transitions from Ni II, Cr II and Ti II. For UV portion short-ward of Å, we employ a template built from SDSS J1632+3405 (Zhou et al. 2012 in preparation). SDSS J1632+3405 has ultra strong UV Fe II emission, which has a FWHM of km s-1, only about half of that in I Zw 1. The narrow width makes it easy to separate Fe II multiplets from the other lines and also among different multiplets. Thus it is a more promising target for building UV Fe II template. The relative strength of different UV multiplets ratios are allowed to vary during the fit. This is a common technique when modelling quasar Fe II spectra (Tsuzuki et al., 2006; Kovačević et al., 2010; Sameshima et al., 2011).
Above continuum components are combined to fit the SDSS spectrum in following windows: 2855-3010, 3625-3645, 4170-4260, 4430-4770, 5080-5550, 6050-6200 Å, which are devoid of strong emission lines (Vestergaard & Wilkes, 2001). The window 3625-3645 is used to constrain Balmer continuum. The best fitted parameters are derived by minimization of . Line spectrum is then acquired by subtracting the best fitted pseudo-continuum from the original spectrum.
In the second step, emission-lines are measured in this line spectrum. All narrow lines or narrow component of broad lines except [O III] and [Ne III] are fitted with a single Gaussian. The centroids of the Gaussian are fixed to the vacuum wavelengths of these lines, and their widths are tied during the fit. [O III] and [Ne III] show an additional blueshifted component, and are fitted with two Gaussians for each of the multiplet. The width and velocity shift between the two Gaussians are tied for these lines during the fit, while their normalizations are allowed to vary independently. [Ne III] 3869 emission line is affected by He I* 3889 absorption, and the pixels affected by He I* 3889 line are masked during the fit according to corresponding He I* 3189 absorption profile. Narrow lines included in this fit are [Ne V] 3425, [O II], [Ne III] 3869, H, H, [O III] 4363, He II 4686, H, [O III]4959, 5007, [O I], H, and [N II]6548, 6583.
Broad lines are fitted using as many Gaussians as statistically justified. Broad component of H is fitted with 4 Gaussians, while H with 3 Gaussians because the red part of H line is not in the observed spectrum range. Pixels affected by Balmer absorption are masked as done for He I* 3889. The fitted profiles of broad H and H lines are very similar in the overlapping portion in the velocity space, lending credit to our fitting scheme of broad lines. Mg II lines are fitted with two Gaussians in the same way as for Balmer lines except that no narrow Gaussian is used because there are no explicit narrow Mg II doublet.
The best fit model is overlaid in Figure 1, together with individual components.
2.2 Absorption Line Spectrum and Column Densities
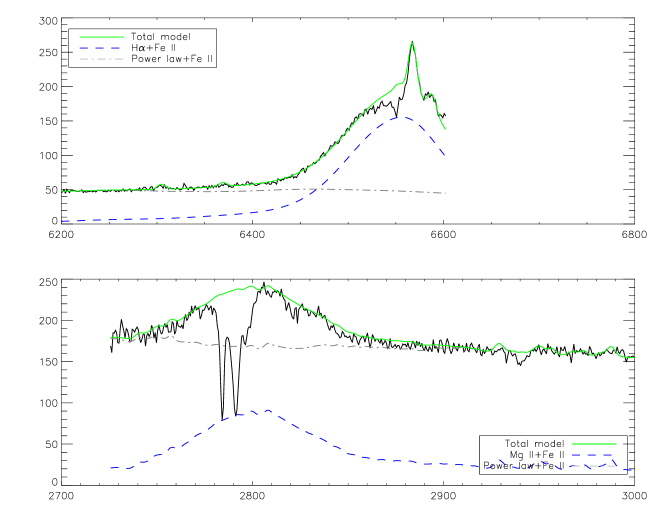
We use the best fit model to normalize the absorption line spectrum. We first subtract model narrow emission lines from the observed spectrum before normalization, since absorption gas does not cover the narrow emission line region (NLR) in all well studied BAL quasars. Mg II doublet and Balmer absorption lines are superposed on top of broad emission lines. They should be normalized in different ways depending on whether the absorbing gas covers the broad emission line regions (BLR) or not (de Kool et al., 2001): (1) The observed data should be divided by the sum of the continuum and broad emission lines if it does. (2) If not, the broad emission lines should be subtracted before the observed data normalized by the continuum. We adopt the second normalization scheme for the following hints. We bloat Figure 1 and display the close-ups in Figure 2 focusing on the two H and Mg II regimes. It can be seen clearly that the modeled broad emission lines just brush the tip of the BAL trough in both of H and Mg II lines. The fact can be most naturally interpreted in the second scheme with an optical depth at the centroid of both H and Mg II BAL troughs. Otherwise we would need to have two coincidences at once, which is very unlikely if not impossible. The interpretation is also consistent with the marginal detection of Ca II K in absorption, which suggests a large optical depth in Mg II BAL doublet for any reasonable abundance.
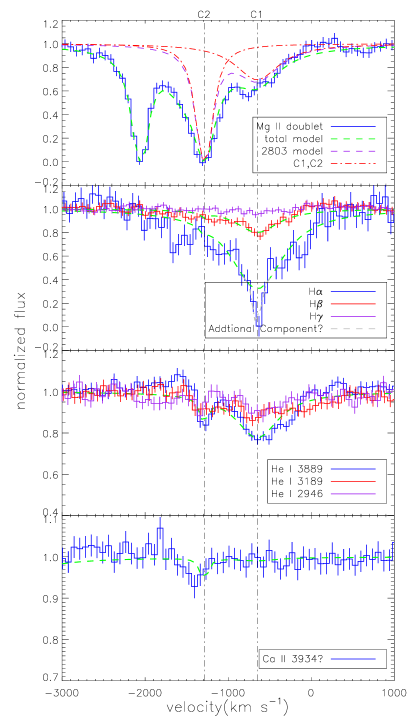
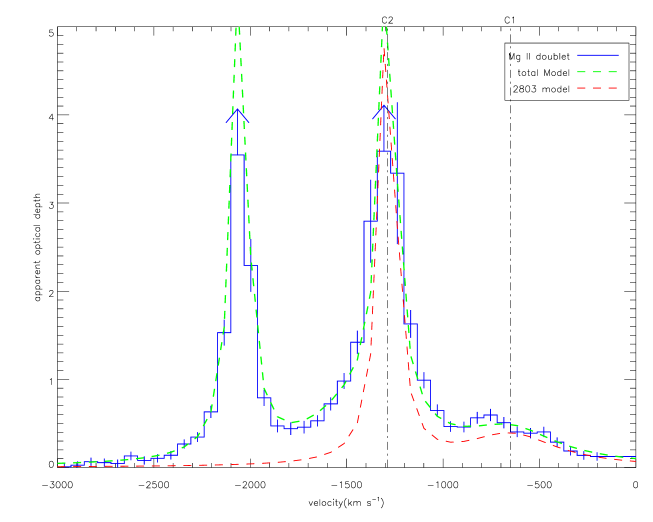
The normalized absorption line spectrum is shown in Figure 3, and the apparent optical depth profile of Mg II 2796, 2803 doublets is shown in Figure 4. The normalized flux at the line centroid approaches zero for Mg II and H lines. Note that Balmer emission line profiles at the absorption line position is somewhat uncertain due to lack of independent constraint. We use 1- error of normalized flux to deduce a lower limit for apparent optical depth of the deepest pixels. The Mg II profile apparently show two components, one broad component with corresponding Balmer and helium absorption lines. The other one is relatively narrow and shows He I* lines, possible Ca II 3934 absorption line and little Balmer absorption line. We simultaneously fit the apparent optical depth of all absorption lines with two Lorentzians for each line, which is similar to Voigt profiles for small values. The line centroid of other lines are tied to that of Mg II lines and the line width is assumed to be equal for the same component during the fit. The best fitted model for Mg II is also shown in Figure 4, and overlaid in Figure 3. The fitted EWs for each line are shown in Table 1. The low velocity component is centred at km s-1 and with a FWHM of km s-1, it is referred to as component 1 (C1) hereafter, while a high velocity component with a line centroid of km s-1 and a FWHM of km s-1 are referred to as component 2 (C2) hereafter.
The C1 component shows similar profiles in Mg II, He I* and Balmer absorption lines. There is only one pixel in H line that is inconsistent with our model, which can be attributed to imperfect emission line modeling. The ratio of 2796 to 2803 for C1 is 2:1, which is consistent with that the absorption gas fully cover the continuum source. To check this, we compare the ratios of Balmer lines with their theoretical values. From Table 1, we can see that the Balmer absorption line EW ratio is consistent with theoretical ratio 7.26, thus we favour that the absorbing gas of C1 fully covers the continuum source and the lines are not saturated. Under this assumption, we derive column densities of various ions from their equivalent widths , using the equation from Jenkins (1986):
| (1) |
We get a column density for Mg II from Mg II 2803 line: cm-2, for hydrogen at from H line: cm-2 and for helium from He I* 3889 line cm-2
Component C2 shows consistent absorption trough in Mg II and He I*. A weak line near 3930 Å may be attributed to the Ca II K absorption line of this component (blueshifted by km s-1 relative to other lines). The Mg II absorption line is seriously saturated as indicated by the doublet ratio of Mg II, . Thus we can only get a lower limit of Mg II column density using equation (1), cm-2. Alternatively, we may integrate the apparent optical depth profile and get a column density of cm-2, which is likely close to the real value. The H line of C2 is not detected significantly. We derive an upper limit on its column density cm-2. The He I* lines in this component are generally weak, we get a column density of cm-2.
3 Discussion
The overall rarity of Balmer absorption line quasar indicates that either the conditions for outflowing gas to maintain a sufficient population of level hydrogen atoms must be very harsh. We will discuss the conditions required to produce the Balmer absorption lines in C1 with different mechanisms.
If the level hydrogen atoms of this component are caused by collisional excitation, they must exist in H I region or probably the partially ionized region. The observed Mg II absorption lines suggest that there is partially ionized absorption line region. Mg+ ions are created by photons with energy greater than 7.6 eV and destroyed by photons with energy greater than 15.0 eV, thus they mainly survive in outer part of H II region and mostly in partially ionized region. Assuming that Mg+ is the dominant species of Mg and a solar abundance with [Mg/H]=-4.4, we got a lower limit on the total hydrogen column density of cm-2 for the partially ionized zone. If thermal equilibrium is achieved, then using Boltzmann equation: eV, in which and are densities of and level hydrogen, one yields readily a column density of hydrogen of cm-2, which is close to the observed hydrogen column density cm-2, at a typical temperature TK for photo-ionized gas. However, thermal equilibrium requires that collisions with thermal particles are the dominant process for excitation and de-excitation. This yields a lower density limit cm-3 accounting for the resonant scattering of Ly photons, where is the optical depth of Ly from the central of the region. For a gaussian distribution turbulence, we can write , where is the turbulent velocity of gas in units of km s-1 and neutral hydrogen column density in cm-2. This gives a density too high for any reasonable line absorbing gas.
When density is lower than the critical density discussed above, detailed equilibrium of level must be considered. Transition of state to the ground level is forbidden with a small Einstein coefficient via 2-photon process, while transition from to is allowed. The two levels have very different excitation processes, therefore, we will consider them separately in the following analysis.
Let us first consider the equilibrium of level. In the case that absorption gas is optically thin to Ly, the equilibrium between the recombination to and radiative decay from to yields 444As we discuss next, the absorbing gas is probably in partially ionized region, where the typical temperature is significantly lower than K, and in this region, thus we ignore the collisional excitation of 2p level here.. However, the gas is likely very optically thick to Ly. In this case, each Ly photon is scattered times on average before escaping (Osterbrock & Ferland, 2006). This leads to the population larger by a factor of than above optically thin formula, i.e., . To get the observed column density, we require
| (2) |
where is fraction of ionized hydrogen. As discussed in §2.2, it is very likely that the BALR in LBQS 1206+1052 fully covers the accretion disk but does not cover the BLR. This suggest cm, where , and are the size of accretion disk, broad absorption line region, and broad emission line region, respectively. We infer a hydrogen column density of cm-2 of the partially ionized gas for an electron density of cm-3. For a higher and lower , the BALR would not be large to fully cover the accretion disk, while the BALR would be large enough to cover the BLR for a lower and higher . The inferred value is much larger than the thermal equilibrium value.
Next, we consider population in the level. The equilibrium equation of level can be written as
| (3) |
in which we ignored the effect of level for the time being555Had been significantly populated due to Ly trapping in dense gas as discussed in last paragraph, because of large collision strength, and level will reach thermal equilibrium, that is .. The first term on the left hand represents recombination to level, while the second term represents collisional excitation. Given that and are in the same order of magnitude ( cm-3 s-1, cm-3 s-1 at T=10,000 K), the ratio of the first to second term is mainly determined by the ratio of to . In H II region where is high, the recombination mechanism dominates the population of level, while in H I region or PIZ where is low, the collisional excitation dominates the population of level, we treat them separately.
In H I or PIZ region, we ignore the first term on the left hand of equation (3). The third term on the right hand is the photoionization of level, in which is the frequency at Balmer edge Å. It can be shown that the third term is negligible by substituting the integration term with and and assuming a power low index of optical-UV continuum (Vanden Berk et al., 2001). If density of absorption gas is sufficiently low compared to critical density cm-3 at K (Osterbrock& Ferland 2006), the equilibrium gives , otherwise if the density is moderately high, the second route will dominate, which gives , which is around at a temperature of K 666Wang et al. (2008) used an incorrect value resulting an incorrect value . This requires a total hydrogen column greater than cm-2 to generate the observed Balmer absorption lines EW in Q 1206+1052. Clearly, collisional excitation is mush less efficient in populating level than Ly resonant scattering in partially ionized gas in AGNs if gas density is high.
Alternatively the level population could arise from ionized gas via recombination, and we ignore the second term on the left hand of equation (3). As in the collisional excitation dominated case, we further distinguish cases when densities are below or above the critical density cm-3 set by collisional angular-momentum transition from to state. If the density is higher than that, the state is populated by recombination and depopulated via collisional excitation to state, which radiatively decay to level. The equilibrium gives at K. Otherwise if the density is lower than that critical density, the equilibrium is built through the balance between the two-photon continuum emission of and the recombination to 2s state, which gives . The last equation in above estimations utilizes the fact that when this route dominates the equilibrium, . Thus if indeed the level two population is from the HII zone, the observed column require a total hydrogen column of at least cm-2. The column density appears too large for the absorbing gas.
To summarize, the resonant scattering of Ly is much more efficient in populating level in the partially ionized region if gas density is high. In this case, the column density required to account for the Balmer absorption lines in C1 are in the range of to cm-2 for gas density between to cm-3 and decreases with square roots of the gas density. At much low densities, collisional excitation may take over the resonant scattering pumping, and it requires a column density at least 5 cm-2. In the H II region, recombination can lead to the required level at very high column density cm-2.
A thick H II region is not consistent with the observed helium absorption lines. He I* absorption arises from absorption by metastable He I* state. The equilibrium equation of this level is (Arav et al., 2001):
| (4) |
where, is the threshold frequency at ionization energy eV of state, and , , are corresponding collisional rates. The left hand term represent recombination of He II ions with electrons. On the right hand of the equation, the first term is radiative transition from to , which is a forbidden transition and can be neglected; the second term are collisional de-excitation of to and ; and the third and forth terms represent collisional and radiative ionization of respectively. Neglecting terms other than collisional de-excitation, we got
| (5) |
where K for photoionized gas. At a reasonable gas density, the observed He I* S column density implies a column density of H II zone of only cm-2. This column density is much lower than required for excitation of level via recombination, but is consistent with Ly pumping as the main excitation mechanism for population.
A thick H I region can produce too larger column density of Mg II. It is shown that the fraction of Mg+ in the PIZ of AGN ionized region ranges from cm-3 close to H II-H I transition zone to near dominated species deep inside the H I region. To meet the observed Mg II column density, the PIZ zone can not be thicker than a few cm-2, which rules out the possibility of collisional excitation without Ly pumping. Therefore, Ly pumping remains the only possible excitation mechanism at least for the Balmer absorption in this object, and the density is likely higher than cm-3.
For C2, Mg II lines are seriously saturated. The column densities derived from integrated Mg II apparent optical depth profile set a lower limit on hydrogen column density of cm-2. On the other hand, a lower limit of the column density ( cm-2) can be derived from the He I* absorption lines with an analysis similar to that for C2. Although Mg II column density is much larger than that of C1 and He I* column density is similar, the Balmer absorption is not detected with an upper limit of cm-2.
As discussed above, hydrogen is populated much more efficiently via Ly pumping process than with other routes. The process works well in relatively dense material and in partially ionized medium. Lack of the Balmer absorption lines can be attributed to any of the following cases (2): the total column density of partially ionized zone is too low; the ionization of the gas may be too large; the density of gas is too low, or any combination of the three. As pointed out in Lu et al. (2008), a trace amount of Mg+ may originate from an ionized region with log where Al2+ and C3+ live. A total hydrogen column density of cm-2 is required to generate the observed Mg+ if this is the case, although the column is much larger than the lower limit set by helium absorption, we can not rule out this possibility for now.
4 Summary and Future Prospectives
We present a detailed analysis of absorption line systems in the quasar LBQS 1206+1052, the brightest quasar showing Balmer absorption lines H and H. From its medium resolution SDSS spectra, we found that there are mainly two absorption components. Component 1 is blueshifted by km s-1 and with a FWHM of 603 km s-1, showing corresponding absorption in Balmer, He I* and Mg II. This component has full coverage of the continuum source but not BLR. Component 2 is blueshifted by -1412 km s-1 and with a FWHM of km s-1. The Mg II lines are seriously saturated for this component, while helium lines are generally too weak to facilitate partial coverage analysis and Balmer absorption lines are not detected. If the H is the outcome of recombination, a typical ionized hydrogen column density of several cm-2 is needed to generate the observed absorption in Balmer series. Collisional excitation of 2 level without Ly resonance scattering in play also requires an column as high as cm-2. These column density are inconsistent with either Mg II or He I∗ absorption lines. Thus, Ly scattering in a partially ionized region is the main mechanism of populating level hydrogen, and the required column is to cm-2 for gas density between to cm-3 and decreases with square roots of the gas density. These harsh conditions required, i.e. the large column density and density, may help to explain the overall rare population of such objects, only (Ji et al. 2011 in preparation) out of DR7 quasars (Schneider et al., 2010).
Due to the medium S/N and resolution of SDSS spectra, we cannot restrain further about the nature of the absorber. However, the bright magnitudes make LBQS 1206+1052 the most promising candidate for high resolution spectroscopic observation, which will provide resolved velocity profile for pixel-to-pixel based covering factor and velocity structure analysis. The Earth’s atmosphere cutoff wavelength Å corresponds to a rest-frame wavelength Å at of the quasar. Given the high rate of detecting Balmer absorption in FeLoBALs, we expect to detect absorption lines in UV1 multiplet arising from excited levels of Fe II ions from ground-based facilities, such as Keck and MMT, which may help to determine the density of the absorption gas (Korista et al., 2008). Long-term monitor is also helpful to explore its physical/geometrical properties.
This work is supported by the Chinese NSF through grants NSF 10973013 and 11033007, and the Fundamental Research Funds for the Central Universities through grant WK 2030220006, and the SOA project CHINARE2012-02-03. This paper has made use of data from NED,NIST and SDSS. Funding for the SDSS and SDSS-II has been provided by the Alfred P. Sloan Foundation, the Participating Institutions, the National Science Foundation, the U.S. Department of Energy, the National Aeronautics and Space Administration, the Japanese Monbukagakusho, the Max Planck Society, and the Higher Education Funding Council for England. The SDSS Web Site is http://www.sdss.org/. The SDSS is managed by the Astrophysical Research Consortium for the Participating Institutions. The Participating Institutions are the American Museum of Natural History, Astrophysical Institute Potsdam, University of Basel, University of Cambridge, Case Western Reserve University, University of Chicago, Drexel University, Fermilab, the Institute for Advanced Study, the Japan Participation Group, Johns Hopkins University, the Joint Institute for Nuclear Astrophysics, the Kavli Institute for Particle Astrophysics and Cosmology, the Korean Scientist Group, the Chinese Academy of Sciences (LAMOST), Los Alamos National Laboratory, the Max-Planck-Institute for Astronomy (MPIA), the Max-Planck-Institute for Astrophysics (MPA), New Mexico State University, Ohio State University, University of Pittsburgh, University of Portsmouth, Princeton University, the United States Naval Observatory, and the University of Washington.
| Line | Wavelength(Å) | 777 Oscillator strength are from NIST Atomic Spectra Database (http://physics.nist.gov/PhysRefData/ASD/). | 888Equivalent widths for component 1, which is a Gaussian with centroid at -726 km s-1 and FWHM 603 km s-1 | 999Equivalent widths for component 2, which is a Gaussian with centroid at -1412 km s-1 and FWHM 208 km s-1 |
| H | 6564.41 | 0.6400 | ||
| H | 4862.68 | 0.1190 | ||
| H | 4341.68 | 0.0446 | none | |
| He I* 3889 | 3889.75 | 0.0278 | ||
| He I* 3189 | 3188.66 | 0.0110 | ||
| He I* 2946 | 2945.96 | 0.0053 | ||
| Mg II 2796 | 2796.35 | 0.6160 | ||
| Mg II 2803 | 2803.53 | 0.3060 | ||
| Ca II 3934 | 3934.78 | 0.6270 | none |
References
- Anderson (1974) Anderson, K. S. 1974, ApJ, 189, 195
- Aoki (2010) Aoki, K. 2010, PASJ, 62, 1333
- Aoki et al. (2006) Aoki, K., Iwata, I., Ohta, K., et al. 2006, ApJ, 651, 84
- Arav et al. (2001) Arav, N., Brotherton, M. S., Becker, R. H., et al. 2001, ApJ, 546, 140
- Begelman et al. (1983) Begelman, M. C., McKee, C. F., & Shields, G. A. 1983, ApJ, 271, 70
- Boksenberg et al. (1977) Boksenberg, A., Carswell, R. F., Allen, D. A., et al. 1977, MNRAS, 178, 451
- Crenshaw et al. (1999) Crenshaw, D. M., Kraemer, S. B., Boggess, A., et al. 1999, ApJ, 516, 750
- de Kool et al. (2001) de Kool, M., Arav, N., Becker, R. H., et al. 2001, ApJ, 548, 609
- Di Matteo et al. (2005) Di Matteo, T., Springel, V., & Hernquist, L. 2005, Nature, 433, 604
- Dietrich et al. (2003) Dietrich, M., Hamann, F., Appenzeller, I., & Vestergaard, M. 2003, ApJ, 596, 817
- Everett (2005) Everett, J. E. 2005, ApJ, 631, 689
- Ferrarese & Merritt (2000) Ferrarese, L., & Merritt, D. 2000, ApJ, 539, L9
- Ganguly & Brotherton (2008) Ganguly, R., & Brotherton, M. S. 2008, ApJ, 672, 102
- Gibson et al. (2009) Gibson, R. R., Jiang, L., Brandt, W. N., et al. 2009, ApJ, 692, 758
- Granato et al. (2004) Granato, G. L., De Zotti, G., Silva, L., Bressan, A., & Danese, L. 2004, ApJ, 600, 580
- Hall (2007) Hall, P. B. 2007, AJ, 133, 1271
- Hall et al. (2002) Hall, P. B., Anderson, S. F., Strauss, M. A., et al. 2002, ApJS, 141, 267
- Hamann (1999) Hamann, F. 1999, in Structure and Kinematics of Quasar Broad Line Regions, Astronomical Society of the Pacific Conference Series, vol. 175, edited by C. M. Gaskell, W. N. Brandt, M. Dietrich, D. Dultzin-Hacyan, & M. Eracleous, 33–+
- Hamann & Sabra (2004) Hamann, F., & Sabra, B. 2004, in AGN Physics with the Sloan Digital Sky Survey, Astronomical Society of the Pacific Conference Series, vol. 311, edited by G. T. Richards & P. B. Hall, 203–+
- Hewett et al. (1995) Hewett, P. C., Foltz, C. B., & Chaffee, F. H. 1995, AJ, 109, 1498
- Hutchings et al. (2002) Hutchings, J. B., Crenshaw, D. M., Kraemer, S. B., et al. 2002, AJ, 124, 2543
- Jenkins (1986) Jenkins, E. B. 1986, ApJ, 304, 739
- Korista et al. (2008) Korista, K. T., Bautista, M. A., Arav, N., et al. 2008, ApJ, 688, 108
- Kovačević et al. (2010) Kovačević, J., Popović, L. Č., & Dimitrijević, M. S. 2010, ApJS, 189, 15
- Leighly et al. (2011) Leighly, K. M., Dietrich, M., & Barber, S. 2011, ApJ, 728, 94
- Lu et al. (2008) Lu, H., Wang, T., Yuan, W., et al. 2008, ApJ, 680, 858
- Osterbrock & Ferland (2006) Osterbrock, D. E., & Ferland, G. J. 2006, Astrophysics of gaseous nebulae and active galactic nuclei
- Proga & Kallman (2004) Proga, D., & Kallman, T. R. 2004, ApJ, 616, 688
- Reichard et al. (2003) Reichard, T. A., Richards, G. T., Hall, P. B., et al. 2003, AJ, 126, 2594
- Rudy et al. (1985) Rudy, R. J., Stocke, J. T., & Foltz, C. B. 1985, ApJ, 288, 531
- Sameshima et al. (2011) Sameshima, H., Kawara, K., Matsuoka, Y., et al. 2011, MNRAS, 410, 1018
- Schlegel et al. (1998) Schlegel, D. J., Finkbeiner, D. P., & Davis, M. 1998, ApJ, 500, 525
- Schneider et al. (2010) Schneider, D. P., Richards, G. T., Hall, P. B., et al. 2010, AJ, 139, 2360
- Storey & Hummer (1995) Storey, P. J., & Hummer, D. G. 1995, MNRAS, 272, 41
- Tolea et al. (2002) Tolea, A., Krolik, J. H., & Tsvetanov, Z. 2002, ApJ, 578, L31
- Tremaine et al. (2002) Tremaine, S., Gebhardt, K., Bender, R., et al. 2002, ApJ, 574, 740
- Trump et al. (2006) Trump, J. R., Hall, P. B., Reichard, T. A., et al. 2006, ApJS, 165, 1
- Tsuzuki et al. (2006) Tsuzuki, Y., Kawara, K., Yoshii, Y., et al. 2006, ApJ, 650, 57
- Vanden Berk et al. (2001) Vanden Berk, D. E., Richards, G. T., Bauer, A., et al. 2001, AJ, 122, 549
- Véron-Cetty et al. (2004) Véron-Cetty, M.-P., Joly, M., & Véron, P. 2004, A&A, 417, 515
- Vestergaard & Wilkes (2001) Vestergaard, M., & Wilkes, B. J. 2001, ApJS, 134, 1
- Wang et al. (2008) Wang, T., Dai, H., & Zhou, H. 2008, ApJ, 674, 668
- Wang et al. (2009) Wang, T., Zhou, H., Yuan, W., et al. 2009, ApJ, 702, 851
- Weymann et al. (1991) Weymann, R. J., Morris, S. L., Foltz, C. B., & Hewett, P. C. 1991, ApJ, 373, 23
- Wills et al. (1985) Wills, B. J., Netzer, H., & Wills, D. 1985, ApJ, 288, 94
- York et al. (2000) York, D. G., Adelman, J., Anderson, J. E., Jr., et al. 2000, AJ, 120, 1579
- Zhang et al. (2010) Zhang, S., Wang, T.-G., Wang, H., et al. 2010, ApJ, 714, 367