A direct measurement of hierarchical growth in galaxy groups since ⋆
Abstract
We present the first measurement of the evolution of the galaxy group stellar mass function (GrSMF) to redshift and low masses ( M⊙). Our results are based on early data from the Carnegie-Spitzer-IMACS (CSI) Survey, utilizing low-resolution spectra and broadband optical/near-IR photometry to measure redshifts for a m selected sample of 37,000 galaxies over a 5.3 deg2 area to . Employing a standard friends-of-friends algorithm for all galaxies more massive than , we find a total of groups. Correcting for spectroscopic incompleteness (including slit collisions), we build cumulative stellar mass functions for these groups in redshift bins at , comparing to the and mass functions from various group and cluster samples. Our derived mass functions match up well with X-ray selected clusters, and strong evolution is evident at all masses over the past 8 Gyr. Given the already low level of star formation activity in galaxies at these masses, we therefore attribute most of the observed growth in the GrSMF to group-group and group-galaxy mergers, in accordance with qualitative notions of hierarchical structure formation. Given the factor increase in the number density of groups and clusters with M⊙ since and the strong anticorrelation between star formation activity and environmental density, this late-time growth in group-sized halos may therefore be an important contributor to the structural and star-formation evolution of massive galaxies over the past 8 Gyr.
Subject headings:
cosmology: observations — galaxies: evolution — galaxies: groups: general — galaxies: high-redshift1. Introduction
Just as the relative roles of genetics and environment in shaping human populations are hotly debated, so are the analogous processes argued among those who study the evolution of galaxies. The “nature” of a galaxy is thought to be primarily determined by the mass of its dark matter halo, since in isolation the collapse of a given amount of matter should give rise to descendents with a consistent set of properties (Berlind & Weinberg, 2002). However, like humans, galaxies don’t often mature in isolation: their “nurturing” is brought about through gas inflows from the extended cosmic web, mergers with other galaxies, and even direct interactions with hot, dense intergalactic gas (e.g. ram pressure stripping; Koopmann & Kenney, 2004; Crowl et al., 2005). While it is well-established that galaxies’ morphologies (Dressler, 1980; Wilman et al., 2009), colors (Cooper et al., 2007; Patel et al., 2009), and star-formation properties (Kauffmann et al., 2004; Patel et al., 2011; Quadri et al., 2012) differ in overdense and underdense environments, the reasons behind these correlations are still uncertain.
By targeting mass-selected galaxy samples in a range of environments, the role of “neighborhood” can be disentangled from that of mass. On the extremes, void galaxies which evolve essentially in isolation tend to exhibit stable, gas-rich, star-forming configurations (Grogin & Geller, 2000), while those in rich clusters are overwhelmingly quiescent and have morphologies which suggest frequent high-speed interactions or mergers (e.g., Farouki & Shapiro, 1981). Although such environments provide invaluable laboratories for the study of ex- and in-situ galaxy evolution respectively, they represent rare and extreme neighborhoods. Most of the galaxy population in fact resides in the proverbial suburbs: relatively small galaxy groups containing anywhere between two to a few dozen significant members (Eke et al., 2004). Groups’ influence on their member galaxies may be dramatic, like quenching star formation by keeping cold gas from reaching galaxies (e.g., van den Bosch et al., 2008) and/or triggering bursts of star formation through slower galaxy-galaxy interactions than clusters (Larson & Tinsley, 1978). In turn, the assembly of groups (and the quenching processes therein) since could be a major factor in the decline of the cosmic star formation rate over the same time period (Lilly et al., 1996; Madau et al., 1996).
Despite the ubiquity of groups, homogeneous samples are notoriously difficult to assemble beyond the nearby universe (). Since each group contains only a few galaxies spread over Mpc or more, standard cluster selection techniques (e.g. angular overdensities exhibiting a well-defined red sequence) cannot be applied. Comprehensive spectroscopic surveys over wide areas are the only reliable way to weed out groups from interlopers; however, at high redshifts optically-selected spectroscopic surveys are biased toward UV-bright, highly star-forming galaxies at the expense of the massive red galaxies which dominate dense environments. An infrared-selected survey, effectively producing a mass-limited sample at , is therefore necessary to produce an unbiased census of massive galaxies at these redshifts (van Dokkum et al., 2006; Kelson et al., 2012).
The Carnegie-Spitzer-IMACS (CSI) Survey111More information at http://csi.obs.carnegiescience.edu, currently underway at the Magellan-Baade 6.5m telescope in Chile, has been specifically designed to characterize massive galaxies and their environments up to . Here we present a measurement of the evolution of the group stellar mass function (GrSMF), to lower group masses and higher redshifts than has been previously achieved, using early data from CSI. Cosmological parameters , , and are assumed throughout.
2. Observations and spectral fitting
In a companion paper (Kelson et al., 2012), we describe the CSI observing setup and strategy, data reduction, and SED fitting; a brief summary follows. We employ a simple m flux limit of to select galaxies from three of the Spitzer Wide-Area Extragalactic Survey (SWIRE) fields: ELAIS-S1, Chandra Deep Field South, and XMM-Large Scale Structure (XMM-LSS), excluding stars with simple optical/IR color cuts. The m band lies in the rest-frame near-IR for galaxies at , resulting in an approximately mass-selected sample unbiased by dust and star formation. The first two years of observations focused primarily on the XMM-LSS field, giving it the best spectroscopic and photometric coverage at present; here we focus only on data from this 5.3 deg2 field in our analysis.
Targets were observed in multi-slit, nod-and-shuffle mode (Glazebrook & Bland-Hawthorn, 2001) with a multiplexing efficiency of objects per diameter mask, using the low-dispersion prism (LDP) on the Inamori-Magellan Areal Camera and Spectrograph (IMACS; Dressler et al., 2011) in 2009. In 2010, a second pass was mostly completed with the new uniform-dispersion prism (UDP) which provides superior resolution beyond Å. Some overlap between the LDP- and UDP-observed samples was included for cross-calibration and testing; overall, two passes have provided % completeness. The IMACS spectra are supplemented with moderate-depth and imaging from the NOAO Extremely Wide-Field InfraRed Mosaic (NEWFIRM) and optical photometry from the public CFHT Legacy Survey.
The spectra were optimally extracted and combined, and prism and broadband IR data were jointly fit using a generalized set of starburst models described by Kelson et al. (2012). With a series of benchmarks — spectroscopic redshifts in this field (VVDS; Le Fevre et al., 2005), galaxies observed with both the LDP and UDP, and comparing prism redshifts of physically associated galaxy pairs (cf. Quadri & Williams, 2010) — we infer typical redshift uncertainties of at . Notably, unlike photometric redshifts, these errors are comparable for red and blue galaxies since the prism spectrum pinpoints both the 4000Å break and emission lines. After excluding objects with poor SED fits (typically due to strong AGN components, bad photometry, and/or incorrect slit placement) the final catalog contains about 37,000 galaxy redshifts over 5.3 deg2, with an effective stellar mass limit of about M⊙ at .
3. Galaxy groups at
3.1. Finding groups with friends-of-friends
Groups typically appear as associations of two to a few tens of galaxies over an area of a few hundred projected kpc; accurate redshifts and large areas are therefore critical to building robust group samples. We employ a simple friends-of-friends (FoF; Huchra & Geller, 1982) algorithm to find groups in the CSI catalog, limiting the sample to galaxies with M⊙, the CSI mass limit for red galaxies at . Even at the low end our redshift uncertainty (%) is larger than the expected velocity dispersion of most virialized groups and clusters. Redshift uncertainties were estimated (using the techniques mentioned in Section 2) as a function of -band magnitude and the quadrature sum of each galaxy pair’s uncertainties was adopted as the redshift linking length. We used a transverse linking length of Mpc (matching the Yang et al. 2007 length of 1 Mpc for SDSS groups). The mean group redshift was also adjusted as new members were added, and previous group members falling outside 1 from the new mean were removed from the group. In cases where the members of two groups overlapped, the two were merged into a single group, the linking length recalculated, and the membership adjusted accordingly.
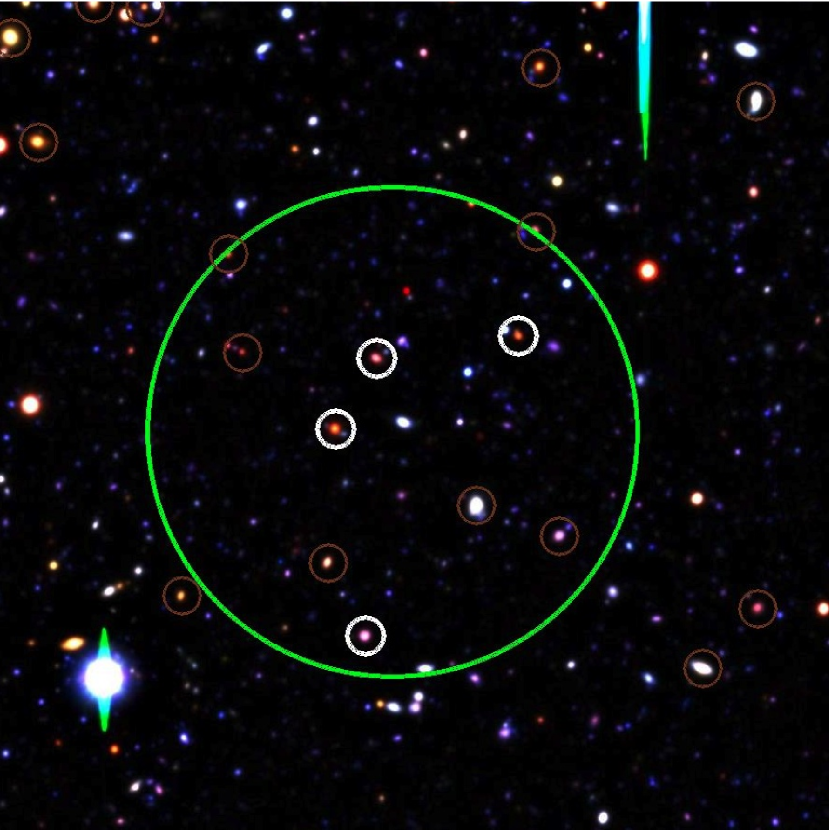
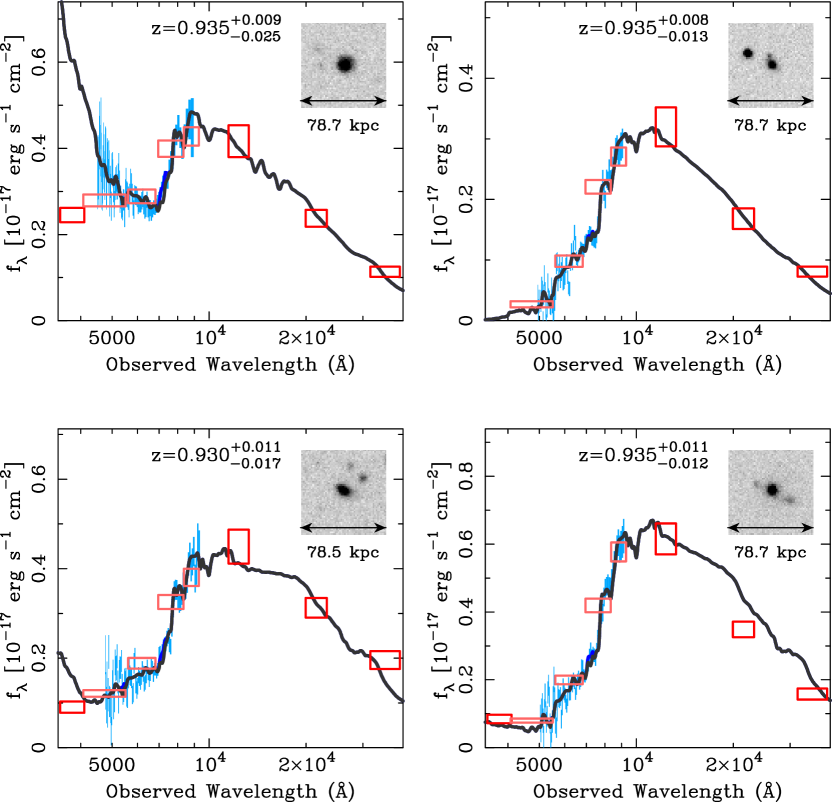
Ultimately this iterative FoF process found 1551 groups in the CSI catalog containing a total of 4140 confirmed galaxies above the mass limit, or an estimated 13000 galaxies after correcting for incompleteness (as described in the next section). This correction is somewhat larger than that implied by the mean completeness of % (Kelson et al., 2012), because groups and clusters are relatively dense environments that are difficult to sample with multislit spectroscopy. Figure 1 shows a color image of one representative group at along with spectral energy distributions (SEDs) of its four confirmed members. These galaxies are circled in white in the image, and with this particular color scale appear to have consistent colors. Three of the member galaxy SEDs look fairly similar, with primarily evolved stellar populations, while the fourth is blue and star forming. This illustrates the high fraction of massive evolved galaxies even in relatively poor groups at high redshifts.
3.2. Incompleteness and projection effects
Even with the redshift accuracy of CSI, two effects will introduce serious biases if not taken into account: spurious groups introduced by projected alignments of galaxies, and group members not included in the sample due to the minimum slit spacing of IMACS and yet-incomplete coverage. We correct for the latter effect by creating mock galaxy catalogs based on the target source density and flux distribution (i.e., that of all objects above the IRAC flux limit), and estimating the fraction of sources on which slits could be placed as a function of projected density. For a given region of the image, the underlying source number density is then approximated by .
To estimate the contribution of spurious groups due to chance projections, we assigned random redshifts to the galaxies in the sample (keeping the same distribution of source densities) and re-ran the group finding algorithm. Not surprisingly, the likelihood of chance projections decreases with increasing group mass since a higher concentration of galaxies in a given region is more likely to be a “true” group or cluster; this contamination fraction varies from 60% at the low end () to 10% for groups an order of magnitude more massive; over the full group sample the mean contaminant fraction is about 40%. We therefore only consider group stellar masses above , where the contribution from spurious groups is below 50%.
3.3. Calculating the cumulative group stellar mass functions
The CSI group catalog was conservatively selected from a galaxy sample which is complete to at for both red and blue galaxies. Calculation of the GrSMFs is therefore straightforward, simply a matter of summing the number of groups detected in mass and redshift bins and dividing by the effective survey volume (taking into account area not covered due to gaps between masks, bright stars, etc.). Above the adopted mass limit of groups above , there are 686 groups. We subdivided the sample into redshift bins , , and . Our cumulative GrSMFs are binned such that the first (highest-mass) bin contains three galaxies, and the number of groups in each successively lower-mass bin is incremented by either one or a multiplicative factor of 1.1, whichever is greater; this provides a roughly constant binning in at low masses. Finally, to correct for projection effects the GrSMF of the previously-described “randomized” (i.e. spurious) groups was calculated the same way and subtracted.
To check the concordance of these GrSMFs with those found in other studies at lower redshifts and higher masses, we adopted two complementary samples from the literature: the Sloan Digital Sky Survey (SDSS) group catalog by Yang et al. (2007), and massive X-ray selected clusters at and from the ROSAT All-Sky and 400 Degree (400d) surveys (Burenin et al., 2007; Vikhlinin et al., 2009a). 400d includes 36 clusters at and 49 at detected in 400 deg2 of ROSAT PSPC observations and followed up with Chandra to obtain total virial masses. To create a sample comparable to CSI, we chose a highly-restricted subset of groups from the Yang et al. (2007) “Sample II” catalog with at least two galaxies of between (the upper bound being the redshift where SDSS is complete at these masses), and calculated the cumulative group mass function. In contrast, the 400d survey provides an X-ray selected cluster sample given in virial, not stellar, masses. We therefore recomputed their mass functions in terms of using the volumes in Figure 11 of Vikhlinin et al. (2009a) and transformed their virial masses to stellar masses with the Giodini et al. (2009) relations.
If the group masses have substantial uncertainties, the observed mass function will be biased toward larger masses (due to the steepness of the GrSMF). This effect is small for SDSS and 400d, but significant for CSI which has relatively large mass errors. To correct for this, we convolved the SDSS mass function with CSI’s expected stellar mass error distribution, and thereby estimated the shift in the CSI GrSMF as a function of group stellar mass. All CSI GrSMFs were corrected accordingly, with a mass shift of dex.
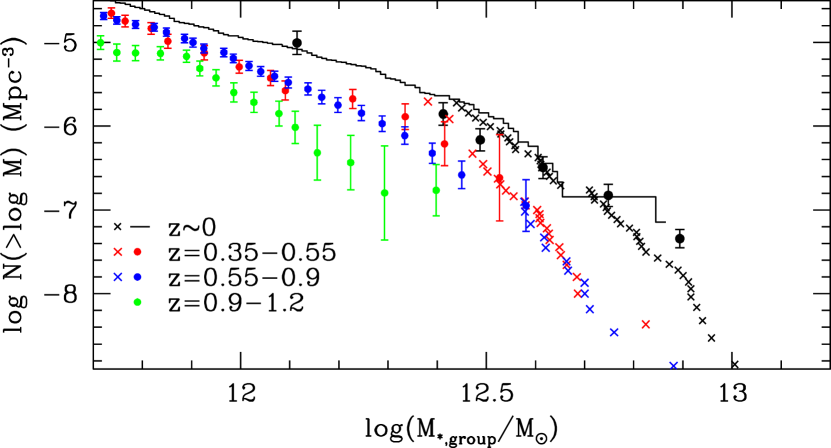
Figure 2 shows the CSI, SDSS, and Vikhlinin et al. (2009a) mass functions overplotted, all in terms of . As an additional check, we include the HIFLUGCS X-ray selected cluster mass function from Reiprich & Böhringer (2002), transforming their values to with relations given by Laganá et al. (2011) (which were specifically computed from HIFLUGCS). Poisson errors are shown on the CSI data points; cosmic variance is not included, but using the Trenti & Stiavelli (2008) Cosmic Variance Calculator we estimate it will add an additional 10-20% (greatest in the bin and at the highest masses) to the number density uncertainty; however, for the most part the Poisson uncertainties dominate. Despite the major selection differences, the SMFs of the optical and X-ray samples are in good agreement, suggesting that the adopted transformations from virial to stellar masses are reasonably robust.
4. Discussion
4.1. Concordance with massive X-ray selected clusters
The effective upper mass limit of our GrSMFs where we “run out” of volume are, in the realm of galaxy clusters, not particularly massive: at M⊙ (above which we only have 12 groups in our sample), in the literature they would typically be called “rich groups” or “poor clusters.” The lack of rich CSI clusters is simply a result of the limited area covered by CSI: while 5.3 deg2 (and the ultimate goal of 15 deg2) is very large for a galaxy survey, the richest, most massive clusters are rare enough that much larger areas are needed to find significant numbers of them at low to intermediate redshifts. As noted in the previous section, such samples are provided by large X-ray surveys covering hundreds of square degrees; here we have adopted the 400d survey (Vikhlinin et al., 2009a) as a principal comparison sample.
Figure 2 shows that the cluster mass functions of Vikhlinin et al. (2009a) (transformed to stellar masses by the Giodini et al. 2009 conversion factors) not only pick up more or less where CSI leaves off, but also represent a smooth continuation of the CSI GrSMFs to a factor higher mass. This is the first demonstration of the connection between group and cluster SMFs at these high redshifts. While not a particularly surprising result, it provides further evidence that our observing strategy and group selection methods are robust, and that the groups found by CSI bridge a key gap between individual galaxies and massive clusters in the distribution of dark matter halos. Although deep X-ray and IR observations provide compelling evidence of massive clusters at (McCarthy et al., 2007; Papovich et al., 2010; Rosati et al., 2009), no homogeneously-selected sample currently exists at these redshifts; indeed, the rapid decline in cluster abundances at high stellar masses seen in Figure 2 (if it is similarly steep at ) suggests that such objects are extremely rare. The most common progenitors of low- clusters must therefore lie at group masses at .
4.2. Hierarchical growth over the past 8 Gyr
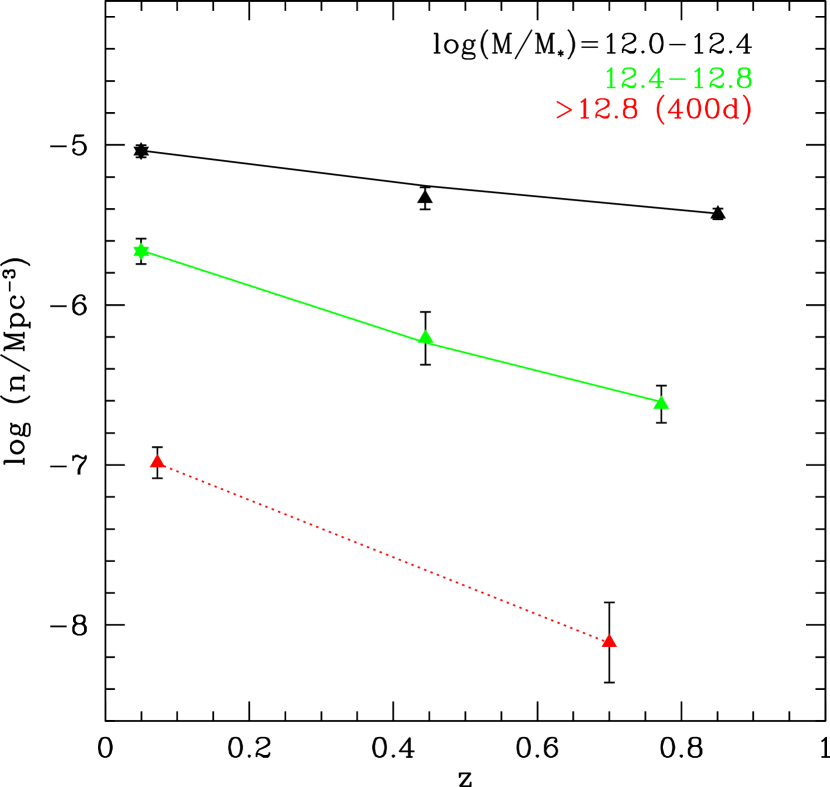
The combined CSI and 400d mass functions show strong evolution over the redshift range , with much of the evolution occurring between the and redshift bins. Similarly, there’s another significant increase in number density between the lowest-redshift bin of CSI and the groups and clusters. In the two lowest-redshift CSI bins there appears to be only marginal evolution between the mass functions; this may be a result of cosmic variance or residual mass uncertainties. Overall, however, the observed evolution appears to qualitatively reflect hierarchical structure formation: the ranks of massive groups and clusters () grow strongly over this redshift interval, while the number density of lower-mass groups is more constant (presumably because new groups are formed from below our mass limit as others merge into the more massive clusters). Although these hierarchical trends can be seen in the 400d cluster data alone, CSI and SDSS demonstrate that this growth continues to masses dex lower.
Due to the small number of high-mass clusters, the mass functions in Figure 2 are shown as cumulative number densities. To better illustrate the observed hierarchical growth, another projection of the GrSMF evolution is shown in Figure 3. Here the number densities of galaxies in three mass bins (two from CSI/SDSS and one from 400d) are shown as a function of redshift. The difference between low- and high-mass groups is striking: at the abundance of groups is relatively flat, but at masses dex higher the number density declines far more rapidly with increasing redshift. More quantiatively, we fit a power-law and find for groups with and at ; the difference in slopes is therefore significant at the level. X-ray clusters may exhibit marginally faster growth (), but due to the large uncertainties and potential systematics in their estimated stellar masses we cannot determine whether this steepening trend continues to .
5. Summary and future work
By employing low-resolution prism spectroscopy to obtain accurate redshifts for a mass-complete galaxy sample over 5.3 deg2, we have assembled the most comprehensive catalog of 686 galaxy groups down to a stellar mass limit of M⊙ and up to redshifts . The CSI GrSMFs follow a smooth continuation of the X-ray selected cluster mass functions of Vikhlinin et al. (2009a) when these are transformed to stellar masses. Most notably, the number density of high-mass groups and clusters increases more rapidly than low-mass groups; since the galaxies in these objects exhibit little ongoing star formation, hierarchical buildup through mergers and accretion must dominate their growth.
This result illustrates the power of large prism surveys like CSI to effectively bridge the gap between galaxy- and cluster-mass halos, allowing studies of an ubiquitous galaxy environment. As noted before, this result is based on an early sample comprising about one-third of the total CSI area and 25% of the expected spectra. While these early data provide a qualitative picture of hierarchical growth in group stellar mass, forthcoming CSI data which attain improved completeness over the full 15 deg2 area will allow us to robustly track the stellar-mass growth of groups and clusters, and for the first time directly test theoretical models in the gap between galaxy and cluster-mass dark matter halos. Additionally, deep X-ray observations (and/or stacks of existing shallower data) in the CSI fields will allow a direct comparison of stellar and virial masses for X-ray detected groups, providing an unprecedented window into the underlying halo growth.
References
- Berlind & Weinberg (2002) Berlind, A. & Weinberg, D. H. 2002, ApJ, 575, 587
- Burenin et al. (2007) Burenin, R. A., Vikhlinin, A., Hornstrup, A., et al. 2007, ApJS, 172, 561
- Cooper et al. (2007) Cooper, M. C., Newman, J. A., Weiner, B. J., et al. 2007, MNRAS, 376, 1445
- Crowl et al. (2005) Crowl, H. H., Kenney, J. D. P., van Gorkom, J. H., & Vollmer, B. 2005, AJ, 130, 65
- Dressler (1980) Dressler, A. 1980, ApJ, 236, 351
- Dressler et al. (2011) Dressler, A., Bigelow, B., Hare, T., et al. 2011, PASP, 123, 288
- Eke et al. (2004) Eke, V. R., Baugh, C. M., Cole, S., et al. 2004, MNRAS, 348, 866
- Farouki & Shapiro (1981) Farouki, R. T. & Shapiro, S. L. 1981, ApJ, 243, 32
- Giodini et al. (2009) Giodini, S., Pierini, D., Finoguenov, A., et al. 2009, ApJ, 703, 982
- Glazebrook & Bland-Hawthorn (2001) Glazebrook, K. & Bland-Hawthorn, J. 2001, PASP, 113, 197
- Grogin & Geller (2000) Grogin, N. A. & Geller, M. J. 2000, AJ, 118, 2561
- Huchra & Geller (1982) Huchra, J. P. & Geller, M. J. 1982, ApJ, 257, 423
- Kauffmann et al. (2004) Kauffmann, G., White, S. D. M., Heckman, T. M., et al. 2004, MNRAS, 353, 713
- Kelson et al. (2012) Kelson, D. D., et al. 2012, ApJ, submitted
- Koopmann & Kenney (2004) Koopmann, R. A. & Kenney, J. D. P. 2004, ApJ, 613, 866
- Laganá et al. (2011) Laganá, T., Zhang, Y.-Y., Reiprich, T. H., & Schneider, P. 2011, ApJ, in press (arXiv:1108.3678)
- Larson & Tinsley (1978) Larson, R. B. & Tinsley, B. M. 1978, ApJ, 219, 46
- Le Fevre et al. (2005) Le Fevre, O., et al. 2005, A&A, 439, 845
- Lilly et al. (1996) Lilly, S. J., Le Fevre, O., Hammer, F., & Crampton, D. 1996, ApJ, 460, L1
- Madau et al. (1996) Madau, P., Ferguson, H. C., Dickinson, M. E., et al. 1996, MNRAS, 283, 1388
- McCarthy et al. (2007) McCarthy, P. J., Yan, H., Abraham, R. G., et al. 2007, ApJ, 664, L17
- Papovich et al. (2010) Papovich, C., Momcheva, I., Willmer, C. N. A., et al. 2010, ApJ, 716, 1503
- Patel et al. (2009) Patel, S. G., Kelson, D. D., Holden, B. P., et al. 2009, ApJ, 694, 1349
- Patel et al. (2011) Patel, S. G., Kelson, D. D., Holden, B. P., Franx, M., & Illingworth, G. D. 2011, ApJ, 735, 53
- Rosati et al. (2009) Rosati, P., Tozzi, P., Gobat, R., et al. 2009, A&A, 508, 583
- Quadri & Williams (2010) Quadri, R. F., & Williams, R. J. 2010, ApJ, 725, 794
- Quadri et al. (2012) Quadri, R. F., Williams, R. J., Franx, M., & Hildebrandt, H. 2012, ApJ, 744, 88
- Reiprich & Böhringer (2002) Reiprich, T. & Böhringer, H. 2002, ApJ, 567, 716
- Trenti & Stiavelli (2008) Trenti, M., & Stiavelli, M. 2008, ApJ, 676, 767
- van den Bosch et al. (2008) van den Bosch, F. C., Aquino, D., Yang, X., et al. 2008, MNRAS, 387, 79
- van Dokkum et al. (2006) van Dokkum, P. G., Quadri, R., Marchesini, D., et al. 2006, ApJ, 638, L59
- Vikhlinin et al. (2009a) Vikhlinin, A., Burenin, R. A., Ebeling, H., et al. 2009, ApJ, 692, 1033
- Wilman et al. (2009) Wilman, D. J., Oemler, A., Jr., Mulchaey, J. S., et al. 2009, ApJ, 692, 298
- Yang et al. (2007) Yang, X., Mo, H. J., van den Bosch, F. C., et al. 2007, ApJ, 671, 153