The Globular Cluster Kinematics and Galaxy Dark Matter Content of NGC 3923
Abstract
This paper presents further results from our spectroscopic study of the globular cluster (GC) system of the group elliptical NGC 3923. From observations made with the GMOS instrument on the Gemini South telescope, an additional 50 GC and Ultra Compact Dwarf (UCD) candidates have been spectroscopically confirmed as members of the NGC 3923 system. When the recessional velocities of these GCs are combined with the 29 GC velocities reported previously, a total sample of 79 GC/UCD velocities is produced. This sample extends to over 6 arcmin (6 Re 30 kpc) from the centre of NGC 3923, and is used to study the dynamics of the GC system and the dark matter content of NGC 3923. It is found that the GC system of NGC 3923 displays no appreciable rotation, and that the projected velocity dispersion is constant with radius within the uncertainties. The velocity dispersion profiles of the integrated light and GC system of NGC 3923 are indistinguishable over the region in which they overlap. We find some evidence that the diffuse light and GCs of NGC 3923 have radially biased orbits within 130′′. The application of axisymmetric orbit-based models to the GC and integrated light velocity dispersion profiles demonstrates that a significant increase in the mass-to-light ratio (from M/LV = 8 to 26) at large galactocentric radii is required to explain this observation. We therefore confirm the presence of a dark matter halo in NGC 3923. We find that dark matter comprises 17.5 of the mass within 1 Re, 41.2 within 2 Re, and 75.6 within the radius of our last kinematic tracer at 6.9 Re. The total dynamical mass within this radius is found to be 1.51012 M⊙. In common with other studies of large ellipticals, we find that our derived dynamical mass profile is consistently higher than that derived by X-ray observations, by a factor of around 2.
keywords:
galaxies: general - galaxies: individual: NGC 3923 - globular clusters: general1 Introduction
The mass distributions and dark matter (DM) content of galaxies are of significant importance to the study of the formation and evolution of galaxies. The current cold dark matter (CDM) paradigm posits that dark matter is the dominant matter component found in the Universe, and hence drives the formation of structure throughout the history of the Universe. However making measurements of the actual distribution of DM with which to confront theory can prove to be difficult. In particular, measuring the DM distribution on the scales of individual galaxies can prove to be extremely trying for any galaxy type other than the most massive early-type galaxies (where significant X-ray emission is present) or later-type spirals (where gas emission can be traced to large radii to trace flat rotation curves, e.g. Persic et al. 1996). Intermediate to low mass early-type galaxies are of notable concern, as these galaxies usually lack significant X-ray or ionised gas emission, and generally lack readily observable tracers of the stellar kinematics at large radii (such as absorption line kinematics), due to the inherent faintness of the stellar populations at the radii where DM is expected to dominate (beyond 2Re). For these galaxy types then, the use of dynamical probes of the galaxy potential such as GCs and planetary nebulae (PNe) are of particular importance.
GCs are well suited to this type of study for several reasons: (i) their ubiquity around all relatively massive galaxies (e.g. see Peng et al. (2006) for Virgo Cluster galaxies); (ii) their extended distribution, that ensures significant numbers can be found beyond the radii at which the DM component becomes significant; (iii) and the fact that they are sufficiently luminous to be spectroscopically studied to large distances (30Mpc). In addition to providing determinations of the relative amounts of dark and baryonic matter, the study of the kinematics of large samples of GCs around early-type galaxies also provides other useful clues to their formation histories. In some galaxies for example, the GC system (or a subpopulation) is found to rotate with the galaxy (see below), perhaps indicative of a common formation history for the stellar component and the GC system.
The examination of the kinematics of GC systems is therefore an extremely promising area of research, with much to be learned about the processes that lead to the formation of currently observed galaxies. In recent years, a growing number of studies have made use of 8m class telescopes to build large samples of GC velocities around several early-type galaxies. In general, these have been of more massive cluster galaxies, known to harbour large GC populations. The project of which this study is a part intends to widen the host galaxy mass and environment range so far studied. To date, NGC 3379 (Pierce et al., 2006) and NGC 4649 (Bridges et al., 2006) have been studied. Both galaxies displayed GC velocity dispersion profiles that were constant with radius, a finding indicative of the presence of DM.
To these studies can be added investigations of the GC systems of NGC 1399 (Richtler et al., 2008; Schuberth et al., 2010), NGC 1407 (Romanowsky et al., 2009), NGC 4472 (Sharples et al., 1998; Zepf et al., 2000; Côté et al., 2003), NGC 4486 (Côté et al., 2001; Strader et al., 2011), NGC 4636 (Schuberth et al., 2006; Chakrabarty & Raychaudhury, 2008; Park et al., 2010), and NGC 5128 (Woodley et al., 2007) all of which have found similarly constant or slightly increasing GC velocity dispersion profiles, providing strong evidence for the existence of significant amounts of DM in these galaxies.
Examination of the GC systems of these galaxies for signatures of rotation like that displayed by the Milky Way metal-rich GC population has been less conclusive. Significant rotation has been observed in some galaxies (e.g. NGC 3115; Kuntschner et al. 2002; Arnold et al. 2011 and NGC 5128; Woodley et al. 2007) but little or none in others (e.g. NGC 1399; Richtler et al. 2008 Schuberth et al. 2010, NGC 1407; Romanowsky et al. 2009, NGC 3379; Pierce et al. 2006, NGC 4472; Zepf et al. 2000; Côté et al. 2003, NGC 4594; Bridges et al. 2007, and NGC 4649; Bridges et al. 2006). In the case of NGC 4486 early studies indicated significant rotation (Côté et al., 2001), but more recent analyses (Strader et al., 2011) indicate generally insignificant amounts of rotation. When GCs are split into blue and red subpopulations the picture becomes even more complicated. Generally it can be stated that the blue subpopulation displays a higher velocity dispersion than the red population, but beyond this the picture is confused with considerable variation from galaxy to galaxy.
The study of the orbits of the GCs has generally been stymied by the need for extremely large samples of GC velocities (see e.g. Merritt & Tremblay, 1993, who estimate that around a thousand GC velocities would be required to solve for both the mass distribution and orbital anisotropy simultaneously in the case of NGC 4486). Where fewer velocities are available, other input such as an X-ray profile can be used to constrain the potential, allowing the observed dispersion profile to be used to determine the GC orbits. In NGC 1399 and NGC 4472 the GCs display orbital characteristics close to isotropy, but in NGC 1407 (Romanowsky et al., 2009) and NGC 4649 (Bridges et al., 2006) there is some evidence of the GCs having more tangential orbits at certain radii.
This paper extends the study of the GC system of NGC 3923 described in Norris et al. (2008) to include an investigation of the kinematics of the NGC 3923 GC system. NGC 3923 is a large (Re of 53.4 arcsec, 4.6 kpc), nearby (D 21 Mpc) elliptical galaxy ( 0.3 - 0.4, Sikkema et al., 2007), with a prominent shell structure (Malin & Carter, 1983), and is the brightest galaxy of an average sized group. To date no studies have examined the GC kinematics of this galaxy, but several have probed the kinematics of the integrated light of NGC 3923. In Norris et al. (2008) diffuse light kinematics extracted from the same MOS slitlets as the GC spectra are used to confirm that the main body of NGC 3923 rotates along the major axis with a small amplitude of 30 kms-1. This result is consistent with the work of Koprolin & Zeilinger (2000), but in marginal disagreement with the work of Carter et al. (1998) that found no rotation around the major axis but slight rotation of amplitude 20 kms-1 around the minor axis. The only previous investigation to have studied the DM content of NGC 3923 is the X-ray study of Fukazawa et al. (2006), which found that the M/L in the B-band increased from 3.5 in the inner regions to around 15 at 18.4 kpc, a trend strongly supporting the presence of a DM halo associated with this galaxy.
2 Observations and Data Reduction
In this paper we continue the study of the GC system of NGC 3923 first presented in Norris et al. (2008). To the 29 NGC 3923 GC velocities previously determined from Multi-Object Spectroscopy (MOS) we add an additional 50 GC velocities measured using a combination of MOS and Nod-and-Shuffle (NS) observations.
As described in Norris et al. (2008), pre-imaging for GC candidate selection was undertaken for 3 fields (central, SW and NE) on 2004 January 19, comprising 4200 seconds in Sloan g, and 4100 seconds in r and i. Reduction of the imaging data involved bias subtraction, flat fielding, fringe removal (for i images), combining dithered sub-exposures to remove chip gaps, and finally removal of a median filter image (to remove the galaxy diffuse light). More details of the imaging reduction and object selection can be found in Forbes et al. (2004) and Bridges et al. (2006), with a full analysis of the imaging data from all galaxies studied in this project presented in Faifer et al. (2011).
A full description of the reduction and analysis of the deep MOS observations of the central pointing is provided in Norris et al. (2008). We present here data from an additional shallower (3hrs vs. 8hrs) MOS observation centred on NGC 3923 and three further NS observations. The shallower MOS observation was primarily focussed on studying the internal kinematics and stellar populations of a sample of UCDs discovered by Norris & Kannappan (2011). This MOS mask contained 33 slitlets, with those on UCD candidates being 0.5” wide and those on the fainter GC candidates 1.5” wide. The B1200 grating was employed providing resolution of 1.2 and 3.6 Å and coverage of 1490 Å generally centred around 5000Å (the coverage varies slightly based on the position of the slit on the mask). These newer MOS observations were reduced using the same tasks and procedures as outlined in Norris et al. (2008), and interested readers are referred there for further details. Hereafter we shall focus on describing the reduction of the NS spectroscopy.
GMOS NS masks were produced for each of the 3 fields of pre-imaging. The central field containing the largest number of targets was therefore studied three times, twice with MOS spectroscopy and once with NS. The NS masks contained a total of 44 (central field), 46 (SW field) and 48 (NE field) slitlets, each 1 arcsecond wide by at least 2.25 arcseconds long. The majority of the slitlets per mask (30-35) were placed on GC candidates, with the remaining slitlets placed on other objects of interest to fill up the mask. Each NS mask was exposed using the B600G5303 grism for 41800 seconds at a central wavelength of 505 nm and 41800 seconds at a central wavelength of 510 nm, yielding 4 hours of on-source integration per mask. The spectra were exposed through the gG0325 and GG455G0329 filters to restrict the wavelength coverage to a well-defined bandpass of 4600-5550Å. This restriction in wavelength coverage allowed more freedom in the positioning of slitlets and hence in choice of targets, as spectra could be aligned in the spatial dimension without overlapping. The wavelength coverage of each spectrum was still sufficient to cover most of the strong absorption lines found in optical spectra and includes the most important lines for such studies, H, Mg, Fe5270 and Fe5335. Bias frames, flat fields and copper-argon (CuAr) arc spectra were observed throughout the observations as part of the standard Gemini baseline calibrations.
The reduction of the NS spectra was accomplished using the standard Gemini/GMOS packages in IRAF, a brief description of which shall be given here to help illustrate the benefits and problems associated with using this technique for GC studies. In NS spectroscopy the target is placed at one end of the slit, it is exposed as normal for a period of time, and the telescope is then nodded to a sky position whilst shuffling the charge on the CCD between science and un-illuminated storage regions. The image that results contains two spectra - one of the object and one of the sky, both of which importantly were obtained on exactly the same pixels after traversing identical optical paths. Therefore, when subtracting the sky spectrum from the object spectrum, effects such as flat-fielding errors, fringing, and variation in the sky cancel out more accurately than in standard sky subtraction procedures. In the case of the data here, a small offset was applied in the nodding procedure so that the object appears in both the science and the sky spectra, only at different ends of the slit. To produce these spectra, the standard reductions for Gemini/GMOS IRAF NS tasks were used to provide bias subtraction, flat fielding, extraction of each spectra pair into separate extensions, and wavelength calibration. At this point it is possible to shift one spectrum up to overlap with the other, so that the sky region of one spectrum is over the target spectrum of the other. Subtracting one spectrum from the other then produces a sky subtracted target spectrum pair, where one spectrum is negative and the other positive. It is then a simple matter to trace and extract each spectrum as normal and combine each exposure together (remembering to flip the negative spectra to positive ones) to produce the final 1D spectrum.
In theory, the use of the NS method should have one major advantage over standard MOS observations: the ability to pack more objects onto each mask. This is because the improved sky-subtraction accuracy relative to MOS observations means that shorter slitlets are required to determine equivalently accurate sky spectra. In the specific case of the data presented here, this increase in efficiency was not achieved due to significant issues with the GMOS instrument in NS mode. In particular the GMOS CCDs exhibit small regions that do not allow the charge to move freely through them during the “shuffling” part of the NS procedure. These “charge traps” cause trails of charge deficit. The net effect of these charge traps is that they lead to artifacts in the final extracted 1D spectra that are indistinguishable from absorption features. Several methods have been developed to deal with these traps (see for example Abraham et al. 2004). However, no method is straightforwardly applicable to the data available here, as they generally require additional steps during the observations. Hence, these charge traps make some regions of the GMOS CCD unusable in the present case, leading to the unfortunate loss of up to 25 (10 objects) of the spectra per mask.
2.1 GC Velocity Determination
As in Norris et al. (2008), the recessional velocities of the GC candidates were measured using the FXCOR task in the RV package of IRAF. This task carries out a fourier cross correlation between the object spectra and a spectral library. In this case no radial velocity standard stars were observed as part of this project, therefore theoretical template spectra from the simple stellar population library of Vazdekis (1999) were used as templates. As described in Norris et al. (2008) a further 6 stellar spectra from the Jones (1997) library were added to ensure adequate coverage of the low-metallicity region. Hence the template spectra spanned a range in metallicity from [Fe/H] -1.5 to +0.2 and in age from 1-18 Gyr. The quoted velocity for each object is the 3- clipped mean of the velocities derived from the FXCOR fits to each template; the errors are estimated from the mean of the errors measured by FXCOR for those velocities not clipped. Only GC candidates where at least half of the templates returned Tonry and Davis R value greater than 5 and velocities within 3- of the mean are considered further. This ensures that only reliable velocities are included in our analysis, and is a necessary step since only a few erroneous velocities can lead to significant changes in the inferred properties such as velocity dispersion (see e.g. Strader et al., 2011).
Objects with velocities in the range 1100-2500kms-1 (Vgal 700 kms-1, or 3- of the GC velocity dispersion) are assumed to be associated with NGC 3923. This is marginally different to that quoted in Norris et al. (2008), where 1200-2400 kms-1 was used. In practice, however, this makes no difference to the selection of objects classified as GCs in Norris et al. (2008), as no additional objects from the deep MOS observations would fall into this wider velocity range. The wider velocity range does however allow one additional NS object to be included in the present sample.
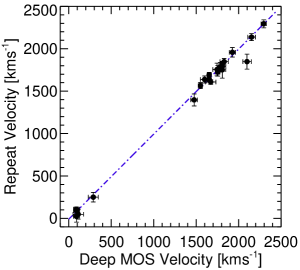
A total of 24 objects were examined with both the deep MOS and shallow MOS or NS allowing an examination of the robustness of the measured velocities and their errors. Figure 1 displays the velocity measured using the shallow MOS or NS observations, versus the velocity measured using the deep MOS observations for 24 objects that were observed twice. As can be seen, the agreement between the two measurements is exceptionally good, with the best fit linear relation between the two sets of observations being consistent with no offset between the two methods. This good agreement allows the simple weighted averaging of velocities measured using both techniques in the case of overlaps.
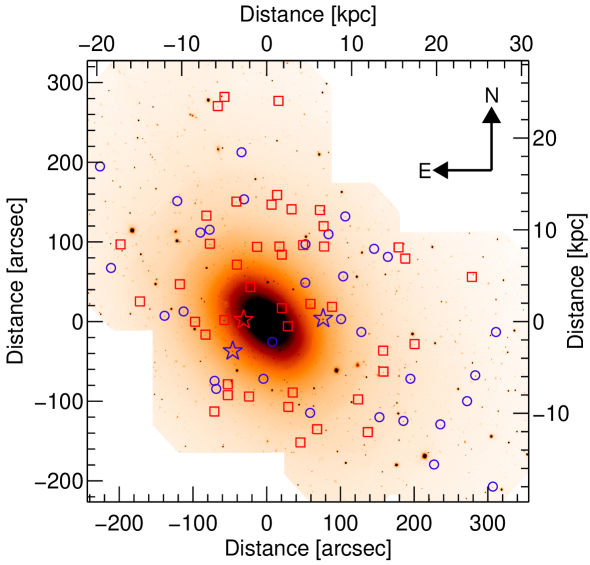
In the few cases where NS targets were observed on two separate NS masks but no velocity was recovered, the spectra were coadded and then velocity measurement reattempted. However, in no case were any additional velocities recovered. In total, after combination of repeat observations, 79 secure velocities were determined. The spatial distribution of these 79 GCs and UCDs, separated into blue and red subpopulations as described in Section 3.1, can be seen in Figure 2. Table LABEL:tab:ngc3923gckin provides the positions, photometry (from Faifer et al., 2011) and velocities for the 79 objects confirmed as NGC 3923 GCs.
3 Results
3.1 GC Colours
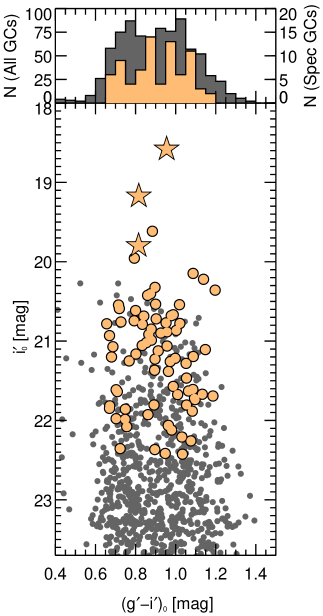
In this subsection we examine the photometry of the NGC 3923 GCs in order to be able to robustly separate the GCs into blue and red subpopulations. Figure 3 displays the colour-magnitude diagram for all candidate GCs/UCDs detected in the GMOS preimaging (grey dots), as found by Faifer et al. (2011). Additionally, the 79 spectroscopically confirmed GCs/UCDs are overplotted as large filled orange circles/stars. In the upper panel of Figure 3 the respective histograms of g-i colour for each of the two samples (all potential GCs/UCDs and spectroscopically confirmed GCs/UCDs) are also displayed.
It can be seen from Figure 3 that a significant fraction of the brightest GC candidates were not spectroscopically observed. This is largely due to problems placing pairs of slitlets because of potential spectral overlaps. Other potential GC candidates could not be observed or were subsequently lost because the GCs were located too close to the galaxy centre, or because the spectra were unusable due to the previously described problems with the NS observations.
The histogram of the full GC candidate sample displays a dip at around g-i 0.87 characteristic of the existence of a bimodal colour distribution. In their comprehensive analysis of the GC photometry Faifer et al. (2011) find unambiguous bimodality in the colours of the GCs of NGC 3923 (with a dividing colour of g-i = 0.89), in line with other studies of NGC 3923 using both ground based (Zepf et al., 1995), and HST photometry (Sikkema et al., 2006; Cho, 2008; Norris & Kannappan, 2011). Importantly however, Faifer et al. (2011) find that bimodality is strongest for the fainter GCs and disappears for the brightest GCs. This result can be interpreted as evidence for a blue tilt (e.g. Strader et al., 2006; Mieske et al., 2006; Harris et al., 2006; Peng et al., 2009; Forbes et al., 2010) in the colours of the blue GC population of NGC 3923, where the disappearing bimodality is simply due to the merging of the blue GCs into the red locus at high luminosities.
The presence or absence of a blue tilt in the NGC 3923 GC system is important. As it is only possible to measure velocities for the most luminous GCs (see Figure 3), significant numbers of “red” GCs may actually have formed as part of the blue subpopulation. Therefore, studies of the kinematics of GC subpopulations may suffer significant bias in their derived properties, due to contamination of the red population by members of the blue population. Unfortunately, with the relatively limited dataset on hand, it is not possible to carry out a more sophisticated separation of blue and red population GCs (perhaps by allowing a sloping separation in colour-magnitude at higher luminosity). Consequently, in all analyses to follow, where necessary the GCs/UCDs are separated using g-i = 0.89. This separation divides our total sample of 79 objects into subsamples of 34 blue and 45 red objects.
3.2 GC Spatial Distributions
The spatial distributions of GC subpopulations provide useful clues to their formation, as well as being essential inputs into the dynamical models to be described in Section 3.6.
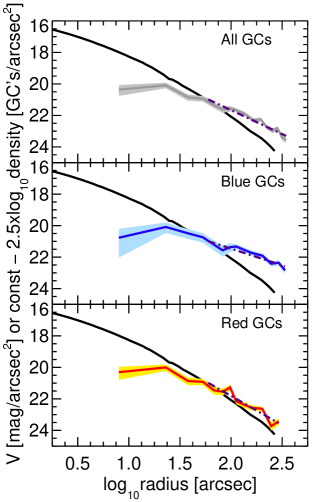
Figure 4 displays the GC surface density profiles of the total, blue, and red samples for the full photometrically selected sample from Faifer et al. (2011). The profiles were constructed by normalising GC number counts from HST ACS imaging of the inner regions (because it had higher completeness than the GMOS imaging in the inner region) to the wider field GMOS imaging in an overlap region of radius 60 to 90 arcsecs. The profiles were determined in circular annuli, as no significant evidence of ellipticity in the GC system was found. They were also corrected for areal incompleteness, to take into account the arrangement of the GMOS imaging pointings. In each panel of Figure 4 the profiles have been normalised to match the NGC 3923 V-band surface brightness profile at 60 arcsec, allowing direct comparison between the GC and NGC 3923 diffuse light distributions.
It can be seen that the red GCs are more centrally concentrated and have a steeper number density profile than that of the blue GCs, a result common to many studies of the GC systems of early-type galaxies (see e.g. Lee et al., 1998; Côté et al., 2001; Forbes et al., 2004; Tamura et al., 2006; Harris, 2009; Forte et al., 2011). The red GC distribution is also similar to that of the diffuse light of NGC 3923, again a common finding, at least for the innermost regions of early-types (Forbes et al., 2004; Tamura et al., 2006; Lee et al., 2008; Bassino et al., 2008). The slight remaining offset in slope between the red GCs and the diffuse light of NGC 3923 can most likely be explained as being due to interloping blue GCs that act to reduce the red GC slope.
The effect of contamination of one GC subpopulation by the other has not been discussed in great detail in the literature. However, Forte et al. (2007) do discuss the possibility of contamination of the blue population between the blue peak and colour valley, by red GCs, in the galaxies NGC 1399 and NGC 4486.
The mixing of blue GCs into the red sample due to the blue tilt is also likely at work in the observation by Sikkema et al. (2006) that the colour profile of the red GCs is similar to that of the diffuse light of NGC 3923, but is offset toward the blue by around 0.05 mag. This interpretation is supported by the results of Faifer et al. (2011), where the use of Gemini/GMOS g and i photometry allows a better separation of the two populations, resulting in a red GC colour profile that exactly matches that of the NGC 3923 galaxy halo light. Such a close correspondence between the colours of the red GCs and the underlying integrated light is not unexpected. In Norris et al. (2008) the stellar population parameters of the diffuse light of NGC 3923 (at large radii) are found to be indistinguishable from those of the red GCs. This result is consistent with the case of the edge-on S0 NGC 3115, where the stellar populations of the bulge component at 2Re (measured along the minor axis), are likewise indistinguishable from those of the red GCs (Norris et al., 2006).
3.3 Kinematic Analysis
Figure 5 shows a histogram of the velocities of all 79 confirmed GCs/UCDs, and for the blue (34), red (45), and brightest (15 objects with MV -10.5) subpopulations separately, divided as described in Section 3.1. As can be seen from Figure 5, unlike in our studies of NGC 4649 (Bridges et al., 2006) or NGC 3379 (Pierce et al., 2006), the recessional velocity of NGC 3923 (1800 kms-1) is sufficiently high that contamination from Milky Way stars can be ignored. An examination of the environment around NGC 3923 also demonstrates that contamination of the sample by GCs associated with nearby neighbour galaxies is likely to be negligible. Therefore it is assumed that all 79 objects with velocities between 1100 and 2500 kms-1 are GCs/UCDs associated with NGC 3923.
We choose to include in our sample the three UCDs discovered around NGC 3923 by Norris & Kannappan (2011) (including NGC3923-UCD3 which we spectroscopically confirm here). We do this because the preponderance of the evidence is that these UCDs formed alongside the GCs of NGC 3923, and are merely the most massive members of the NGC 3923 GC system. The evidence for this is compelling; the UCDs luminosities and frequencies are consistent with being members of the NGC 3923 GCLF, the multiplicity of UCDs (at least 3, with 2 further high probability candidates just within the coverage of our GMOS imaging) makes a stripping origin unlikely, and most importantly their stellar populations are indistinguishable from those of the GCs of NGC 3923 (Norris & Kannappan 2011, Norris et al. in prep).
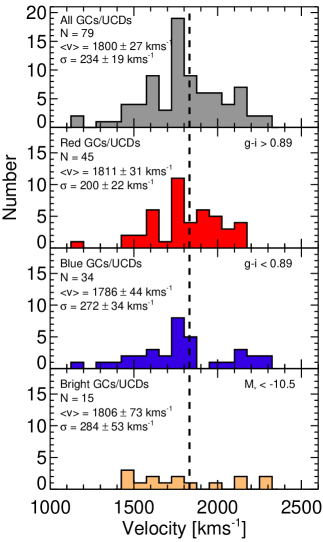
Overplotted on Figure 5 are the mean velocity and velocity dispersion of the various GC samples. The mean velocities of the blue and red subsamples differ by 25 kms-1, however, this difference is not statistically significant given the 54 kms-1 uncertainty, and likely reflects small number statistics. Likewise, while the blue GCs appear to have a higher dispersion than the reds (the difference is 72 40 kms-1), this result is also not significant given the present sample size. The observation that the two GC subpopulations have similar, or only marginally different velocity dispersion, is common to many studies of early-type GC kinematics (see e.g. Beasley et al., 2004; Richtler et al., 2004; Woodley et al., 2010). Nevertheless, if increased statistics were to show that the blue GCs do indeed display a higher velocity dispersion this would not be unexpected, NGC 1399 (Schuberth et al., 2010), NGC 4472 (Zepf et al., 2000; Côté et al., 2003) and NGC 4636 (Park et al., 2010) all have blue GC subpopulations which are kinematically hotter than the red subpopulations. A higher velocity dispersion for the blue clusters could be explained naturally if some of the blue population are actually intra-cluster/intra-group GCs, or were accreted from dwarf galaxies stripped by the current host.
Most interesting is the behaviour of the most luminous NGC 3923 GCs and UCDs. The bottom panel of Figure 5 demonstrates that unlike the case for the full sample, the most luminous objects show no preference for velocities close to the systemic velocity (similar to the behaviour seen in the M87 GC/UCD system by Strader et al., 2011). This observation can have two possible explanations: 1) That the luminous GC population is significantly contaminated by objects which are not NGC 3923 GCs, such as UCDs formed by the stripping of dwarf galaxy nuclei. 2) That the most luminous GCs have orbits which differ from less luminous GCs, perhaps due to the preferential destruction through dynamical friction of massive (and more extended) GCs on orbits which bring them close to the centre of NGC 3923. Given the small numbers currently on hand it is hard to definitively prove which explanation is the correct one. However, we believe that 1) is unlikely, given the fact that it would likely require a significant fraction of the luminous NGC 3923 GCs to be interlopers.
In the following analysis, NGC 3923 is assumed to have an effective radius (Re) of 53.4 arcsec, as reported by Fukazawa et al. (2006) and originally determined by Faber et al. (1989) in the B band. The use of this value, which differs from the value of 43.8 arcseconds (as measured in the J-band) quoted in Norris et al. (2008), allows consistency between the present study and the X-ray one of Fukazawa et al. (2006). Therefore, using this value of Re our last measured tracer is located at 6.9 Re. The measurement of GC kinematics at such large radii is important, because at these radii the mass of the stellar component should be negligible. This makes the detection of a DM component much simpler than in the inner regions of galaxies, where the baryonic component dominates.
Figure 6 displays histograms that highlight the distributions of azimuthal angle and galactocentric radius of the 79 GCs. As expected from examination of Figure 2, there is a slight dearth of kinematically confirmed GCs located directly along the major axis of NGC 3923 (located at PA = 48∘). It appears that this deficit is due to the combination of a slight underdensity of candidate GCs in this region (as seen in Fig. 1 of Faifer et al., 2011) combined with the previously discussed problems of placing slitlets due to overlaps. The group of objects located at around 0∘ would produce spectra which overlapped with any placed at around 50∘. The histogram of galactocentric distance demonstrates that velocities have been measured for GCs located at large galactocentric radii, up to 370 arcsec.

3.4 Rotation of the GC system of NGC 3923
The rotation of the GC system of NGC 3923 has been examined using the procedure
outlined in Norris et al. (2008). A non-linear least squares fit was carried out to the equation:
| (1) |
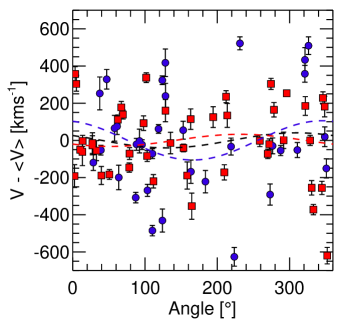
where Vrot is the amplitude of the GC rotation, is the azimuthal angle, is the position angle of the line of nodes, and V0 is the recessional velocity of NGC 3923. This procedure was carried out for each of the three GC samples; total, red subpopulation, and blue subpopulation. In practice the value of V0 was allowed to vary between samples. However the overall effect of this was small, as the mean velocities of the three groups varied by less than 10 kms-1. The GC mean velocity (1802 17 kms-1) and systemic velocity of NGC 3923 as determined by Carter et al. (1998) (1832 3 kms-1) differ by 30 kms-1. This means that using the GC mean velocity instead of the systemic velocity could be masking some rotation. To assess whether or not this effect is significant, the rotation of the total sample was re-estimated using the mean GC velocity 30 kms-1, in neither case was the result significantly changed. Figure 7 shows the best fit rotation curves derived using this procedure, in all three cases no significant detection of rotation is made.
The lack of rotation observed in the GC system is consistent with the similarly small amount of rotation found for the integrated light of NGC 3923, either found using velocities determined from the deep MOS observations presented in Norris et al. (2008), or in smaller radii longslit studies by Carter et al. (1998) (which extended to 40 arcsec) and Koprolin & Zeilinger (2000) (which extended to 25 arcsec). A lack of significant rotation is also a commonly observed feature of the GC systems of large early-type galaxies, as discussed in Section 1.
The lack of any significant differences in the observed kinematics of the GC subpopulations, and the high probability of contamination of the “red” GCs by blue subpopulations members lead us to focus on the total GC population in all that follows.
3.5 Velocity Dispersion
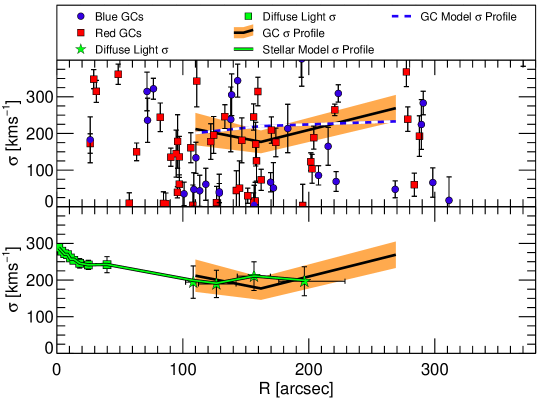
Figure 8 presents the radial profile of the velocity dispersion of the NGC 3923 diffuse light (green squares and stars) and total GC system (black line). The velocity dispersion of the GCs was estimated using the lowess estimator (Gebhardt et al., 1994; Gebhardt & Fischer, 1995), which estimates the velocity variance at each datapoint by fitting a least squares linear fit to the individual points in a kernel (essentially in radius) around the point in question. Each datapoint in the fit is weighted by the inverse square of the distance between the point being fitted and the others within the kernel. The velocity dispersion is simply estimated as the square root of the variance measured by the lowess method. As a consistency check, this method was compared with the velocity dispersion estimations produced by a maximum likelihood method; for any reasonable bin size (minimum number of GCs per bin 15), the maximum likelihood method recovered velocity dispersions did not differ significantly from those found using the lowess method.
The observation that the velocity dispersion profile of the NGC 3923 GCs is approximately constant, or slightly rising at larger radii, is a general finding in studies of the GCs of early type galaxies, as was discussed at length in Section 1.
Of particular interest in Figure 8 is the fact that the velocity dispersions of the integrated light of NGC 3923 determined from MOS slitlets using the method outlined in Norris et al. (2008) (green stars) are consistent with the velocity dispersions of the GC system at the same radii. The implications of these results are best understood through the examination of simple dynamical models of NGC 3923.
3.6 Dynamical Models
We use the axisymmetric, orbit-based modeling algorithm described in Gebhardt et al. (2000); Gebhardt et al. (2003), Thomas et al. (2004); Thomas et al. (2005) and Siopis et al. (2009). These models are based on the method of Schwarzschild (1979), and similar models are presented in Richstone & Tremaine (1984), Rix et al. (1997), Cretton et al. (1999), Valluri et al. (2004), Cappellari et al. (2006).
The modelling procedure consists of the following: (i) the surface-brightness distribution is deprojected into a 3d luminosity profile; (ii) a trial gravitational potential is calculated including the contribution from the stars and a dark matter halo; (iii) a large set of orbits is run in the trial potential; (iv) an orbit superposition model of the galaxy in the trial potential is constructed that matches the kinematical data subject to the constraints given by the 3d light profile and the trial potential; (v) steps (ii)-(iv) are repeated for a large variety of trial mass profiles. A -analysis then determines the best-fit model and its uncertainties.
Due to the difference in the slopes of the profiles (surface brightness for stars and number for GCs), we model the stars and GCs separately, and then sum their as a measure of the quality of the fit for the given mass profile. Thus, the only addition to the above procedure is that, in step (iv), we fit a different set of orbital weights for stars and clusters. Each model is also constrained by the surface brightness/number density profile of the particular tracer. In this case we use the observed V-band surface brightness profile for the diffuse light of NGC 3923, and the observed total GC sample number density profile as shown in Figure 4 and discussed in Section 4. Both stars and GCs are assumed to share the same flattening of = 0.4, consistent with the E4-5 classification and the measured ellipticity of NGC 3923 found by Sikkema et al. (2007).
The NGC 3923 models use a polar geometric layout as follows. We use 20 radial bins and 5 angular bins for the spatial sampling, and 15 velocity bins. The radial spatial binning ranges from 1 arcsec in width at small radii up to 50 arcsec in the outer bins. The 5 angular spatial bins are equally spaced in sin(), where is measured from the major axis to the pole (i.e., angular bins are smaller closer to the major axis). The velocity bins are 100 kms-1 wide. The average number of orbits per model is 40,000. The orbital sampling follows the design in Thomas et al. (2004); Thomas et al. (2005).
We fit for three parameters that determine the mass profile; these are the stellar M/L assumed constant
with radius, the dark halo scale radius, and the dark halo density at .
To represent the dark matter profile, we use a spherical cored logarithmic profile given as:
| (2) |
where is circular velocity at the core radius, (Binney & Tremaine, 1987).
Thomas et al. (2005), Forestell & Gebhardt (2010), and Murphy et al. (2011) find that a cored logarithmic profile provides a better fit or at least as good a fit as an NFW profile. Given that we do not have kinematic data at large radii in large enough quantity to explore the various dark halo parameterizations, we only consider the one model. In all models, we include a black hole of mass 1108 M⊙, which is the mass derived from its correlation with velocity dispersion (Gültekin, 2010); the value of the black hole mass will not affect the dark matter profile and we only include it for completeness.
The results of this fitting procedure are displayed in Figures 8, 9 and 10. The best fit M/LV in the central region is 8, identical to that found for NGC 4649 by Bridges et al. (2006) and Shen & Gebhardt (2010), and close to the M/LV of 6 found for NGC 3379 by Pierce et al. (2006). Mass-to-light ratios as high as these, while large, are only moderately inconsistent with the predictions of stellar population synthesis models for such old stellar populations (as the star symbols in the right panel of Figure 10 demonstrate).
In the upper panel of Figure 8 the white and blue dashed line displays the best-fit model GC velocity dispersion profile. The fact that a model constrained by both the diffuse light velocity dispersion, and the GC kinematics (plus their respective number density profiles), is still able to successfully reproduce the observed GC velocity dispersion profile is reassuring.
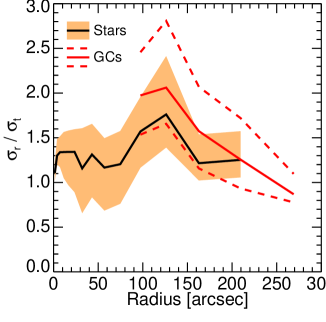
In addition to determining the best-fit mass profile, orbit-based models provide a measure of the internal orbital structure. Figure 9 presents the ratio of the radial to tangential internal velocity dispersion. We present this ratio for both the diffuse light (solid black line), and GCs (solid red line) of NGC 3923. In general, the large uncertainties prevent any strong conclusions on the orbital behaviour of the GCs and diffuse light. However, to first order the profiles of both appear to be mildly radially biased at all but the largest radii. Additionally, the GCs and diffuse light of NGC 3923 appear to show similar behaviour over the region of overlap. Beyond a radius of around 130′′ both the GCs and diffuse light appear to become more isotropic (/=1).
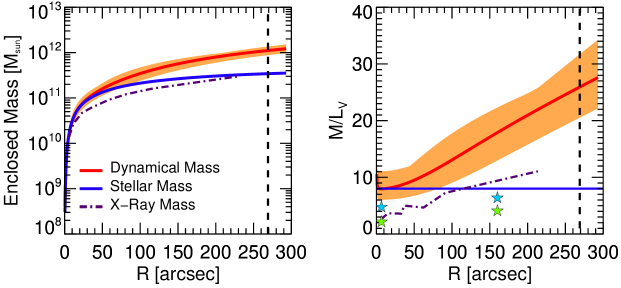
In the left panel of Figure 10 the inferred enclosed mass profiles are displayed. Of immediate interest is the fact that the mass profile determined from X-ray observations by Fukazawa et al. (2006) is around a factor of two less than our total dynamical mass profile, though with similar slope at larger radii. In fact, the X-ray mass profile is lower than even our stellar only model (blue line). Therefore the disagreement cannot be due to differences in the derived DM halos of the models. However, the stellar mass and the X-ray mass profile could be made to agree, if a less extreme M/LV of around 5 was chosen (which would also be more consistent with stellar population models), though this would then be inconsistent with the observed velocity dispersion of the integrated light and GCs of NGC 3923.
Discrepancies of similar magnitude between X-rays and GCs have been found in NGC 4636 (Johnson et al., 2009), NGC 1407 (Romanowsky et al., 2009), and NGC 4649 (Shen & Gebhardt, 2010). In fact disagreements between different dynamical tracers within the same galaxy are a general result of studies of galaxy dynamics. In particular, PNe commonly indicate the presence of little or no DM in galaxies in which other tracers detect significant quantities e.g. in NGC 821 PNe (Romanowsky et al., 2003; Teodorescu et al., 2010) indicate little or no DM present, while stellar kinematics (Weijmans et al., 2009; Forestell & Gebhardt, 2010) indicate between 13 and 18 of the mass of NGC 821 is DM within Re. As all dynamical tracers have their own strengths and weaknesses, only by combining several different tracers within a galaxy can we hope to achieve robust results.
The best-fit parameters to our cored logarithmic profile are =450 50 kms-1, and rc=11 4 kpc. The best-fit model has =22. For the stellar kinematics, we only use the dispersions measured in 13 circular apertures at various radii from 1.5″to 200″. As discussed previously, we do not find significant rotation. For the globular clusters we use three spatial bins, and for each bin we consider both the velocity and velocity dispersion. Thus, the total degrees of freedom is 19. The reduced of 1.16 suggest that the dynamical model well represents the data. For the uncertainties, we rely on those models within a set value. We report 68% confidence values, where we have marginalized over the other parameters; thus, the 1-sigma values in this case come from . The confidence bands in Fig. 10 represent the range in models that are within this .
Our best fit cored logarithmic model returns an enclosed dark matter fraction of 17.5 within Re, which rises to 41.2 within 2Re. At the limit of our kinematic coverage (370 arcsec, 6.9 Re) dark matter comprises 75.6 of the mass of NGC 3923. This distribution of dark matter is similar to that measured in other massive early types using stellar absorption line kinematics or dynamical tracers, e.g. M87 (17.2 DM within Re, Murphy et al., 2011), NGC 821 (13 - 18 DM within Re, Weijmans et al., 2009; Forestell & Gebhardt, 2010), NGC 4594 (19 DM within Re, Bridges et al., 2007), or 17 early-type galaxies in the Coma cluster (10-50 DM within Re, Thomas et al., 2007). It is however slightly inconsistent with other studies which have found larger DM fractions using either SAURON observations (median DM fraction 30 within Re, Cappellari et al., 2006) or observations of strong gravitation lenses (38 DM within Re, Bolton et al., 2008).
The right panel of Figure 10 shows the behaviour of the M/LV profile of NGC 3923. At the limit of the binned data (269 arcsec) the inferred M/LV of 25.9 is inconsistent with the constant M/LV (of 8) at the 3.3 level. This again confirms the existence of significant amounts of DM in NGC 3923.
4 Discussion
An examination of the GC radial velocities has not detected any significant rotation in the NGC 3923 GC system. This finding means that the GCs display similar behaviour to the integrated light of NGC 3923 which also has little or no rotation (e.g Carter et al., 1998; Koprolin & Zeilinger, 2000; Norris et al., 2008). This lack of rotation in the GC systems of massive early-type galaxies is not uncommon, with little or no rotation observed in the GC systems of NGC 4649 (Bridges et al., 2006), NGC 1399 (Richtler et al., 2004; Schuberth et al., 2010), NGC 3379 (Bergond et al., 2006), NGC 4472 (Zepf et al., 2000; Côté et al., 2003), and NGC 4594 (Bridges et al., 2007). Some GC systems however do display significant rotation, for example NGC 5128 (Woodley et al., 2007) and M87 (Côté et al., 2001). The cause of this variation may be partly due to projection effects. Nevertheless the current observations do not fit comfortably with theoretical simulations of galaxy formation. These simulations tend to predict that significant amounts of angular momentum should be found in the outer regions of galaxies, especially in cases where the galaxies formed in major merger events in the relatively more recent past (i.e. z 3, Vitvitska et al., 2002).
To explain this disagreement it may be possible to call on angular momentum transport to move the angular momentum beyond the radii to which current GC studies are presently sensitive; only an extension of these studies to even larger galactocentric radii would be able to determine if this is indeed the case. This would most likely prove impossible for all but the most massive galaxies with the richest GC systems, as smaller galaxies simply would not have enough GCs at sufficiently large radii to make such a measurement possible.
Turning to the velocity dispersions of the GCs and integrated light of NGC 3923 reveals that these also display indistinguishable behaviours over the range where they can both be measured (see Fig. 8). It is also intriguing that the value of the observed constant velocity dispersion of 200 kms-1 is indistinguishable from the dispersion measured for the NGC 3923 group as a whole by Brough et al. (2006), using the redshifts of all 30 group members. It should be noted however, that there are indications that the integrated light velocity dispersion may in fact be closer to that of the red GC subsample, rather than the system as a whole. The weighted mean of the integrated light velocity dispersion for the four largest radii points is 198 9 kms-1, consistent with the 200 22 kms-1 found for the red GCs (Figure 5), but marginally inconsistent with the velocity dispersion of the blue GCs of 272 34 kms-1. This is compatible with the halo-GCs connection discussed in Forte et al. (2007, 2009), in the sense that most of the galaxy halo light is contributed by the diffuse stellar population associated with these red subpopulation clusters. Nonetheless this is not to say that the kinematics of red GCs alone would be a preferable tracer of the mass profile of NGC 3923. In principle, with a sufficient sample size, and hence the correct number profile and orbital information red and blue GCs should give the same mass profile.
Because of the difficulty of measuring stellar absorption line kinematics to large radii in early type galaxies, very few studies have been able to directly compare GC and integrated light kinematics over the same radii. However, Schuberth et al. (2010) found that the red GCs and integrated light of NGC 1399 likewise display similar velocity dispersions over their common range of study. If this finding proves to be a general result of studies of GC kinematics it will provide a very important clue to the formation history of galaxies. Such a close correspondence in kinematics, combined with the observed similarities in distribution (see Figure 4 and Section 3.2), colours (see Forbes & Forte, 2001; Sikkema et al., 2006), and stellar populations (see Norris et al., 2008), indicate a common formation for the red GCs and diffuse light of NGC 3923.
The observation that the velocity dispersions of the GCs and integrated light of NGC 3923 are constant at larger radii, despite the rapidly declining number density/surface brightness, is already strong evidence for the existence of significant amounts of DM in this galaxy. Our orbit-based models confirm that NGC 3923 has dark matter fractions consistent with those found in other studies of early type galaxies using integrated light or GC dynamical tracers.
The observation that our estimates of dynamical mass (and hence M/LV) are larger than those made with X-ray observations is intriguing. Shen & Gebhardt (2010) find discrepancies of similar magnitude and in the same sense in their study of NGC 4649, as do Murphy et al. (2011) for their study of the stellar kinematics of M87. In contrast, Johnson et al. (2009) find disagreement in both senses in the same galaxy, NGC 4636, where within 10 kpc they find the GCs indicate twice as much mass as the X-rays, between 10 and 30 kpc GCs and X-rays agree, and then beyond 30 kpc X-rays indicate 4-5 times as much mass as the GCs. Like Shen & Gebhardt (2010) we suggest that the observed discrepancy may indicate problems with the X-ray modelling. Perhaps other forms of non-thermal pressure support, such as magnetic fields, microturbulence, or cosmic-rays are present in the X-ray gas, but are not yet adequately treated in the X-ray mass determination. Additionally, the assumption that the X-ray emitting gas is in hydrostatic equilibrium may need to be relaxed. This is a particular concern in disturbed galaxies such as NGC 3923, where its obvious shell structures may imply a relatively recent merger event. These results act to reinforce the fact that only by combining as many mass tracers as possible within individual galaxies is it possible to overcome each tracers shortcomings and arrive at a robust estimate of galaxy dynamics and DM content.
5 Conclusions
This paper has presented Gemini/GMOS spectra of 79 GCs associated with NGC 3923 measured using MOS and NS techniques. Their radial velocities have been combined with GC number densities profiles, stellar integrated light kinematics, and stellar surface brightness profiles and used to constrain the DM content of the NGC 3923. Our main conclusions are:
-
1.
There is no significant evidence for rotation in any of the GC sub-samples (total, blue, or red) out to the largest projected radius measured (6.9Re).
-
2.
In common with other studies of early type galaxies (e.g. Schuberth et al., 2010; Park et al., 2010) the blue GC subsample appears to have a higher dispersion (272 34 kms-1), than the red GC subsample (200 22 kms-1). But with our current sample size this difference is not yet statistically significant.
-
3.
The GC velocity dispersion profile for the total GC sample is consistent with being constant with radius.
-
4.
The velocity dispersion of the integrated light of NGC 3923 at large radii is also constant, and is consistent with the GC velocity dispersion profile at the same radii.
-
5.
We find some evidence that the diffuse light and GCs of NGC 3923 have radially biased orbits within 130′′.
-
6.
By applying axisymmetric orbit-based models to the GC and integrated light data we find that NGC 3923 is 17.5 DM within Re, 41.2 within 2Re, and 75.6 within 6.9Re. These DM mass fractions for a group elliptical are indistinguishable from those found using similar methods for ellipticals in environments from isolated (NGC821) to cD (M87), perhaps indicating the universal nature of the DM profile.
-
7.
The total dynamical mass within the radius of our last dynamical tracer (6.9Re) is found to be 1.51012 M⊙.
-
8.
The inferred GC+integrated light dynamical mass and X-ray mass profiles are discrepant. The X-ray mass profile is around 50 of that of the dynamical mass.
6 Acknowledgements
The authors would like to thank David Fisher for providing the deep V-band surface brightness profile of NGC 3923 used in this paper and Yasushi Fukazawa for supplying the B band M/L profile of NGC 3923 as measured from X-ray observations.
MAN acknowledges financial support from the STFC. Support for Program number HST-AR-12147.01-A was provided by NASA through a grant from the Space Telescope Science Institute, which is operated by the Association of Universities for Research in Astronomy, Incorporated, under NASA contract NAS5-26555.
SEZ acknowledges support from NSF award AST-0406891. DF acknowledges support from the ARC. FF acknowledges financial support from the Agencia de Promoción Cientifica y Tecnológica (BID AR PICT 885).
We are thankful for the facilities at the Texas Advanced Computing Center at The University of Texas at Austin, which has allowed access to over 5000 node computers where we ran all of the models. KG acknowledges support from NSF-0908639.
This paper makes use of data obtained as part of Gemini Observtory programs GS-2004A-Q-9 and GS-2011A-Q-13.
Based on observations obtained at the Gemini Observatory, which is operated by the Association of Universities for Research in Astronomy, Inc., under a cooperative agreement with the NSF on behalf of the Gemini partnership: the National Science Foundation (United States), the Science and Technology Facilities Council (United Kingdom), the National Research Council (Canada), CONICYT (Chile), the Australian Research Council (Australia), Minist rio da Ci ncia, Tecnologia e Inova o (Brazil) and Ministerio de Ciencia, Tecnolog a e Innovaci n Productiva (Argentina).
References
- Abraham et al. (2004) Abraham R. G., Glazebrook K., McCarthy P. J., Crampton D., Murowinski R., Jørgensen I., Roth K., Hook I. M., Savaglio S., Chen H.-W., Marzke R. O., Carlberg R. G., 2004, AJ, 127, 2455
- Arnold et al. (2011) Arnold J. A., Romanowsky A. J., Brodie J. P., Chomiuk L., Spitler L. R., Strader J., Benson A. J., Forbes D. A., 2011, ApJ, 736, L26
- Bassino et al. (2008) Bassino L. P., Richtler T., Dirsch B., 2008, MNRAS, 386, 1145
- Beasley et al. (2004) Beasley M. A., Forbes D. A., Brodie J. P., Kissler-Patig M., 2004, MNRAS, 347, 1150
- Bergond et al. (2006) Bergond G., Zepf S. E., Romanowsky A. J., Sharples R. M., Rhode K. L., 2006, A&A, 448, 155
- Binney & Tremaine (1987) Binney J., Tremaine S., 1987, Galactic Dynamics
- Bolton et al. (2008) Bolton A. S., Treu T., Koopmans L. V. E., Gavazzi R., Moustakas L. A., Burles S., Schlegel D. J., Wayth R., 2008, ApJ, 684, 248
- Bridges et al. (2006) Bridges T., Gebhardt K., Sharples R., Faifer F. R., Forte J. C., Beasley M. A., Zepf S. E., Forbes D. A., Hanes D. A., Pierce M., 2006, MNRAS, 373, 157
- Bridges et al. (2007) Bridges T. J., Rhode K. L., Zepf S. E., Freeman K. C., 2007, ApJ, 658, 980
- Brough et al. (2006) Brough S., Forbes D. A., Kilborn V. A., Couch W., 2006, MNRAS, 370, 1223
- Cappellari et al. (2006) Cappellari M., Bacon R., Bureau M., Damen M. C., Davies R. L., de Zeeuw P. T., Emsellem E., Falcón-Barroso J., Krajnović D., Kuntschner H., McDermid R. M., Peletier R. F., Sarzi M., van den Bosch R. C. E., van de Ven G., 2006, MNRAS, 366, 1126
- Carter et al. (1998) Carter D., Thomson R. C., Hau G. K. T., 1998, MNRAS, 294, 182
- Chakrabarty & Raychaudhury (2008) Chakrabarty D., Raychaudhury S., 2008, AJ, 135, 2350
- Cho (2008) Cho J., 2008, PhD thesis, University of Durham
- Côté et al. (2003) Côté P., McLaughlin D. E., Cohen J. G., Blakeslee J. P., 2003, ApJ, 591, 850
- Côté et al. (2001) Côté P., McLaughlin D. E., Hanes D. A., Bridges T. J., Geisler D., Merritt D., Hesser J. E., Harris G. L. H., Lee M. G., 2001, ApJ, 559, 828
- Cretton et al. (1999) Cretton N., de Zeeuw P. T., van der Marel R. P., Rix H., 1999, ApJS, 124, 383
- Faber et al. (1989) Faber S. M., Wegner G., Burstein D., Davies R. L., Dressler A., Lynden-Bell D., Terlevich R. J., 1989, ApJS, 69, 763
- Faifer et al. (2011) Faifer F. R., Forte J. C., Norris M. A., Bridges T., Forbes D. A., Zepf S. E., Beasley M., Gebhardt K., Hanes D. A., Sharples R. M., 2011, MNRAS, 416, 155
- Forbes & Forte (2001) Forbes D. A., Forte J. C., 2001, MNRAS, 322, 257
- Forbes et al. (2004) Forbes D. A., Raul Faifer F., Carlos Forte J., Bridges T., Beasley M. A., Gebhardt K., Hanes D. A., Sharples R., Zepf S. E., 2004, MNRAS, 355, 608
- Forbes et al. (2010) Forbes D. A., Spitler L. R., Harris W. E., Bailin J., Strader J., Brodie J. P., Larsen S. S., 2010, MNRAS, 403, 429
- Forestell & Gebhardt (2010) Forestell A. D., Gebhardt K., 2010, ApJ, 716, 370
- Forte et al. (2007) Forte J. C., Faifer F., Geisler D., 2007, MNRAS, 382, 1947
- Forte et al. (2009) Forte J. C., Vega E. I., Faifer F., 2009, MNRAS, 397, 1003
- Forte et al. (2011) Forte J. C., Vega E. I., Faifer F. R., 2011, ArXiv e-prints
- Fukazawa et al. (2006) Fukazawa Y., Botoya-Nonesa J. G., Pu J., Ohto A., Kawano N., 2006, ApJ, 636, 698
- Gebhardt & Fischer (1995) Gebhardt K., Fischer P., 1995, AJ, 109, 209
- Gebhardt et al. (1994) Gebhardt K., Pryor C., Williams T. B., Hesser J. E., 1994, AJ, 107, 2067
- Gebhardt et al. (2000) Gebhardt K., Richstone D., Kormendy J., Lauer T. R., Ajhar E. A., Bender R., Dressler A., Faber S. M., Grillmair C., Magorrian J., Tremaine S., 2000, AJ, 119, 1157
- Gebhardt et al. (2003) Gebhardt K., Richstone D., Tremaine S., Lauer T. R., Bender R., Bower G., Dressler A., Faber S. M., Filippenko A. V., Green R., Grillmair C., Ho L. C., Kormendy J., Magorrian J., Pinkney J., 2003, ApJ, 583, 92
- Gültekin (2010) Gültekin K., 2010, in IAU Symposium Vol. 267 of IAU Symposium, Determination of the Intrinsic Scatter in the MBH- and MBH-Lbulge Relations. pp 189–194
- Harris (2009) Harris W. E., 2009, ApJ, 703, 939
- Harris et al. (2006) Harris W. E., Whitmore B. C., Karakla D., Okoń W., Baum W. A., Hanes D. A., Kavelaars J. J., 2006, ApJ, 636, 90
- Johnson et al. (2009) Johnson R., Chakrabarty D., O’Sullivan E., Raychaudhury S., 2009, ApJ, 706, 980
- Jones (1997) Jones L. A., 1997, Ph.D thesis, Univ. North Carolina, Chapel Hill
- Koprolin & Zeilinger (2000) Koprolin W., Zeilinger W. W., 2000, A&AS, 145, 71
- Kuntschner et al. (2002) Kuntschner H., Ziegler B. L., Sharples R. M., Worthey G., Fricke K. J., 2002, A&A, 395, 761
- Lee et al. (1998) Lee M. G., Kim E., Geisler D., 1998, AJ, 115, 947
- Lee et al. (2008) Lee M. G., Park H. S., Kim E., Hwang H. S., Kim S. C., Geisler D., 2008, ApJ, 682, 135
- Malin & Carter (1983) Malin D. F., Carter D., 1983, ApJ, 274, 534
- Maraston (2005) Maraston C., 2005, MNRAS, 362, 799
- Merritt & Tremblay (1993) Merritt D., Tremblay B., 1993, AJ, 106, 2229
- Mieske et al. (2006) Mieske S., Hilker M., Infante L., Jordán A., 2006, AJ, 131, 2442
- Murphy et al. (2011) Murphy J. D., Gebhardt K., Adams J. J., 2011, ArXiv e-prints
- Norris & Kannappan (2011) Norris M. A., Kannappan S. J., 2011, MNRAS, 414, 739
- Norris et al. (2008) Norris M. A., Sharples R. M., Bridges T., Gebhardt K., Forbes D. A., Proctor R., Raul Faifer F., Carlos Forte J., Beasley M. A., Zepf S. E., Hanes D. A., 2008, MNRAS, 385, 40
- Norris et al. (2006) Norris M. A., Sharples R. M., Kuntschner H., 2006, MNRAS, 367, 815
- Park et al. (2010) Park H. S., Lee M. G., Hwang H. S., Arimoto N., Tamura N., Onodera M., 2010, ApJ, 709, 377
- Peng et al. (2009) Peng E. W., Jordán A., Blakeslee J. P., Mieske S., Côté P., Ferrarese L., Harris W. E., Madrid J. P., Meurer G. R., 2009, ApJ, 703, 42
- Peng et al. (2006) Peng E. W., Jordán A., Côté P., Blakeslee J. P., Ferrarese L., Mei S., West M. J., Merritt D., Milosavljević M., Tonry J. L., 2006, ApJ, 639, 95
- Persic et al. (1996) Persic M., Salucci P., Stel F., 1996, MNRAS, 281, 27
- Pierce et al. (2006) Pierce M., Beasley M. A., Forbes D. A., Bridges T., Gebhardt K., Faifer F. R., Forte J. C., Zepf S. E., Sharples R., Hanes D. A., Proctor R., 2006, MNRAS, 366, 1253
- Richstone & Tremaine (1984) Richstone D. O., Tremaine S., 1984, ApJ, 286, 27
- Richtler et al. (2004) Richtler T., Dirsch B., Gebhardt K., Geisler D., Hilker M., Alonso M. V., Forte J. C., Grebel E. K., Infante L., Larsen S., Minniti D., Rejkuba M., 2004, AJ, 127, 2094
- Richtler et al. (2008) Richtler T., Schuberth Y., Hilker M., Dirsch B., Bassino L., Romanowsky A. J., 2008, A&A, 478, L23
- Rix et al. (1997) Rix H., de Zeeuw P. T., Cretton N., van der Marel R. P., Carollo C. M., 1997, ApJ, 488, 702
- Romanowsky et al. (2003) Romanowsky A. J., Douglas N. G., Arnaboldi M., Kuijken K., Merrifield M. R., Napolitano N. R., Capaccioli M., Freeman K. C., 2003, Science, 301, 1696
- Romanowsky et al. (2009) Romanowsky A. J., Strader J., Spitler L. R., Johnson R., Brodie J. P., Forbes D. A., Ponman T., 2009, AJ, 137, 4956
- Schuberth et al. (2006) Schuberth Y., Richtler T., Dirsch B., Hilker M., Larsen S. S., Kissler-Patig M., Mebold U., 2006, A&A, 459, 391
- Schuberth et al. (2010) Schuberth Y., Richtler T., Hilker M., Dirsch B., Bassino L. P., Romanowsky A. J., Infante L., 2010, A&A, 513, A52+
- Schwarzschild (1979) Schwarzschild M., 1979, ApJ, 232, 236
- Sharples et al. (1998) Sharples R. M., Zepf S. E., Bridges T. J., Hanes D. A., Carter D., Ashman K. M., Geisler D., 1998, AJ, 115, 2337
- Shen & Gebhardt (2010) Shen J., Gebhardt K., 2010, ApJ, 711, 484
- Sikkema et al. (2007) Sikkema G., Carter D., Peletier R. F., Balcells M., Del Burgo C., Valentijn E. A., 2007, A&A, 467, 1011
- Sikkema et al. (2006) Sikkema G., Peletier R. F., Carter D., Valentijn E. A., Balcells M., 2006, A&A, 458, 53
- Siopis et al. (2009) Siopis C., Gebhardt K., Lauer T. R., Kormendy J., Pinkney J., Richstone D., Faber S. M., Tremaine S., Aller M. C., Bender R., Bower G., Dressler A., Filippenko A. V., Green R., Ho L. C., Magorrian J., 2009, ApJ, 693, 946
- Strader et al. (2006) Strader J., Brodie J. P., Spitler L., Beasley M. A., 2006, AJ, 132, 2333
- Strader et al. (2011) Strader J., Romanowsky A., Brodie J., Spitler L., Beasley M., Arnold J., Tamura N., Sharples R., Arimoto N., 2011, ArXiv e-prints
- Tamura et al. (2006) Tamura N., Sharples R. M., Arimoto N., Onodera M., Ohta K., Yamada Y., 2006, MNRAS, 373, 601
- Teodorescu et al. (2010) Teodorescu A. M., Méndez R. H., Bernardi F., Riffeser A., Kudritzki R. P., 2010, ApJ, 721, 369
- Thomas et al. (2005) Thomas D., Maraston C., Bender R., Mendes de Oliveira C., 2005, ApJ, 621, 673
- Thomas et al. (2005) Thomas J., Saglia R. P., Bender R., Thomas D., Gebhardt K., Magorrian J., Corsini E. M., Wegner G., 2005, MNRAS, 360, 1355
- Thomas et al. (2007) Thomas J., Saglia R. P., Bender R., Thomas D., Gebhardt K., Magorrian J., Corsini E. M., Wegner G., 2007, MNRAS, 382, 657
- Thomas et al. (2004) Thomas J., Saglia R. P., Bender R., Thomas D., Gebhardt K., Magorrian J., Richstone D., 2004, MNRAS, 353, 391
- Valluri et al. (2004) Valluri M., Merritt D., Emsellem E., 2004, ApJ, 602, 66
- Vazdekis (1999) Vazdekis A., 1999, ApJ, 513, 224
- Vitvitska et al. (2002) Vitvitska M., Klypin A. A., Kravtsov A. V., Wechsler R. H., Primack J. R., Bullock J. S., 2002, ApJ, 581, 799
- Weijmans et al. (2009) Weijmans A., Cappellari M., Bacon R., de Zeeuw P. T., Emsellem E., Falcón-Barroso J., Kuntschner H., McDermid R. M., van den Bosch R. C. E., van de Ven G., 2009, MNRAS, 398, 561
- Woodley et al. (2010) Woodley K. A., Gómez M., Harris W. E., Geisler D., Harris G. L. H., 2010, AJ, 139, 1871
- Woodley et al. (2007) Woodley K. A., Harris W. E., Beasley M. A., Peng E. W., Bridges T. J., Forbes D. A., Harris G. L. H., 2007, AJ, 134, 494
- Zepf et al. (1995) Zepf S. E., Ashman K. M., Geisler D., 1995, ApJ, 443, 570
- Zepf et al. (2000) Zepf S. E., Beasley M. A., Bridges T. J., Hanes D. A., Sharples R. M., Ashman K. M., Geisler D., 2000, AJ, 120, 2928
| ID | RA | Dec. | X | Y | g | r | i | V | Name |
|---|---|---|---|---|---|---|---|---|---|
| (J2000) | (J2000) | (arcmin) | (arcmin) | (mag) | (mag) | (mag) | (kms-1) | ||
| 26 | 177.70500 | -28.78370 | 2.74 | 1.35 | 22.52 | 22.05 | 21.85 | 1586.5 66.0 | NSB228 |
| 35 | 177.70690 | -28.82370 | 2.64 | -1.05 | 21.43 | 20.81 | 20.53 | 1590.8 35.9 | |
| 39 | 177.70700 | -28.81640 | 2.63 | -0.61 | 22.35 | 21.68 | 21.38 | 1726.6 28.9 | NSB197 |
| 55 | 177.78160 | -28.77420 | -1.29 | 1.92 | 21.31 | 20.78 | 20.59 | 2295.2 47.3 | NSB65 |
| 58 | 177.70860 | -28.83960 | 2.55 | -2.00 | 22.68 | 22.15 | 21.98 | 2203.2 74.2 | NSB253 |
| 90 | 177.71090 | -28.78090 | 2.43 | 1.52 | 23.08 | 22.61 | 22.35 | 1851.2 69.2 | NSB394 |
| 103 | 177.77170 | -28.81650 | -0.77 | -0.62 | 20.61 | 20.04 | 19.80 | 2307.9 34.8 | NGC3923-UCD3 |
| 128 | 177.78560 | -28.77520 | -1.50 | 1.86 | 21.76 | 21.27 | 21.07 | 2144.1 45.0 | NSB104 |
| 158 | 177.78340 | -28.81080 | -1.38 | -0.27 | 22.69 | 21.99 | 21.63 | 1809.0 31.7 | |
| 162 | 177.78300 | -28.76930 | -1.36 | 2.22 | 22.12 | 21.52 | 21.23 | 1810.9 26.9 | NSB167 |
| 176 | 177.78150 | -28.77910 | -1.28 | 1.63 | 21.22 | 20.60 | 20.32 | 1995.9 50.4 | |
| 193 | 177.77960 | -28.83760 | -1.18 | -1.88 | 21.80 | 21.13 | 20.78 | 2046.0 32.5 | NSB108 |
| 206 | 177.77880 | -28.82970 | -1.14 | -1.41 | 22.73 | 22.20 | 21.99 | 1752.7 45.4 | |
| 214 | 177.74260 | -28.84840 | 0.76 | -2.53 | 22.86 | 22.13 | 21.81 | 1925.2 55.0 | NSB333 |
| 243 | 177.73280 | -28.80520 | 1.28 | 0.06 | 19.99 | 19.42 | 19.17 | 1478.0 28.6 | NGC3923-UCD2 |
| 251 | 177.77530 | -28.80570 | -0.96 | 0.03 | 21.36 | 20.60 | 20.22 | 1790.4 28.4 | |
| 275 | 177.77380 | -28.83190 | -0.88 | -1.54 | 22.88 | 22.13 | 21.69 | 1638.9 40.9 | NSB332 |
| 277 | 177.77380 | -28.82810 | -0.88 | -1.31 | 22.68 | 22.02 | 21.67 | 1945.0 64.2 | |
| 312 | 177.77010 | -28.76440 | -0.69 | 2.51 | 21.84 | 21.22 | 20.88 | 1555.1 35.7 | NSB110 |
| 318 | 177.76990 | -28.78640 | -0.67 | 1.19 | 23.03 | 22.39 | 22.06 | 1555.8 39.0 | |
| 336 | 177.76700 | -28.80560 | -0.52 | 0.04 | 19.53 | 18.88 | 18.58 | 2114.7 29.9 | NGC3923-UCD1 |
| 344 | 177.76680 | -28.76360 | -0.51 | 2.56 | 22.49 | 22.01 | 21.82 | 1805.4 53.1 | NSB221 |
| 365 | 177.76470 | -28.83240 | -0.40 | -1.57 | 22.52 | 21.81 | 21.47 | 1936.0 56.0 | NSB225 |
| 375 | 177.76410 | -28.79420 | -0.37 | 0.72 | 21.23 | 20.52 | 20.15 | 1438.4 27.7 | |
| 380 | 177.77950 | -28.82690 | -1.18 | -1.24 | 21.44 | 20.97 | 20.78 | 1159.5 50.2 | |
| 396 | 177.76120 | -28.78020 | -0.22 | 1.56 | 22.70 | 22.10 | 21.81 | 1190.8 44.5 | |
| 419 | 177.75850 | -28.82620 | -0.07 | -1.20 | 21.88 | 21.40 | 21.20 | 1564.0 60.2 | |
| 453 | 177.75500 | -28.76550 | 0.11 | 2.45 | 23.46 | 22.86 | 22.42 | 1618.9 61.2 | NSB513 |
| 458 | 177.75470 | -28.81330 | 0.13 | -0.42 | 21.60 | 21.12 | 20.93 | 1617.4 62.7 | |
| 484 | 177.75260 | -28.76210 | 0.24 | 2.65 | 23.26 | 22.65 | 22.37 | 2114.4 38.9 | NSB450 |
| 492 | 177.75160 | -28.78010 | 0.29 | 1.57 | 22.22 | 21.55 | 21.22 | 1760.6 15.2 | |
| 502 | 177.75060 | -28.80160 | 0.34 | 0.28 | 21.56 | 20.76 | 20.36 | 1627.5 26.6 | |
| 503 | 177.75060 | -28.78290 | 0.34 | 1.40 | 22.56 | 21.96 | 21.57 | 1807.9 29.6 | NSB232 |
| 530 | 177.72510 | -28.80540 | 1.68 | 0.05 | 21.28 | 20.68 | 20.42 | 1764.7 32.0 | NSB64 |
| 534 | 177.74800 | -28.80790 | 0.48 | -0.10 | 21.56 | 20.88 | 20.54 | 2148.3 26.1 | |
| 535 | 177.74780 | -28.83600 | 0.49 | -1.78 | 22.97 | 22.27 | 21.88 | 1457.0 70.4 | NSB360 |
| 552 | 177.74640 | -28.76710 | 0.56 | 2.35 | 23.33 | 22.60 | 22.26 | 1749.1 74.1 | NSB492 |
| 557 | 177.74590 | -28.83100 | 0.59 | -1.48 | 23.03 | 22.35 | 22.07 | 1621.8 73.0 | |
| 593 | 177.74050 | -28.79270 | 0.87 | 0.81 | 21.87 | 21.27 | 20.99 | 2114.6 52.7 | |
| 595 | 177.74140 | -28.77960 | 0.82 | 1.60 | 22.83 | 22.10 | 21.74 | 1796.2 55.6 | |
| 601 | 177.74040 | -28.77930 | 0.88 | 1.62 | 22.79 | 22.20 | 21.93 | 1666.4 42.5 | NSB311 |
| 617 | 177.73830 | -28.80010 | 0.99 | 0.37 | 21.87 | 21.18 | 20.86 | 1949.9 24.2 | |
| 621 | 177.73840 | -28.83810 | 0.98 | -1.91 | 22.61 | 22.06 | 21.86 | 1840.7 48.2 | NSB247 |
| 669 | 177.73420 | -28.76740 | 1.20 | 2.33 | 21.62 | 21.03 | 20.72 | 1784.4 51.1 | NSB86 |
| 683 | 177.73260 | -28.77300 | 1.29 | 2.00 | 22.80 | 22.08 | 21.67 | 1755.7 53.9 | |
| 692 | 177.73240 | -28.78010 | 1.30 | 1.57 | 23.36 | 22.75 | 22.42 | 1622.1 48.6 | NSB498 |
| 713 | 177.73050 | -28.77580 | 1.40 | 1.83 | 22.83 | 22.30 | 22.08 | 2038.4 88.5 | NSB322 |
| 725 | 177.72900 | -28.80110 | 1.48 | 0.31 | 21.72 | 21.08 | 20.77 | 1664.7 24.9 | NSB99 |
| 760 | 177.69530 | -28.82620 | 3.25 | -1.20 | 20.50 | 19.89 | 19.62 | 1714.4 26.3 | |
| 779 | 177.72420 | -28.79050 | 1.73 | 0.95 | 21.42 | 20.85 | 20.61 | 1861.3 43.8 | |
| 791 | 177.72330 | -28.76960 | 1.78 | 2.20 | 21.73 | 21.14 | 20.85 | 1733.2 26.3 | NSB106 |
| 824 | 177.79280 | -28.80270 | -1.88 | 0.21 | 21.62 | 21.03 | 20.79 | 1756.4 42.5 | |
| 847 | 177.68510 | -28.85610 | 3.78 | -2.99 | 21.89 | 21.45 | 21.06 | 2024.5 68.1 | |
| 859 | 177.71780 | -28.83340 | 2.06 | -1.63 | 21.66 | 21.00 | 20.68 | 1970.9 59.7 | |
| 872 | 177.71640 | -28.80990 | 2.14 | -0.22 | 21.87 | 21.27 | 21.02 | 1762.7 26.2 | NSB112 |
| 903 | 177.71360 | -28.84480 | 2.29 | -2.31 | 22.70 | 21.98 | 21.61 | 1796.6 57.9 | NSB279 |
| 940 | 177.80100 | -28.80420 | -2.31 | 0.12 | 21.26 | 20.74 | 20.55 | 1494.4 56.9 | |
| 952 | 177.78790 | -28.80630 | -1.62 | -0.00 | 21.66 | 21.00 | 20.67 | 1738.2 25.3 | NSB93 |
| ID | RA | Dec. | X | Y | g | r | i | V | Name |
|---|---|---|---|---|---|---|---|---|---|
| (J2000) | (J2000) | (arcmin) | (arcmin) | (mag) | (mag) | (mag) | (kms-1) | ||
| 977 | 177.79550 | -28.76420 | -2.02 | 2.52 | 22.35 | 21.82 | 21.64 | 2219.1 65.9 | |
| 1030 | 177.66740 | -28.82500 | 4.71 | -1.12 | 20.75 | 20.21 | 19.95 | 1517.0 32.1 | |
| 1036 | 177.79440 | -28.79320 | -1.96 | 0.78 | 22.04 | 21.41 | 21.12 | 1811.5 44.2 | |
| 1107 | 177.65980 | -28.86380 | 5.11 | -3.45 | 21.49 | 20.97 | 20.76 | 1354.7 62.0 | |
| 1252 | 177.82400 | -28.78750 | -3.52 | 1.12 | 21.97 | 21.37 | 21.16 | 1731.1 27.1 | |
| 1297 | 177.70040 | -28.78040 | 2.98 | 1.55 | 22.23 | 21.58 | 21.26 | 1922.9 24.3 | |
| 1310 | 177.69830 | -28.84090 | 3.09 | -2.08 | 21.28 | 20.67 | 20.40 | 2109.3 23.5 | |
| 1320 | 177.69750 | -28.78430 | 3.13 | 1.32 | 22.25 | 21.50 | 21.11 | 1988.6 31.4 | |
| 1356 | 177.69350 | -28.81410 | 3.34 | -0.47 | 22.02 | 21.36 | 21.06 | 1903.5 39.4 | |
| 1437 | 177.68240 | -28.84210 | 3.93 | -2.15 | 21.53 | 20.99 | 20.68 | 1847.5 23.1 | |
| 1524 | 177.67090 | -28.83400 | 4.53 | -1.66 | 22.32 | 21.82 | 21.61 | 1300.5 28.3 | |
| 1535 | 177.66890 | -28.79070 | 4.64 | 0.93 | 22.82 | 22.09 | 21.72 | 1739.8 31.6 | |
| 1613 | 177.65850 | -28.80990 | 5.18 | -0.22 | 21.54 | 20.98 | 20.74 | 1782.5 63.9 | |
| 1653 | 177.73540 | -28.84380 | 1.14 | -2.25 | 22.28 | 21.40 | 21.19 | 1769.9 20.8 | |
| 1694 | 177.82870 | -28.75210 | -3.77 | 3.25 | 21.78 | 21.20 | 20.92 | 1734.0 40.1 | |
| 1797 | 177.75200 | -28.72930 | 0.27 | 4.62 | 22.26 | 21.59 | 21.37 | 2167.9 39.9 | |
| 1867 | 177.76790 | -28.74720 | -0.57 | 3.54 | 22.02 | 21.45 | 21.25 | 1635.2 51.8 | |
| 1903 | 177.77520 | -28.72790 | -0.95 | 4.70 | 23.10 | 22.40 | 22.12 | 1992.7 55.5 | |
| 1919 | 177.77810 | -28.73110 | -1.11 | 4.51 | 21.83 | 21.18 | 20.90 | 2039.1 33.3 | |
| 2153 | 177.81160 | -28.79920 | -2.87 | 0.42 | 23.24 | 22.54 | 22.21 | 1975.5 39.0 | |
| 2223 | 177.81990 | -28.77930 | -3.30 | 1.61 | 22.33 | 21.63 | 21.28 | 2064.4 15.7 |