Synthesis and physical properties of the new potassium iron selenide superconductor K0.80Fe1.76Se2
Abstract
In this article we review our studies of the K0.80Fe1.76Se2 superconductor, with an attempt to elucidate the crystal growth details and basic physical properties over a wide range of temperatures and applied magnetic field, including anisotropic magnetic and electrical transport properties, thermodynamic, London penetration depth, magneto-optical imaging and Mössbauer measurements. We find that: (i) Single crystals of similar stoichiometry can be grown both by furnace-cooled and decanted methods; (ii) Single crystalline K0.80Fe1.76Se2 shows moderate anisotropy in both magnetic susceptibility and electrical resistivity and a small modulation of stoichiometry of the crystal, which gives rise to broadened transitions; (iii) The upper critical field, (T) is 55 T at 2 K for , manifesting a temperature dependent anisotropy that peaks near 3.6 at 27 K and drops to 2.5 by 18 K; (iv) Mössbauer measurements reveal that the iron sublattice in K0.80Fe1.76Se2 clearly exhibits magnetic order, probably of the first order, from well below to its Néel temperature of K. It is very important to note that, although, at first glance there is an apparent dilemma posed by these data: high superconductivity in a near insulating, large ordered moment material, analysis indicates that the sample may well consist of two phases with the minority superconducting phase (that does not exhibit magnetic order) being finely distributed, but connected with in an antiferromagnetic, poorly conducting, matrix, essentially making a superconducting aerogel.
I Introduction
The iron-based superconductors have attracted intense research attention because of their high transition temperature and their possibly unconventional pairing mechanism, correlated to magnetism.Kenji Johnpierre Similar to cuprate superconductors, iron-based superconductors have layered structures; the planar Fe layers tetrahedrally coordinbated by As or chalcogen anions (Se or Te) are believed to be responsible for superconductivity. Stacking of the FeAs building blocks with alkali, alkaline earth or rare earth oxygen spacer layers forms the basic classes of iron arsenic superconductors in these compounds: 111-type AFeAsWang , 122-type AFe2As2Rotter Jasper , 1111-type ROFeAsKamihara ,Chen and more complex block containing phases, e.g. Sr2VO3FeAsZhu , Sr3Sc2Fe2As2O5Zhu2 , Sr4Sc2Fe2As2O6.Chen2 The simple binary 11-type iron chalcogenide has no spacer layers and superconductivity can be induced by doping FeTe with SRongwei or Se.Mizu Different from the other iron-based superconductors, FeSe is a superconductorHsu , K, with no static magnetic order and its transition temperature can be increased up to 37 K by applying pressureMed or 15 K in FeSe0.5Te0.5.Mizu More recently, superconductivity above 30 K has been reported in AxFe2-ySe2 (A = K, Cs, Rb or Tl)Guo AFWang , by adding A between the Fe2Se2 layers, a compound with the same unit cell structure as the AFe2As2 compounds.
measurements showed that magnetic order co-exists with bulk superconductivity in Cs0.8Fe1.6Se2Sher , and neutron diffraction measurements on K0.8Fe1.76Se2 Weibao have suggested that not only do magnetic order and superconductivity co-exist, but that the iron moments are remarkably large (3.3 /Fe) and are ordered in a relatively complex antiferromagnetic structure that places all of the iron moments parallel to the c-axis. The magnetic ordering temperatures are quite high in both compounds: (Cs)=480 K Sher , (K)=560 K Weibao . The development of a paramagnetic component near Sher and the unusual temperature dependence of the magnetic intensity Weibao suggest that the magnetic transition may be first order in nature rather than being a more conventional second order transition. First order magnetic transitions are commonly associated with changes in crystal structure, and both synchrotron x-ray diffraction Pomj1919 and neutron diffraction Weibao ,Weibao2 have now shown evidence for a structural change from to associated with a disordering of iron vacancies that occurs in the vicinity of the magnetic transition. In this review we summarize our basic understanding of this material.Hu1931 Ryan2011 First we clarify the growth details and present elemental analysis and physical properties of K0.80Fe1.76Se2 single crystals.Hu1931 Then the - phase diagram for the K0.8Fe1.76Se2 is constructed and discussed.Mun At the end we present the study of the magnetic ordering of K0.80Fe1.76Se2 using 57Fe Mössbauer spectroscopy.Ryan2011
II Experimental methods
Crystals were characterized by powder x-ray diffraction using a Rigaku Miniflex x-ray diffractometer. The actual chemical composition was determined by wavelength dispersive x-ray spectroscopy (WDS) in a JEOL JXA-8200 electron microscope. Magnetic susceptibility was measured in a Quantum Design MPMS, SQUID magnetometer. In plane AC resistivity was measured by a standard four-probe configuration. Measurement of was made in the two-probe configuration. Contacts were made by using a silver alloy. For , contacts were covering the whole ab plane area.Jeffrey Thermoelectric power measurements were carried out by a dc, alternating temperature gradient (two heaters and two thermometers) technique.MunTEP Specific heat data were collected using a Quantum Design PPMS. The in-plane London penetration depth was measured by using a tunnel-diode resonator (TDR) oscillating at 14 MHz and at temperature down to 0.5 K.RuslanTDR Magneto-optical imaging was conducted by utilizing the Faraday effect in bismuth-doped iron garnet indicators with in-plane magnetization.Doro A flow-type liquid 4He cryostat with sample in vacuum was used. The sample was positioned on top of a copper cold finger and an indicator was placed on top of the sample. The cryostat was positioned under polarized-light reflection microscope and the color images could be recorded on video and high-resolution CCD cameras. When linearly polarized light passes through the indicator and reflects off the mirror sputtered on its bottom, it picks up a double Faraday rotation proportional to the magnetic field intensity at a given location on the sample surface. Observed through the (almost) crossed analyzer, we recover a 2D image.Joos
To investigate the upper critical field anisotropy to higher fields ( T), the magnetic field dependence of radio frequency (rf) contactless penetration depth was measured for applied field both parallel () and perpendicular () to the tetragonal c-axis. The rf contactless penetration depth measurements were performed in a 60 T short pulse magnet with a 10 ms rise and 40 ms decay time. The rf technique has proven to be a sensitive and accurate method for determining the of superconductors. Mielke2001 This technique is highly sensitive to small changes in the rf penetration depth ( 1-5 nm) in the mixed state. As the magnetic field is applied, the probe detects the transition to the normal state by tracking the shift in resonant frequency, which is proportional to the change in penetration depth as , where is 25 MHz in the current setup. Because of the eddy current heating caused by the pulsed field, small single crystals were chosen, where the sample was placed in a circular detection coil for and was located on the top surface of one side of the counterwound coil pair for . Coffey2000 ,Altarawneh2009 For the configuration, the coupling between sample and coil is weaker than that for , resulting in a smaller frequency shift that is still sufficient to resolve . Details about this technique can be found in Refs. Coffey2000 Altarawneh2008 .
For Mössbauer measurements, two cleaved single crystal mosaic samples were prepared from the same batch of crystals. The first, for low-temperature work, was prepared by attaching several single crystal plates to a 12 mm diameter disc of 100 thick Kapton foil using Apiezon N grease. Care was taken to ensure that there were no gaps, but rather minimal overlap between the crystals. This sample was transferred promptly to a vibration-isolated closed-cycle refrigerator with the sample held in vacuum. The second sample, for the high-temperature work, was attached to a -inch diameter 10-mil beryllium disc using diluted GE-7031 varnish before being mounted in a resistively heated oven, again with the sample in vacuum. While we operated somewhat above the maximum service temperature of the varnish, the sample was cycled above 250∘C three times without any evidence of degradation.
The Mössbauer spectra were collected on conventional spectrometers using 50 mCi 57CoRh sources mounted on electromechanical drives operated in constant acceleration mode (on the high-temperature system) and sine-mode (on the low-temperature system). The spectrometers were calibrated against Fe metal at room temperature. The closed-cycle refrigerator cools to 10 K, with temperature sensing and control using a calibrated silicon diode mounted on the copper sample stage. Measured gradients (centre to edge of sample) in the oven are less than 1 K up to 750 K. Control and sensing rely on four, type-K, thermocouples. Temperature stability in both cases is better than 0.2 K. Spectra were fitted using a conventional non-linear least-squares minimisation routine to a sum of equal-width Lorentzian lines. Magnetic patterns were fitted assuming first-order perturbation in order to combine the effects of the magnetic hyperfine field () and the electric field gradient.
III Crystal growth and stoichiometry
Although single crystals of KxFe2-ySe2 could be grown readily from a melt, various stoichiometries of the single crystals were reported in literature, with wide ranges of the values of ( and )Ying Fang ,Wangdm Zava . There is concensus that KxFe2-ySe2 is of off-stoichiometric nature and the deficiency of K and Fe strongly influences their electrical transport properties, tuning the material from insulating to superconducting state.Fang ,Wangdm Different techniques were claimed to be suscessful in growing single crystals: self-flux growthYing , Bridgeman method.Wangdm In order to understand the crystal growth and obtain well controlled samples, two different ways were tried for growing single crystals of KxFe2-ySe2. As-grown crystals were compared and checked for homogeneity.
The first batch of single crystals of KxFe2-ySe2 were grown from K0.8Fe2Se2 melt, as described in Ref. 20. The starting material was slowly furnace-cooled from 1050 oC and dark shiny crystals could be mechanically separated from the solidified melt, which was consisted of crystals and fine polycrystalline material. The different stoichiometry between the starting material and resultant single crystal clearly implies that this is not simply the cooling of a stoichiometric melt to form a congruently melting, line compound. A second batch was grown from a starting composition of KFe3Se3. The sample was decantedFiskRemi ,PaulFisk at 850 oC after cooled from 1050 oC. This procedure resulted in similar but smaller crystals as the furnace-cooled samples. It clearly shows that KxFe2-ySe2 crystals are grown out of a ternary high temperature solution.
The lattice parameters refined from powder x-ray diffraction pattern of the crystals for both I4/mmm and I4/m space groups were Å and Å. They are in good agreement with the previous reported values in Ref. 20 (Å, Å). Wave-length dispersive x-ray spectroscopy (WDS) analysis was performed on both types of crystals to give a better determination of stoichiometry than the semi-quantitative Energy Dispersive X-ray (EDX) spectroscopy.Ying Fang ,Wangdm Zava The average composition are for the furnace-cooled sample and for the decanted sample, where the atomic numbers of K and Fe are normalized to two Se per formula unit and the standard deviation is taken as the compositional error and shown in parentheses after value. We found there is a spread of composition, the difference between the maximum and minimum values of the measurements, 0.07, 0.06 and 0.10 for K, Fe and Se respectively, for furnace-cooled crystals and 0.04, 0.12 and 0.09 for decanted crystals, roughly within of a normal distribution of random variable. It could be associated with the broadened superconducting transition, microstructure as seen in scanning electron microscope and the paramagnetic phase observed in Mössbauer spectroscopy (discussed below). The crystals grown from solution have very similar composition to the furnace cooled samples, with only a little higher concentration of Fe, reasonable for a crystal grown out of solution with a greater excess of Fe-Se.
IV Physical properties of single crystals of K0.80Fe1.76Se2
IV.1 Transport and thermodynamic properties
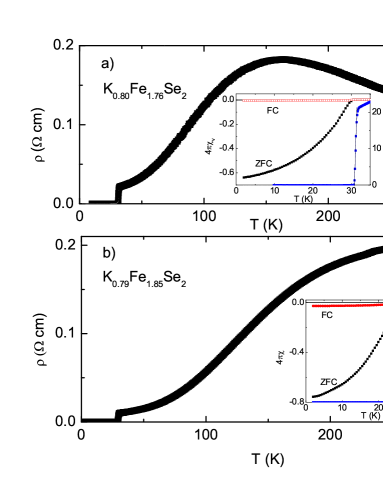
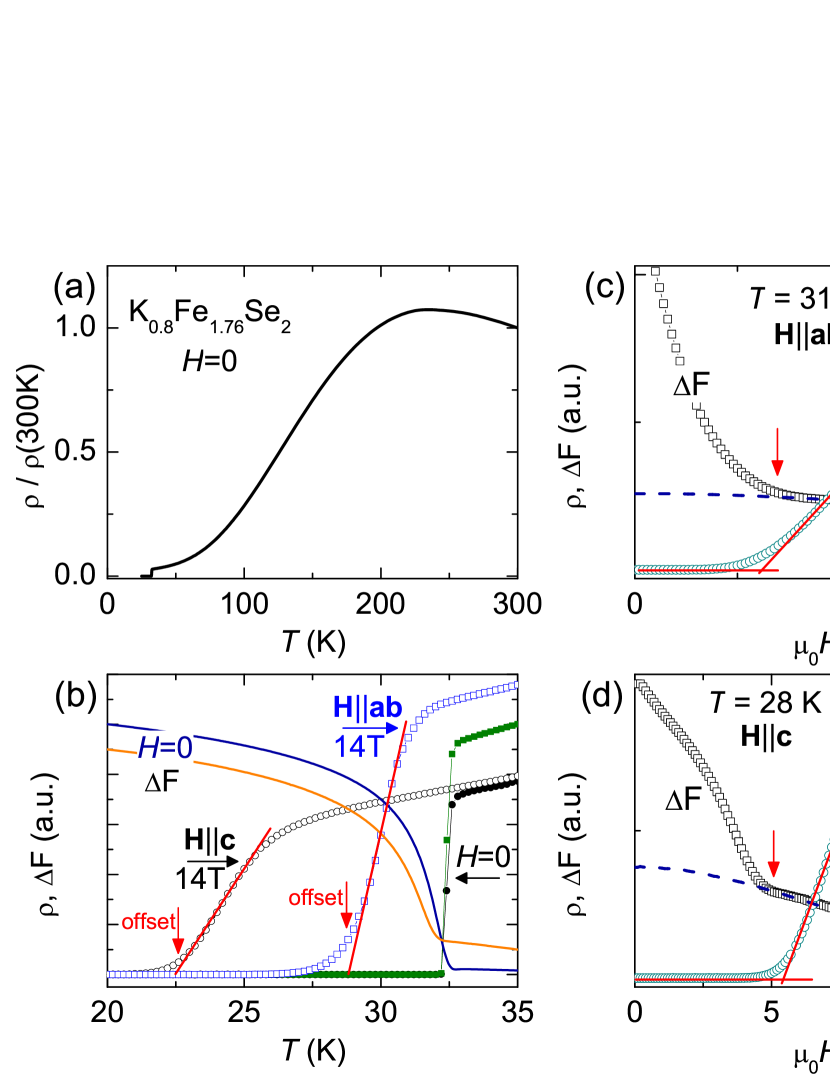
We compare the temperature dependent electrical resistivity and magnetization measurements of crystals grown by both the furnace cooled and decanted methods in Fig. 1. The in-plane resistivity of the furnace cooled sample is very similar to that of earlier reports.Ying ,Wangdm Although the superconducting transition temperature inferred from resistivity are similar ( K for furnace-cooled sample and K for decanted sample), the broad resistive maxima is shifted from 160 K for furnace-cooled sample to 280 K for decanted sample. Wang et al. showed that the position of the hump is sensitive to Fe deficiency.Wangdm With decreasing Fe deficiency, the hump shifts to higher temperature. This observation agrees well with the WDS result, which shows smaller Fe deficiency in the decanted samples. Given the small difference of both types of single crystals and the similarity to samples from earlier reports of the furnace-cooled samples, for the rest of this paper we will focus their fuller characterization.
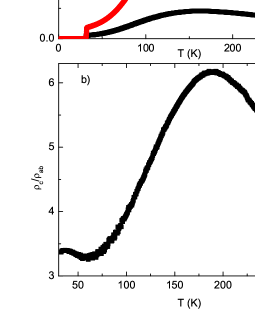
Anisotropic resistivity as a function of temperature is shown in Fig. 2a. It is clear that there is a broad maximum peak around 160 K for and 180 K for . The difference of maximum positions suggest that they result from a crossover rather than transition. The anisotropy is probably due to the layered structure of K0.80Fe1.76Se2. Figure 2b shows the anisotropy , reaches the maximum of 6 around 180 K and decreases to 4 around 300 K. It is comparable to the anisotropy of AFe2As2.Tanatar But a much larger resistivity anisotropy of 30-45 was reported in (Tl,K)FexSe2Wanghd , this may imply that the specific composition influences carrier tunneling significantly. An expanded view around the superconducting transition is shown in the inset to Fig. 2a. For both of the current directions, the transition width is about 0.7 K, but the inferred value from is slightly higher than that of .
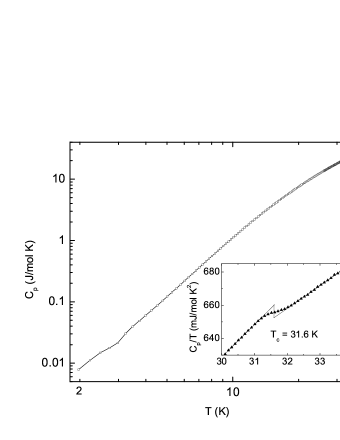
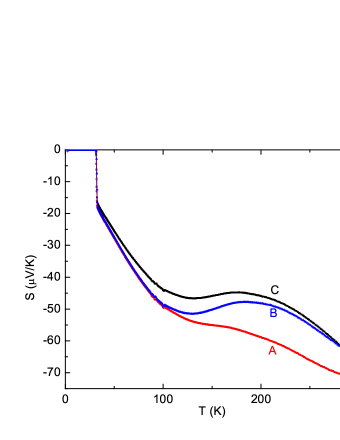
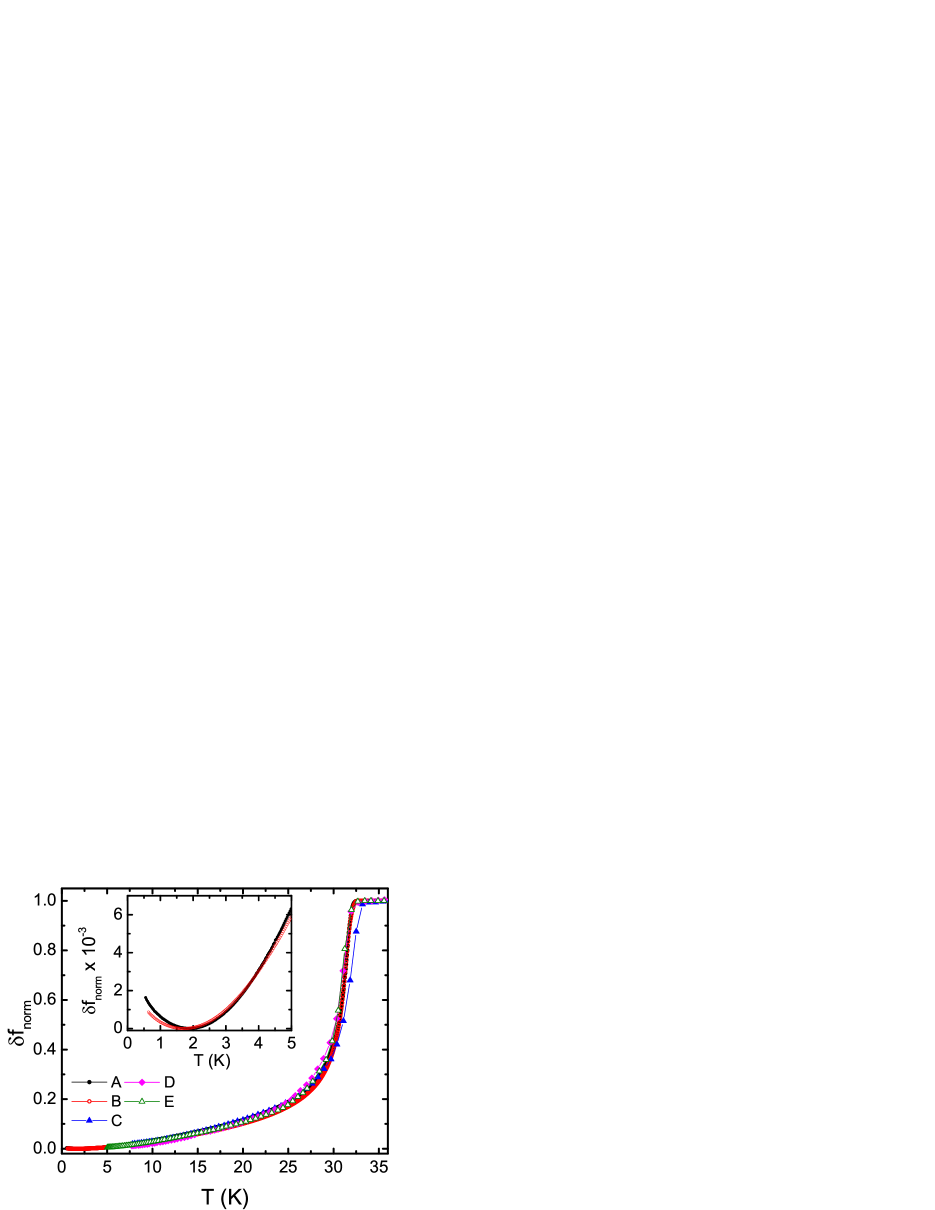
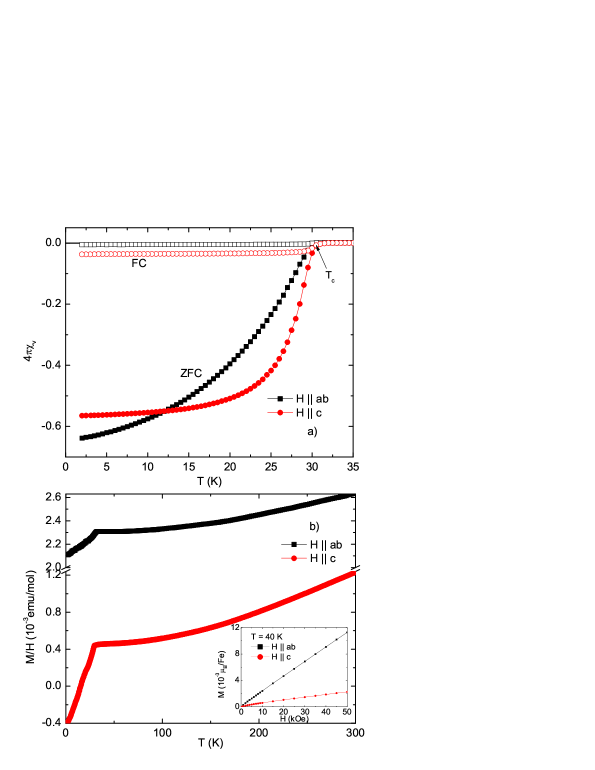
Figure 3a shows the magnetic susceptibility of K0.80Fe1.76Se2 for two directions of an applied field of 50 Oe. For , the zero-field-cooled (ZFC) curve decreases slowly with temperature and for the transition becomes sharper. Similar behavior can be seen in Tl0.58Rb0.42Fe1.72Se2.Wanghd This temperature dependence of the ZFC curve is similar to an inhomogeneous superconductor with a range of transition temperatures and may be related to the small spread of stoichiometry found in WDS data. Both of the ZFC curves in Fig. 3a approach -0.6 consistent with substantial shielding and inferred from both curves is the same, K, within experimental error. The magnetic susceptibility M/H (H = 50 kOe) as a function of temperature for both field directions is shown in Fig. 3b. Similar temperature dependence is observed for both field directions, i.e. M/H decreases almost linearly with decreasing temperature above 150 K and shows a sudden drop below 30 K associated with superconductivity. is clearly larger than over the whole temperature range. No anomalies in magnetic susceptibility can be correlated with the broad maxima in resistivity. The linear field dependence of magnetization at 40 K for both directions (Fig. 3b inset) indicates that there are no ferromagnetic impurities, and the non-Curie-Weiss like temperature of the susceptibility indicates that the system might be deep in an antiferromagnetic state, consistent with what was suggested for Cs0.8Fe2Se1.96Sher and K0.8Fe1.6Se2Weibao .
Specific heat data was collected to verify the bulk thermodynamic nature of the superconducting transition. vs at low temperature is shown in Fig. 4 on a log-log plot. In the superconducting state, below 15 K, roughly follows a power law. This implies a dominant phonon contribution and a very small electronic term. vs T is plotted in the inset for and a clear jump of specific heat associated with the superconducting transition at 31.6 K is seen and mJ/mol K2, can be identified. The jump is substantially less than jump seen for K-doped Ba122 samples; in comparison to the versus presented by Bud’ko et al.BNC , this jump is 15% of what would be expected from a doped 122 material.NiBaK
The thermoelectric power (TEP) as a function of temperature is shown in Fig. 5. Three different samples with different eletrical and thermal contact were shown to have consistent K inferred from . The data for three samples are similar over the whole temperature range. The origins of local minimum and maximum found between K are not clear, but it is very likely that they are associated with the multiband structure of K0.80Fe1.76Se2 and the crossover (metal-like at low temperature) observed in resistivity. The negative sign of the thermopower indicates that electron like carriers are dominant, thus in agreement with the observation of electron only pockets at the Fermi surface by Angle Resolved Photoemission Spectroscopy (ARPES).Qian The large absolute value of S above 50 K is similar to TEP data observed for Co-doped BaFe2As2EDMun and has been reproduced by other, recent TEP measurements. KFWang ,YJYan
IV.2
London penetration depth and magneto-optical
imaging
London penetration depth measurements with good reproducibility were performed on several single crystal samples. Figure 6 shows the normalized frequency shift, proportional to differential magnetic susceptibility, , where is the resonant frequency at the lowest temperature 0.5 K and is the frequency in the normal state right above . Consistent measurements on several samples indicate little or no variation within the batch. The transition itself is quite unusual - it shows quite a sharp onset, but then is smeared almost over the entire temperature interval. This also might be due to the small variation of the stoichiometry or impurities. It is also possible that the observed behavior is indicative of strongly anisotropic gap function or even nodes. In addition, there is a clear upturn at low temperatures. It has been shown in both, high-Tc cupratesRuslan0 and 1111 pnictidesMartin that this upturn can be caused by the paramagnetic ions.
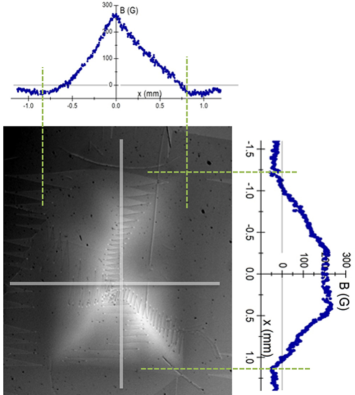
Magneto-optical imaging can shed more light on the homogeneity of the superconducting state (at least for length scales larger than the wavelength of optical light) and gives a rough estimate critical current density. A magneto-optical image of a trapped flux in a field-cooled sample is shown in Fig. 7. We did not observe any noticeable Meissner expulsion, similar to other 122 pnictides.Ruslan1 When magnetic field was turned off, it revealed a typical “Bean” roof, again similar to other pnictide superconductors.Ruslan2 ,Ruslan3 As can be seen in Fig. 7, the magnetic flux distribution is relatively uniform; however, some macroscopic variations (upper left corner) might indicate some smooth variation of stoichiometry across the sample and may help to explain the broadened transition curves. In order to quantify the critical state, Fig. 7 also shows profiles of the magnetic induction taken along two lines (shown in the figure). The remanence reaches about 250 Oe. A simple one-dimensional estimate, using
gives:
This shows that the current samples cannot support large critical current density even at low temperatures. Similar numbers are estimated from the magnetization measurements.Cedomir
IV.3 Anisotropic Hc2(T)
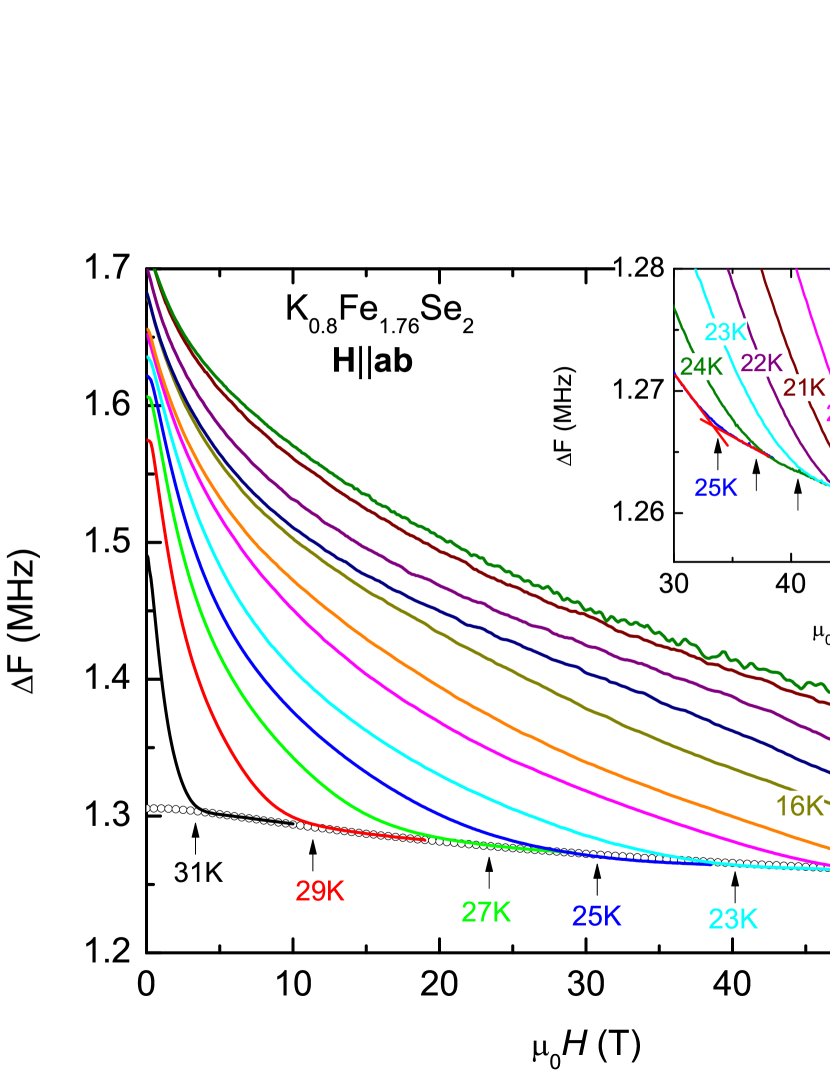
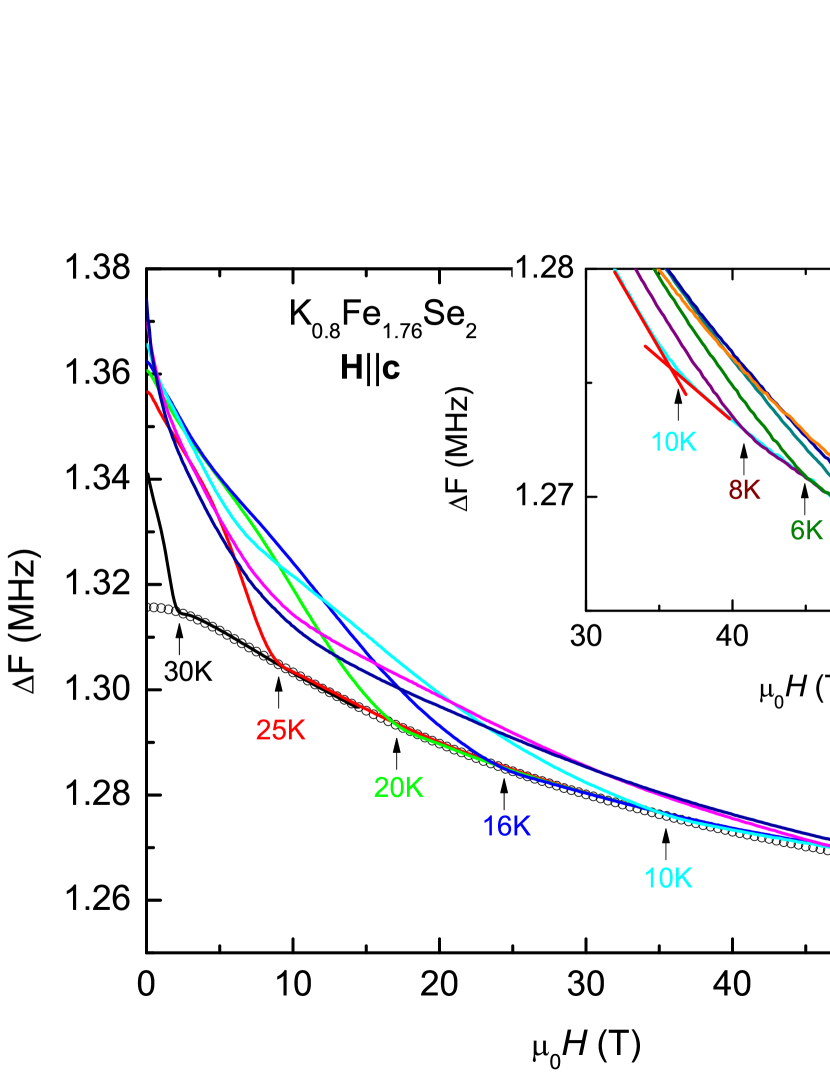
The anisotropic curves for K0.8Fe1.76Se2 are inferred from measurements of magnetoresistance (for 14 T) and from high magnetic field measurements of radio frequency (rf) contactless penetration depth for applied field both parallel () and perpendicular () to the tetragonal c-axis. Figure 8a shows the temperature dependence of the normalized resistivity for the K0.8Fe1.76Se2 sample. The offset and zero-resistance () temperatures were estimated to be 32.2 K and 32 K, respectively, as shown in Fig. 8b. The solid lines in Fig. 8b are warming curves of the rf shift (F) at = 0 for two different samples. As the temperature decreases, the rf shift suddenly increases at , where = 32 and 32.4 K for two samples were determined from dF/d. A clear anisotropy in the response of the superconductivity under applied fields was observed between and as shown in Fig. 8b for = 14 T curves. To compare the superconducting transition between resistance and F measurement, resistance data measured in a superconducting magnet and F taken in pulsed magnetic fields at = 31 K for and at = 28 K for are plotted in Figs. 8c and d, respectively. As shown in the figures, the deviation from the background signal of F is close to the criterion of the resistance curves.
The F vs plots shown in Figs. 9 and 10 can be used to infer the temperature dependence of the upper critical field by simply taking the first point deviating from the normal state background. Arrows in Figs. 9 and 10 indicate the determined . The difference between the values determined by the first deviation and slope change point criteria was used to determine the error bar size.
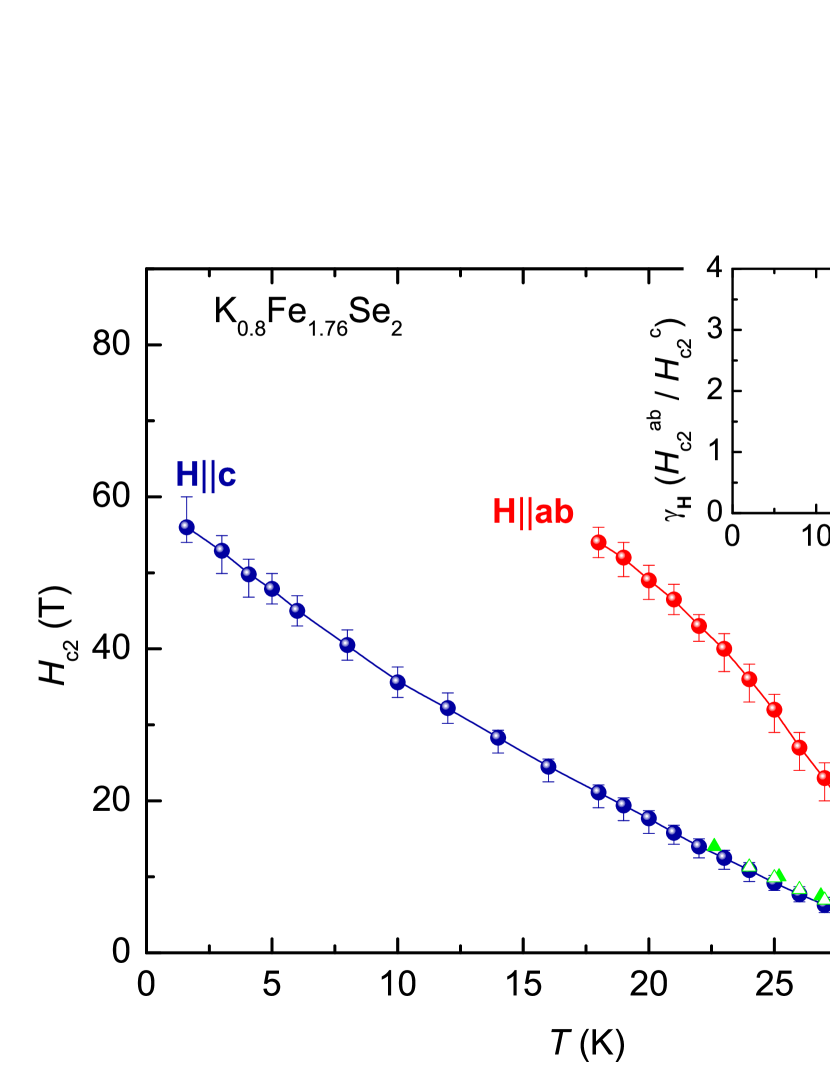
The () curves for both () and () in K0.8Fe1.76Se2 are plotted in Fig. 11, as determined from the T resistance and from the T data taken from the down sweep of pulsed field magnetic field rf measurements. The curvature of () has been reported to vary depending on the criteria used to determine , for example in the case of highly two dimensional, high- cuprate superconductors. Ando1999 In this study, the shape of curves does not change qualitatively when is defined by different criteria or even different measurements. On the other hand, the shapes of the upper critical field curves for and clearly do not manifest the same temperature dependence. As is evidenced from Fig. 11, a conventional linear field dependence of is observed close to the , with clearly different slopes for the two field orientations. In the low field region the curves are consistent with earlier studies.Wangdm ,Mizuguchi Towards higher fields, () presents an almost linear temperature dependence down to 1.5 K, whereas the curve of () has a tendency to saturate. The anisotropy parameter, , is about 2 near , but shows a maximum around 27 K with 3.6, and decreases considerably for lower temperatures. In all known examples so far, the temperature dependence of was opposite to that of . It would be interesting to examine in this material, in particular to see if it goes through a minimum at K.
The zero temperature limit of can be estimated by using the Werthamer-Helfand-Hohenberg (WHH) theoryWerthamer1966 , which gives = 0.69(d/d). The value of (0) for and were estimated to be 102 T and 31 T respectively, where = 32 K, d/d -4.6 T/K and d/d -1.4 T/K were used. Clearly these values do not capture the salient physics for this compound. On the other hand, in the simplest approximation, the Pauli limit () is given by 1.84, Clogston1962 Maki1966 giving 59 T. This low temperature value of may indeed capture some of the basic physics associated with K0.8Fe1.76Se2. To explain the observed curves in detail, a more complete theoretical treatment is needed, one that does not exclude the strong electron-phonon coupling and multiband nature of Fe-based compounds. Anisotropic superconducting coherence length can be calculated using and . Poole2000 If T and is assumed to be between 60 and 100 T, then nm, and 1.4 nm nm.
The behavior of () for K0.8Fe1.76Se2 is found to be very similar to that of several 122 systems as well as doped FeSe.Altarawneh2008 ,Ni2008 Kano2009 It should be noted that the curves for two orientations in K-doped BaFe2As2 system seem to cross at low temperature due to the flattening of () curve, Altarawneh2008 ,Yuan2009 additionally, the curves for FeTe0.6Se0.4 shows a crossing between and curves below 4.5 K because of the subsequent flattening of the curve at low temperatures.Khim2010 ,Fang2010R However in the Co-doped system, the anisotropic curves do not show such crossing, Ni2008 ,Kano2009 a result similar to what was found in this study. Thus, an intriguing feature of () curves for Co- and K-doped BaFe2As2, FeTe0.6Se0.4 and K0.8Fe1.76Se2 systems is that the anisotropy near is as large as 3 but drops towards 1 as K. The anisotropy in K0.8Fe1.76Se2 is particularly noteworthy given that it exists deep within an antiferromagnetically ordered state. Weibao2 ,Ryan2011 In the case of Co-doped Ba122, when with clear anisotropy only emerging when the antiferromagnetic state is suppressed. Ni2008
IV.4 57Fe Mössbauer spectroscopy
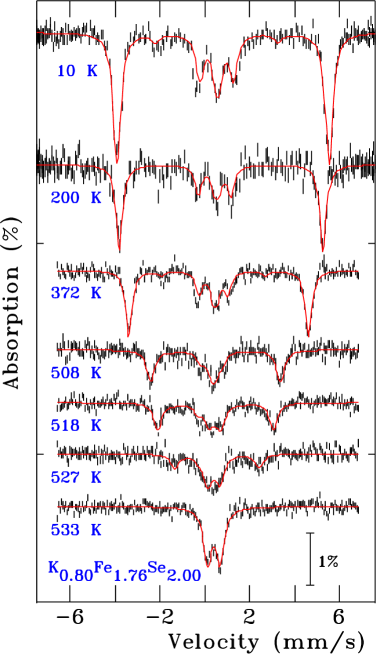
Room temperature neutron diffraction studies of CsyFe2-xSe2 Pomj1919 and AyFe2-xSe2 (A = Rb, K) Pomj3380 have suggested that the iron moments may be much smaller (2.5 /Fe) and also that the magnetic structure may be far more complex than initially suggested, with the iron atoms being distributed among two (magnetically) inequivalent sublattices and carrying very different magnetic moments. Moreover, even the ordering direction has been questioned and it is possible that the iron moments may lie in the ab-plane, at least for CsyFe2-xSe2 Pomj1919 , rather than parallel to the c-axis as initially suggested Weibao . Given the these questions surrounding the magnetic ordering of the iron moments in the AyFe2-xSe2 system, we have undertaken a 57Fe Mössbauer study K0.8Fe1.76Se2. Whereas Mössbauer spectroscopy cannot be used to determine magnetic structures directly, it is a quantitative local probe that can be used to set hard limits on possible structures. As we will show below, the observation of a single, well-split magnetic component allows us to rule out any structure in which the iron sub-lattice is further subdivided into multiple, inequivalent sites, and the scale of the splitting (29 T at 10 K) is consistent with the 3.31 moment derived from neutron scattering Weibao
Several conclusions can be reached simply by inspection of the spectrum taken at 10 K (Fig. 12). The spectrum is dominated by a single, well-split, magnetic component. This confirms that K0.8Fe1.76Se2 is indeed magnetically ordered in the superconducting state (recall K for this sample). A small quadrupole splitting of 0.330.02 mm/s is present and the linewidth (full width at half maximum) is 0.2000.007 mm/s, slightly larger than our typical instrumental width of 0.15 mm/s. The single magnetic component allows us to rule out any magnetic structures involving multiple iron sub-sites with moments that differ by more than a few percent. As we will show below, the large hyperfine field (29 T) is inconsistent with a small iron moment and so places further limits on possible magnetic structures. Finally, two of the lines normally present in a magnetically split 57Fe Mössbauer spectra, are essentially absent from the 10 K pattern.
A magnetic field at the 57Fe nucleus, either externally applied or transferred from an ordered moment on the iron atom, lifts the degeneracy of the nuclear states and, in combination with the selection rules for the transition, leads to a six-line pattern with intensities of 3:R:1:1:R:3 (counting from left to right in Fig. 12). For a powder sample, R=2, however if there is a unique angle, , between the magnetic field and the direction of the beam used to record the spectrum, then the intensity, R, of the transitions is given by:
R = 0 implies that is also zero so that the magnetic field, and by extension, the moments that lead to it, are parallel to the beam. Since the sample consists of an ab-plane mosaic of single crystals, setting means that the magnetic ordering direction is parallel to the c-axis, ruling out any magnetic structures that involve planar ordering of the iron moments. We note that R is a relatively soft function of near zero, and a free fit to the intensity of the transitions is consistent with an angle of 18, and leads to a slight improvement in the least square fit error, , for the fit. Such an angle would not be consistent with a purely planar ordering of the iron moments (indeed, if the ordering were planar, then R would be 4, and the transitions would provide the strongest features in the spectrum) but it is too large to be dismissed as being due to a simple mis-alignment of the mosaic. This suggests that there is a small canting of the antiferromagnetic structure away from the c-axis.
Estimating the iron moment from the observed hyperfine field requires some care as the scaling is imperfect at bestdubiel . However, some data exist on binary iron–chalcogenides that can be used as a guide (Table I). If we use the factor of 6.2 T/ for Fe7Se8 with our measured of 29.4 T we obtain a rather large estimate of 4.7 /Fe for the iron moment in this system. This is significantly larger than the 3.31 /Fe reported on the basis of neutron diffractionWeibao , however it does suggest that the iron moment is indeed substantial as even the larger conversion factor for the sulphide yields 3.5 /Fe. If we assume that is at least proportional to the iron moment, then we can use the observed change in between 10 K and 293 K to scale the 3.31 /Fe observed at 11 KWeibao to get an estimate of 3.0 /Fe for the moment at room temperature for comparison with the much smaller value of 2.55 /Fe reported by Pomjakushin et al..Pomj3380 However, the strong temperature dependence of magnetic signal noted by Bao et al.Weibao suggests a very rapid decline in ordered moment to about 2.8 /Fe by room temperature. It is possible that much of the variation may be intrinsic to the material and its variable stoichiometry, so that combined measurements on a well characterised sample will be needed to settle this.
| Compound | Average | Average | Conversion |
|---|---|---|---|
| Bhf | moment | Factor | |
| (T) | /Fe | T/ | |
| Sulphides | |||
| Fe7Se8 | 26.8Kobayashi515 | 3.16powell014415 | 8.5 |
| Selenides | |||
| Fe7Se8 | 24.1Ok73 | 3.86 Andresen64 | 6.2 |
| Tellurides | |||
| Fe1.125Te | — | 2.07Fruchart169 | |
| Fe1+xTe | — | 1.96–2.03Bao247001 | |
| Fe1.068Te | — | 2.25Li054503 | |
| Fe1.05Te | — | 2.54Martinelli094115 | |
| Fe1.11Te | 11hermon74 | — | |
| Fe1.08Te | 10.34MizuguchiS338 | 4.3–5.2 |
Impurities may provide a possible origin for the variation in measured moments. Mössbauer spectroscopy, while sensitive to the presence of impurity phases, does not rely on normalisation to the total sample in order to determine moments, they come rather from the observed line splitting, and not the intensity. Neutron diffraction, by contrast, while providing far more information on the magnetic ordering, ultimately relies on peak intensities, normalized to the total nuclear scattering, to determine the magnetic moments. It is clear from the 10 K spectrum shown in Fig. 12 that there is a central paramagnetic component present that involves about 122% of the iron in the sample. Such high apparent impurity levels in single crystal samples that had no impurities detected by powder x-ray diffraction, deserves further attention. If the paramagnetic component is not an “impurity” then it must either be intrinsic to the structure or a property of the material.
At the temperatures of interest here, K0.8Fe1.76Se2 adopts a vacancy-ordered modification of the parent ThCr2Sitype structure with iron essentially filling a 16 site and leaving ordered vacancies on the (almost) empty 4 site Pomj1919 ,Zava . Occupations of 8% for the Fe-4 site have been reported Zava . If we assume full occupation of the Fe-16 site in our sample, this leaves 9% of the iron in the 4 site. Partial occupation of the Fe-16 site would leave more iron to be accommodated in the 4 site. As we see no evidence for a second magnetic component that could be associated with iron in the 4 site, it is possible that the iron in these more isolated sites does not order, in which case our estimate of 9% in the 4 site is fully consistent with the 122% paramagnetic component observed in the Mössbauer spectrum.
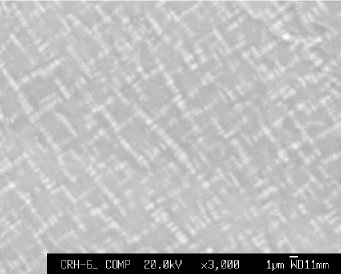
Another possible origin of the 122% non-magnetic Fe component in the low temperature (including room temperature) state can be seen in the backscattered electron analysis (BSE) image shown in Fig. 13. This image reveals that there is, at the micron scale, a modulation in the surface composition that can be correlated, through a preliminary line-scan analysis of the WDS data, with reductions of K content or increase of Fe content in the lighter regions. Auger electron analysis further confirmed this observation and gave a rough estimate of a composition of K0.9Fe1.7Se2 for the dark region and K0.6Fe1.9Se2 for the light region. It should be noted, though, that such patterns appear in samples grown by furnace cooling as well as samples decanted from a liquid meltHu1931 .
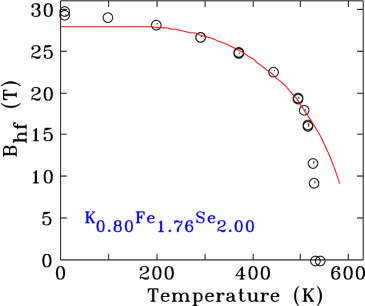
Raising the temperature leads to the expected decline in , however it is clear from Fig. 12 that magnetic order persists up to 530 K, confirming that K0.8Fe1.76Se2 has a remarkably high ordering temperature. The temperature dependence of shown in Fig. 14 yields an ordering temperature of K. However this is not the result of the fit to a J= Brillouin function shown in Fig. 14 as this predicts a transition temperature of 60030 K and the observed behaviour departs from this curve above 500 K. The two points that bracket the transition are at 530 K, where a clear magnetic signal is seen, and at 533 K where the sample is no longer magnetic, setting the transition at K.
A neutron diffraction study of K0.8Fe1.6Se2 found two regions in which the temperature dependence of the magnetic parameter was unusual Weibao . From 50 K to 450 K they found a linear dependence of the (101) magnetic peak intensity, suggesting that is a linear function of temperature. The clear curvature of (T) in this region, shown in Fig. 14, is not consistent with this form, as squaring our observed (T) to get something that would scale with the scattering intensity in a neutron diffraction pattern leads to increased curvature rather than linear behaviour.
Above 500 K, Wei Bao et al. reported a very rapid decrease in the
(101) intensity Weibao leading to an ordering temperature of 560 K. Whereas our sample composition is slightly different and our ordering
temperature slightly lower, we see the same abrupt loss of magnetic
order in Fig. 14. It is noteworthy that magnetic susceptibility
measurements show somewhat smaller than that revealed by neutron
diffraction but very similar to that indicated by Mössbauer
spectrum in this article.Weibao2 ,YJYan ,RHLiu
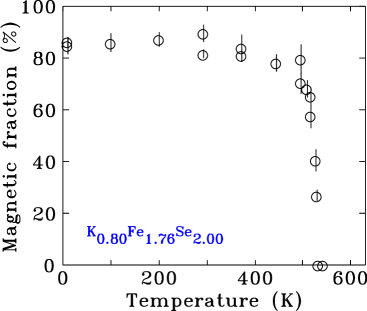
Inspection of the spectra above 500 K shown in Fig. 12 reveals
that the intensity of the magnetic peaks decreases visibly as their
splitting falls. The ability to uniquely separate the amount of a magnetic
phase (seen through line intensities) from the magnitude of the magnetic
order (seen independently through line splittings) is an important strength
of Mössbauer spectroscopy. Tracking the fraction of the iron that is
present as a magnetically ordered form (Fig. 15) confirms that
the magnetic phase is disappearing even faster than the splitting that marks
the order. This strongly suggests that the magnetic phase is transforming
before it reaches its true ordering temperature (which we estimate to be
about 600 K) and that the observed transition is being driven by a first
order structural event. This view is supported by the neutron diffraction
work of Wei Bao et al. Weibao where they also tracked the
intensity of the (110) structural peak that is associated with the
vacancy-ordered structure of b below 580 K. This peak starts to lose
intensity at the same temperature at which the (101) magnetic peak starts
its sudden decline. As we see both a weakening of the magnetic order and a
reduction in the magnetic fraction above 500 K, it is possible that the
break-up of the vacancy-ordered magnetic form reduces the magnetic
connectivity of the ordered phase until it forms a non-percolating network
of finite clusters. The magnetic order is then lost at a temperature below
both its intrinsic ordering temperature, and the temperature at which the
vacancy-ordered structure fully transforms to the high-temperature form.
IV.5 Phase separation and possible superconducting aerogel
The data presented so far offer a rather contradictory set of observations. On one hand K0.8Fe1.76Se2 appears to have a high value of , a fair-sized shielding fraction, and anisotropy that is consistent with many of the other Fe-based superconductors. On the other hand, the electrical resistivity of K0.8Fe1.76Se2 is anomalously high, with increasingly non-metallic temperature dependence depending on precise Fe stoichiometry, the specific heat jump, is relatively small, and there is large, local moment-like antiferromagnetic order of the Fe sublattice with a first order transition near 530 K. If the sample were to be considered homogeneous, with all of these features being associated with the same, single phase, then we would need to consider K0.8Fe1.76Se2 to be an anomalous and very different type of Fe-based superconductivity.
As it stands, though, there are several indications, in the data presented, that K0.8Fe1.76Se2 is not homogeneous, but rather is phase separated into a non-magnetically ordered, minority phase that is superconducting and a majority phase that manifest high temperature, large moment, antiferromagnetic order and is probably near insulating.
The Mössbauer and electron microscopy data shown in Figures 1.12 - 1.15 indicate that there may well be a mesoscopic phase separation into a majority phase with a large hyperfine field on the Fe site and a minority phase with essentially no hyperfine field on the Fe site. This, combined with the reduced jump in and the apparently high electrical resistivity, point toward a scaffold-like network (or aerogel-like pattern) of conducting (and below 30 K, superconducting) phase that exists on a sub-micron length scale. Such a network would be consistent with the moderate shielding seen in the ZFC low field magnetization data as well as the magneto optical results. Such a phase separated, minority, superconducting phase would allow the majority phase to host the large moment antiferromagnetism and also be a poor conductor, explaining the curious composite resistivity data that is so sensitive on Fe stoichiometry. It is important to note, though, that given the clear anisotropy in data, this minority phase has to remain, at least partially, oriented with the host matrix. Given the similarity in anisotropy between K0.8Fe1.76Se2 and other Fe-based superconductors, it is tempting to assume that the orientation of the minority phase is closer to complete than to random, but this will need to be tested directly. After our initial reports of phase separationRyan2011 , the phase separation scenario in KxFe2-ySe2 is proposed by more and more recent reports, from Transmission Electron MicroscopyJQLi ,ZWang , single-crystal XRDRicci and magnetic hysteresis loops.HHWenEPL
V Summary
KxFe2-ySe2 superconductor has been extensively studied since its discovery. But the non-stoichiometry present a complex material problem that hinders better understanding of its properties. Our single crystal growth from the furnace-cooled and decanted methods implies that it is grown from excess Fe-Se flux and crystals with similar stoichiometry can be obtained from both methods with 30 K. Single crystals of K0.8Fe1.76Se2 exhibit moderate anisotropy in both magnetic susceptibility and electrical resistivity with and at 300 K. Broadened superconducting transitions seen in several measurements may be associated with a small variation of stoichiometry of the crystal, consistent with what was shown by WDS analysis. The upper critical field of K0.8Fe1.76Se2 is determined as (18 K) 54 T and (1.6 K) 56 T. The anisotropy parameter initially increases with decreasing temperature, passed through a maximum of near 27 K, then decreases to at 18 K. The observed values show a weakening anisotropic effect at low temperatures. Although the Fe-based superconductors have a layered crystal structure, a weak anisotropy of may be a common feature, suggesting that the inter-layer coupling and the three dimensional Fermi surface may play an important role in the superconductivity of this family. Our 57Fe Mössbauer spectroscopy study confirms the presence of magnetic order from well below K to K. The large magnetic splitting of 29.40.1 T at 10 K indicates that the iron moments are large, consistent with values of 3.3 /Fe observed by neutron diffraction at 11 KWeibao , while the line intensities indicate that the ordering is almost parallel to the c-axis. An apparent paramagnetic impurity phase can be attributed to iron atoms in the 4 site or the stoichiometry variation of the microstructure seen in BES image. Analysis of the spectra taken in the vicinity of shows that the magnetic fraction decreases rapidly above 500 K and that the loss of order is driven by a first order structural transition.
In addition to the above, conspicuous observations, there is growing evidence that K0.8Fe1.76Se2 is a phase separated sample, with a metallic (and at low temperature, superconducting) minority phase that does not manifest long range magnetic order and a majority phase that undergoes a first order, antiferromagnetic phase transition near 530 K and may well be either non-conducting or very poorly conducting. As such, K0.8Fe1.76Se2 would essentially be a superconducting aerogel embedded in a matrix of antiferromagnetic (near) insulator. If there is indeed such a phase separation, then K0.8Fe1.76Se2 can be understood, or at least categorized, as another example of Fe-based superconductivity similar at a qualitative level to other, better understood, and single phase, examples.
Acknowledgements
This work was carried out at the Iowa State University and supported by the AFOSR-MURI grant #FA9550-09-1-0603 (R.H. and P.C.C.). Part of this work was performed at Ames Laboratory, US DOE, under contract # DE-AC02-07CH 11358 (K.C., H.K., H.H., W.E.S., M.A.T., R.P., S.L.B. and P.C.C.). S.L.B. also acknowledges partial support from the State of Iowa through Iowa State University. R.P. acknowledges support from the Alfred P. Sloan Foundation.Work at the NHMFL-PFF is supported by the NSF, the DOE and the State of Florida. Mössbauer work was supported by the Natural Sciences and Engineering Research Council of Canada and Fonds Québécois de la Recherche sur la Nature et les Technologies. J.M.C. acknowledges support from the Canada Research Chairs programme.
References
- (1) Kenji Ishida, Yusuke Nakai, and Hideo Hosono, J. Phys. Soc. Jpn., 78 062001 (2009).
- (2) M. D. Lumsden and A. D. Christianson, J. Phys.: Condens. Matter, 22 203203 (2010).
- (3) Paul C. Canfield and Sergey L. Bud’ko, Annual Review of Condensed Matter Physics, 1, 27 (2010).
- (4) Johnpierre Paglione and Richard L. Greene, Nature Physics 6, 645 (2010).
- (5) X. C. Wang, Q. Q. Liu, Y. X. Lv, W. B. Gao, L. X. Yang, R. C. Yu, F. Y. Li, C. Q. Jin, Solid State Commun. 148, 538 (2008).
- (6) M. Rotter, M. Tegel, and D. Johrendt, Phys. Rev. Lett. 101, 107006 (2008).
- (7) Athena S. Sefat, Rongying Jin, Michael A. McGuire, Brian C. Sales, David J. Singh, and David Mandrus, Phys. Rev. Lett. 101, 117004 (2008).
- (8) N. Ni, M. E. Tillman, J.-Q. Yan, A. Kracher, S. T. Hannahs, S. L. Bud’ko, and P. C. Canfield, Phys. Rev. B 78, 214515 (2008).
- (9) A. Leithe-Jasper, W. Schnelle, C. Geibel, and H. Rosner, Phys. Rev. Lett. 101, 207004 (2008).
- (10) Y. Kamihara, T. Watanabe, M. Hirano, and H. Hosono, J. Am. Chem. Soc. 130, 3296 (2008).
- (11) X. H. Chen, T. Wu, G. Wu, R. H. Liu, H. Chen, and D. F. Fang, Nature 453, 761 (2008).
- (12) X. Zhu, F. Han, G. Mu, P. Cheng, B. Shen, B. Zeng, and H. H. Wen, Phys. Rev. B 79, 220512 (2009).
- (13) X. Zhu, F. Han, G. Mu, B. Zeng, P. Cheng, B. Shen, H. H. Wen, Phys. Rev. B 79 024516 (2009).
- (14) G. F. Chen, T. L. Xia, H. X. Yang, J. Q. Li, P. Zheng, J. L. Luo, N. L. Wang, Supercond. Sci. Tech. 22, 072001 (2009).
- (15) Rongwei Hu, Emil S. Bozin, J. B. Warren, and C. Petrovic, Phys. Rev. B 80, 214514 (2009).
- (16) Y. Mizuguchi, Y. Hara, K. Deguchi, S. Tsuda, T. Yamaguchi, K. Takeda, H. Kotegawa, H. Touand, Y. Takano, Supercond. Sci. Tech., 23 054013 (2010).
- (17) F. C. Hsu, J. Y. Luo, K. W. The, T. K. Chen, T. W. Huang, P. M. Wu, Y. C. Lee, Y. L. Huang, Y. Y. Chu, D. C. Yan and M. K. Wu, Proc. Nat. Acad. Sci. 105, 14262 (2008).
- (18) S. Medvedev, T. M. McQueen, I. Trojan, T. Palasyuk, M. I. Eremets, R. J. Cava, S. Naghavi, F. Casper, V. Ksenofontov, G. Wortmann and C. Felser, Nature Mater., 8 630 (2009).
- (19) Jiangang Guo, Shifeng Jin, Gang Wang, Shunchong Wang, Kaixing Zhu, Tingting Zhou, Meng He and Xiaolong Chen, Phys. Rev. B 82, 180520 (2010).
- (20) J. J. Ying, X. F. Wang, X. G. Luo, A. F. Wang, M. Zhang, Y. J. Yan, Z. J. Xiang, R. H. Liu, P. Cheng, G. J. Ye, X. H. Chen, Phys. Rev. B 83, 212502 (2011).
- (21) Chun-Hong Li, Bing Shen, Fei Han, Xiyu Zhu, Hai-Hu Wen, Phys. Rev. B 83, 184521 (2011).
- (22) Minghu Fang, Hangdong Wang, Chiheng Dong, Zujuan Li, Chunmu Feng, Jian Chen, H. Q. Yuan, EPL, 94 27009 (2011).
- (23) A. F. Wang, J. J. Ying, Y. J. Yan, R. H. Liu, X. G. Luo, Z. Y. Li, X. F. Wang, M. Zhang, G. J. Ye, P. Cheng, Z. J. Xiang, and X. H. Chen, Phys. Rev. B 83, 060512(R) (2011).
- (24) Z. Shermadini, A. Krzton-Maziopa, M. Bendele, R. Khasanov, H. Luetkens, K. Conder, E. Pomjakushina, S. Weyeneth, V. Pomjakushin, O. Bossen, A. Amato, Phys. Rev. Lett. 106, 117602 (2011).
- (25) Wei Bao, Q. Huang, G. F. Chen, M. A. Green, D. M. Wang, J. B. He, X. Q. Wang, Y. Qiu, Chinese Phys. Lett. 28, 086104 (2011).
- (26) V. Yu. Pomjakushin, D. V. Sheptyakov, E. V. Pomjakushina, A. Krzton-Maziopa, K. Conder, D. Chernyshov, V. Svitlyk, Z. Shermadini Phys. Rev. B 83, 144410 (2011).
- (27) Wei Bao, G. N. Li, Q. Huang, G. F. Chen, J. B. He, M. A. Green, Y. Qiu, D. M. Wang, J. L. Luo, arXiv:1102.3674 (2011).
- (28) R. Hu, K. Cho, H. Kim, H. Hodovanets, W. E. Straszheim, M. A. Tanatar, R. Prozorov, S. L. Bud’ko, P. C. Canfield, Supercond. Sci. Technol. 24 065006 (2011).
- (29) E. D. Mun, M.M. Altarawneh, C. H. Mielke, V. S. Zapf, R. Hu, S. L. Bud’ko, P. C. Canfield, Phys. Rev. B 83, 100514(R) (2011).
- (30) D. H. Ryan, W. N. Rowan-Weetaluktuk, J. M. Cadogan, R. Hu, W. E. Straszheim, S.L. Bud’ko, and P.C. Canfield, Phys. Rev. B 83, 104526 (2011).
- (31) Jeffrey E. Marchese, Matteo Cirillo, and Niels Grbech-Jensen, Phys. Rev. B 79, 094517 (2009).
- (32) Eundeok Mun, Sergey L. Bud’ko, Milton S. Torikachvili, and Paul C. Canfield, Meas. Sci. Technol 21, 21055104(2010).
- (33) R. Prozorov and R.W. Giannetta, Supercond. Sci. Tech. 19, R41 (2006).
- (34) L. A. Dorosinskii, M. V. Indenbom, V. I. Nikitenko, Yu. A. Ossip’yan, A. A. Polyanskii, and V. K. Vlasko-Vlasov, Physica C 203, 149 (1992).
- (35) Ch. Jooss, J. Albrecht, H. Kuhn, S. Leonhardt, and H. Kronmuller, Rep. Prog. Phys. 65, 651 (2002).
- (36) C. Mielke, J. Singleton, M.-S. Nam, N. Harrison, C. C. Agosta, B. Fravel, and L. K. Montgomery, J. Phys.: Condens. Matter 13, 8325 (2001).
- (37) T. Coffey, Z. Bayindir, J. F. DeCarolis, M. Bennett, G. Esper, and C. C. Agosta, Rev. Sci. Instrum. 71, 4600 (2000).
- (38) M. M. Altarawneh, C. H. Mielke, and J. S. Brooks, Rev. Sci. Instrum. 80, 066104 (2009).
- (39) M. M. Altarawneh, K. Collar, C. H. Mielke, N. Ni, S. L. Bud’ko, and P. C. Canfield, Phy. Rev. B 78, 220505(R) (2008).
- (40) D. M. Wang, J. B. He, T.-L. Xia, G. F. Chen, Phys. Rev. B 83, 132502 (2011).
- (41) Y. Zhang, L. X. Yang, M. Xu, Z. R. Ye, F. Chen, C. He, J. Jiang, B. P. Xie, J. J. Ying, X. F. Wang, X. H. Chen, J. P. Hu, D. L. Feng, Nature Materials 10, 273 (2011).
- (42) I.R. Shein, A.L. Ivanovskii, arXiv:1012.5164 (2010).
- (43) T. Qian, X.-P. Wang, W.-C. Jin, P. Zhang, P. Richard, G. Xu, X. Dai, Z. Fang, J.-G. Guo, X.-L. Chen, H. Ding, Physical Review Letters 106, 187001 (2011).
- (44) Yoshikazu Mizuguchi, Hiroyuki Takeya, Yasuna Kawasaki, Toshinori Ozaki, Shunsuke Tsuda, Takahide Yamaguchi and Yoshihiko Takano, Appl. Phys. Lett. 98, 042511 (2011).
- (45) D. A. Torchetti, M. Fu, D. C. Christensen, K. J. Nelson, T. Imai, H. C. Lei, C. Petrovic, Phys. Rev. B 83 104508 (2011).
- (46) P. Zavalij, W. Bao, X. F. Wang, J. J. Ying, X. H. Chen, D. M. Wang, J. B. He, X. Q. Wang, G.F Chen, P-Y Hsieh, Q. Huang, M. A. Green, Phys. Rev. B 83, 132509 (2011).
- (47) Z. Fisk, J. P. Remeika, in: K. A. Gschneider, J. Eyring (Eds.), Handbook on the Physics and Chemistry of Rare Earths, Vol. 12, Elsevier, Amsterdam, (1989).
- (48) P. C. Canfield, Z. Fisk Phil. Magaz. B 65, 1117 (1992).
- (49) M. A. Tanatar, N. Ni, G. D. Samolyuk, S. L. Bud’ko, P. C. Canfield, R. Prozorov, Phys. Rev. B 79, 134528 (2009).
- (50) Hangdong Wang, Chihen Dong, Zujuan Li, Shasha Zhu, Qianhui Mao, Chunmu Feng, H. Q. Yuan, Minghu Fang, Europhys. Letts. 93 47004 (2011).
- (51) Sergey L. Bud’ko, Ni Ni, and Paul C. Canfield, Phys. Rev. B 79, 220516(R) (2009).
- (52) N. Ni, S. L. Bud’ko, A. Kreyssig, S. Nandi, G. E. Rustan, A. I. Goldman, S. Gupta, J. D. Corbett, A. Kracher, and P. C. Canfield, Phys. Rev. B 78, 014507 (2008).
- (53) Eun Deok Mun, Sergey L. Bud’ko, Ni Ni, Alex N. Thaler, and Paul C. Canfield, Phys. Rev. B 80, 054517 (2009).
- (54) Kefeng Wang, Hechang Lei, C. Petrovic, Phys. Rev. B 83, 174503 (2011).
- (55) Y. J. Yan, M. Zhang, A. F. Wang, J. J. Ying, Z. Y. Li, W. Qin, X. G. Luo, J. Q. Li, Jiangping Hu, X. H. Chen, arXiv:1104.4941 (2011).
- (56) R. Prozorov and R.W. Giannetta, P. Fournier and R.L. Greene, Phys. Rev. Lett. 85, 3700 (2000).
- (57) C. Martin, M. E. Tillman, H. Kim, M. A. Tanatar, S. K. Kim, A. Kreyssig, R. T. Gordon, M. D. Vannette, S. Nandi, V. G. Kogan, S. L. Bud’ko, P. C. Canfield, A. I. Goldman, and R. Prozorov, Phys. Rev. Lett. 102, 247002 (2009).
- (58) R. Prozorov, M. A. Tanatar, Bing Shen, Peng Cheng, Hai-Hu Wen, S. L. Bud’ko, and P. C. Canfield, Phys. Rev. B 82, 180513(R) (2010).
- (59) R. Prozorov, M. E. Tillman, E. D. Mun, P. C. Canfield, New Journal of Physics 11, 035004 (2009).
- (60) R. Prozorov, N. Ni, M. A. Tanatar, V. G. Kogan, R. T. Gordon, C. Martin, E. C. Blomberg, P. Prommapan, J. Q. Yan, S. L. Bud’ko, and P. C. Canfield, Phys. Rev. B 78, 224506 (2008).
- (61) Hechang Lei, C. Petrovic, Phys. Rev. B 83, 184504 (2011).
- (62) Y. Ando, G. S. Boebinger, A. Passner, L. F. Schneemeyer, T. Kimura, M. Okuya, S. Watauchi, J. Shimoyama, K. Kishio, K. Tamasaku, N. Ichikawa, and S. Uchida, Phys. Rev. B 60 12475 (1999).
- (63) N. R. Werthamer, E. Helfand, and P. C. Hohemberg, Phys. Rev. 147, 295 (1966).
- (64) A. M. Clogston, Phys. Rev. Lett. 9, 266 (1962).
- (65) B. S. Chandrasekhar, Appl. Phys. Lett. 1, 7 (1962).
- (66) K. Maki, Phys. Rev. 148, 362 (1966).
- (67) Charles P. Poole, Jr. (editor) Handbook of Superconductivity (Academic Press, San Diego) (2000).
- (68) N. Ni, M. E. Tillman, J.-Q. Yan, A. Kracher, S. T. Hannahs, S. L. Bud’ko, and P. C. Canfield, Phys. Rev. B 78 214515 (2008).
- (69) H. Q. Yuan, J. Singleton, F. F. Balakirev, S. A. Baily, G. F. Chen, J. L. Luo and N. L. Wang, Nature(London) 457, 565 (2009).
- (70) M. Kano, Y. Kohama, D. Graf, F. Balakirev, A. S. Sefat, M. A. McGuire, B. C. Sales, D. Mandrus, and S. W. Tozer, J. Phys. Soc. Jpn. 78 084719 (2009).
- (71) S. Khim, J. W. Kim, E. S. Choi, Y. Bang, M. Nohara, H. Takagi, and K. H. Kim, Phys. Rev. B 81, 184511 (2010).
- (72) M. H. Fang, J. H. Yang, F. F. Balakirev, Y. Kohama, J Singleton, B. Qian, Z. Q. Mao, H. D. Wang and H. Q. Yuan, Phys. Rev. B 81, 020509(R) (2010).
- (73) V. Yu. Pomjakushin, E. V. Pomjakushina, A. Krzton-Maziopa, K. Conder, Z. Shermadini, J. Phys.: Condens. Matter 23 156003 (2011).
- (74) S.M. Dubiel, J. Alloys Compounds 488, 18 (2010).
- (75) H. Kobayashi, M. Sato, T. Kamimura, M. Sakai, H. Onodera, N. Kuroda and Y. Yamaguchi, J. Phys.: Condens. Matter, 9, 515 (1997).
- (76) A.V. Powell, P. Vaqueiro, K.S. Knight, L.C. Chapon, and R.D. Sánchez, Phys. Rev. B 70, 014415 (2004).
- (77) H.N. Ok and S.W. Lee, Phys. Rev. B 8, 4267 (1973).
- (78) A.F. Andresen and J. Leciejewicz, J. de Phys. 25, 574 (1964).
- (79) D. Fruchart, P. Convert, P. Wolfers, R. Madar, J.P. Senateur and R. Fruchart, Mater. Res. Bull. 10, 169 (1975).
- (80) Wei Bao, Y. Qiu, Q. Huang, M.A. Green, P. Zajdel, M.R. Fitzsimmons, M. Zhernenkov, S. Chang, M. Fang, B. Qian, E.K. Vehstedt, J. Yang, H.M. Pham, L. Spinu, and Z.Q. Mao, Phys. Rev. Lett. 102, 247001 (2009).
- (81) S. Li, C. de la Cruz, Q. Huang, Y. Chen, J.W. Lynn, J. Hu, Y.-L. Huang, F.-C. Hsu, K.-W. Yeh, M.-K. Wu, and P. Dai, Phys. Rev. B 79, 054503 (2009).
- (82) A. Martinelli, A. Palenzona, M. Tropeano, C. Ferdeghini, M. Putti, M.R. Cimberle, T.D. Nguyen, M. Affronte, and C. Ritter, Phys. Rev. B 81, 094115 (2010).
- (83) E. Hermon, W.B. Muir, J. Quaroni, and R.C. Sweet, Can. J. Phys. 52, 1800 (1974).
- (84) Y. Mizuguchi, T. Furubayashi, K. Deguchi, S. Tsuda, T. Yamaguchi, Y. Takano, Physica C 470, S338 (2010).
- (85) J. Q. Li, Y. J. Song, H. X. Yang, Z. Wang, H. L. Shi, G. F. Chen, Z.W. Wang, Z.Chen, H. F. Tian, arXiv:1104.5340 (2011).
- (86) Z. Wang, Y. J. Song, H. L. Shi, Z. W. Wang, Z. Chen, H. F. Tian, G. F. Chen, J. G. Guo, H. X. Yang, and J. Q. Li1, Phys. Rev. B 83, 140505(R) (2011).
- (87) Alessandro Ricci, Nicola Poccia, Boby Joseph, Gianmichele Arrighetti, Luisa Barba, Jasper Plaisier, Gaetano Campi, Yoshikazu Mizuguchi, Hiroyuki Takeya, Yoshihiko Takano, Naurang Lal Saini and Antonio Bianconi, Supercond. Sci. Technol. 24 082002, (2011).
- (88) B. Shen, B. Zeng, G. F. Chen, J. B. He, D. M. Wang, H. Yang, H. H. Wen, EPL 96 37010 (2011).
- (89) R. H. Liu, X. G. Luo, M. Zhang, A. F. Wang, J. J. Ying, X. F. Wang, Y. J. Yan, Z. J. Xiang, P. Cheng, G. J. Ye, Z. Y. Li and X. H. Chen, EPL 94 27008 (2011).