Topological Trends of Internet Content Providers
Abstract
The Internet is constantly changing, and its hierarchy was recently shown to become flatter. Recent studies of inter-domain traffic showed that large content providers drive this change by bypassing tier-1 networks and reaching closer to their users, enabling them to save transit costs and reduce reliance of transit networks as new services are being deployed, and traffic shaping is becoming increasingly popular.
In this paper we take a first look at the evolving connectivity of large content provider networks, from a topological point of view of the autonomous systems (AS) graph. We perform a 5-year longitudinal study of the topological trends of large content providers, by analyzing several large content providers and comparing these trends to those observed for large tier-1 networks. We study trends in the connectivity of the networks, neighbor diversity and geographical spread, their hierarchy, the adoption of IXPs as a convenient method for peering, and their centrality. Our observations indicate that content providers gradually increase and diversify their connectivity, enabling them to improve their centrality in the graph, and as a result, tier-1 networks lose dominance over time.
I Introduction
The Internet is a constantly evolving network, quickly adapting to customer needs and financial forces. Up until recently it was common to picture an hierarchical Internet [16, 12, 7], in which networks are either tier-1, large networks that provide global transit functionalities, tier-2, smaller Internet Service Providers (ISPs) that provide Internet connectivity to their customers, or stub networks that produce and consume content [39].
However, in recent years the Internet is changing. The appearance and rapid growth of large content providers, such as Google, Yahoo! and others, is gradually changing the roles of key Internet players to accommodate their needs. First, large content providers produce huge amount of content that is consumed by users around the globe, inducing heavy traffic on tranist networks. Although wholesale transit prices are decreasing by roughly 30% each year [32], and transit providers offer various wholesale pricing plans to accommodate these needs, such as tiered prices [39], content providers still seek ways to significantly cut transit costs. Furthermore, as content providers deploy an increasing number of Software as a Service (SaaS), such as elastic computing, collaboration tools, storage and even complete content delivery networks (CDNs), they seek to reduce reliance on transit providers that were reported to perform traffic shaping [6, 9].
As a result of these trends, the Internet was reported to be forming a flatter and denser network [17, 21, 11], mostly using observations of traffic flows. In this paper we take a first look at the changing connectivity of large content provider networks, from a topological point of view. Unlike previous work that studied various traffic characteristics [14, 26, 21], we consider the trends observed in the connectivity of the networks in the Autonomous Systems (AS) graph.
We achieve this using a 5-year longitudinal study of the AS graph, focusing on 5 major content providers: Google, Yahoo!, MSN, Amazon, and Facebook. The first three are well established, large content providers, that have been around before the beginning of our study, in 2006. Amazon provides a unique opportunity to study a content provider that changed its scope (from an online store to a cloud service host) and Facebook reveals the high-paced growth of an extremely popular content provider. Using a comparative approach, we examine 5 major transit providers, namely AT&T, Qwest, Level3, Sprint, and Global Crossing (Glbx). All of these are large, tier-1 transit networks [33], that have been used by content providers for transit services over the years.
In this paper we create a snapshot of the AS-level graph every 3 months, using a month of active traceroutes, from late 2006 till early 2011. We then study the connectivity trends, meaning, how content and transit providers are connected and evolve over time. We look at the number of neighboring ASes, types of networks they connect with and spatial spread for understanding these trends. We then look at the adoption of IXPs which are a convenient and cost-effective method for peering between ASes. We then study the changes in the hierarchal position of content providers and conclude with studying their centrality.
Understanding the evolving trends of AS connectivity has implications on different aspects of the Internet ecosystem. The decreasing dominance of large transit providers we observe indicates a change in the way traffic flows and networks interconnect. These in turn have direct implications on the operational decisions that drive ASes, their connectivity and profitability. Additionally, understanding these trends can help improve Internet research, such as growth models [11] and traffic flow analysis [21].
II Related Work
Several recent papers study the emerging change in the Internet ecosystem, which is driven mostly by large scale content providers. One of the early observations of this change was made by Gill et al. [17]. The authors showed that large content providers bypass many tier-1 ISPs by pushing their networks closer to the users, and suggested that such a trend can possibly flatten the Internet.
Kuai et al. [20], He et al. [19, 18], and more recently Augustin et al. [5] studied the AS-graph, and discuss in details methods for discovering IXP participants. These works report significantly higher number of peering relationships discovered among ASes that are IXP participants than among ASes that are not connecting via an IXP.
Dhamdhere and Dovrollis [11] presented a new Internet model that captures the Internet transition from a hierarchy of transit providers to a flatter interconnection of peers.
Most recently, Labovitz et al. [21] performed a large-scale two-year study of the inter-domain traffic, showing that the amount of traffic originated from content providers is rising, and most of it is routed outside of the traditional Internet core. Specifically, more than 5% of all inter-domain traffic in July 2009 originated from Google’s networks. Additionally, they showed that content providers often use their own networks for saving transit costs. As an example, YouTube inter-domain traffic was shown to decay rapidly by merging it into Google’s own peering and data centers.
III Methodology
For the purpose of this study we build the Internet AS graph every three months since January 2006 until July 2010. The AS graph is built by traversing IP-level traceroutes and resolving each IP into its corresponding AS. We resolve IP to AS using the published iPlane nano [24] database, which is a set of mappings between IP prefixes into ASes, collected from all major BGP monitors. This set contains 326,102 prefixes mapped to 30,779 ASes. IPs that were mapped into AS sets or multi-origin ASes (MOAS) were treated as unresolved.
Additionally, we used Internet Exchange (IXP) prefix mapping provided from [5]. The IXP list is comprised of prefix lists collected from Packet Clearing House (PCH) [2], PeeringDB [3] and additional manually collected sources. This list provides us with 393 prefixes belonging to 278 IXPs worldwide. We use the same IXP list, obtained in late 2009 for all years, assuming that the assignment of prefixes to IXPs did not decreased overtime, i.e., even if an IXP becomes defunct [2], there are only a few or no cases that a prefix, which was assigned to an IXP in 2009, was assigned to a real AS in other times.
Each AS graph is built by traversing AS traces of a single month, creating a link between two ASes that follow each other in the AS trace, or have an IP that belongs to an IXP prefix between them (the latter follows the technique described in [18] and extended in [5]).
For the IP-level traces we use two datasets, DIMES [35] and iPlane [23]. DIMES is a community-based Internet mapping effort, measurement from thousands of vantage points, located at user homes and since 2010 also in PlanetLab [8]. iPlane uses PlanetLab nodes and traceroute servers, measuring from a relatively stable set of 300 servers. Although DIMES, due to its diverse distribution, uncovers more links than iPlane [36], it suffers from vantage point churn, making its observed topology more “noisy” and susceptible to measurement artifacts. iPlane on the other hand, is more stable, both in the number of measuring vantage points and the target IPs, however its topology is smaller.
In this paper we are interested in global trends observed in the ecosystem of large Internet players. Since these networks are well observed by both DIMES and iPlane, we expect both platforms to capture similar trends that effect the Internet ecosystem, even if the exact numbers are somewhat different.
Therefore, when analyzing trends of the entire AS-level graph, we use DIMES data, which brings a more accurate view of the topology, while the noise gets smoothed due to the large amount of data. When analyzing specific ASes, we use iPlane’s data, since it is more stable. Indeed, in most cases, both infrastructures resulted in the same overall trends, assuring that the observations we make are indeed due to real topology and routing characteristics and are not the results of some measurement bias. Whenever the two datasets do not agree, we present both results and discuss the differences and their causes.
It is important to note that since we are interested in trends, the exact numbers we obtain (for number of connections, clustering coefficient, etc.) are not important. We are interested in the their scale and especially in their evolution over time. Thus, the effect of measurement errors [4], errors in the IP to AS translation [28, 27, 29], and similar inaccuracies, which are discussed in the measurement literature, are not significant for this study since they can not effect trends.
IV Autonomous Systems Connectivity
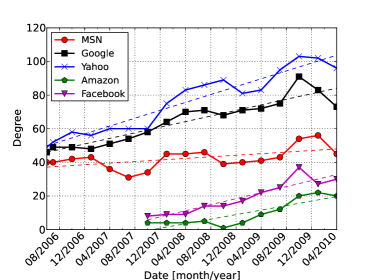
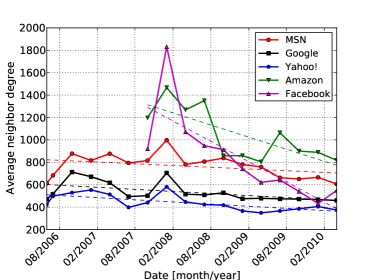
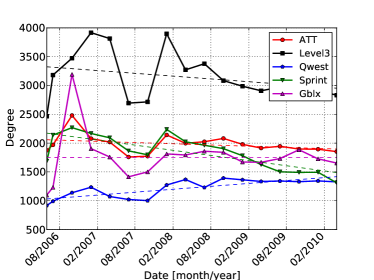
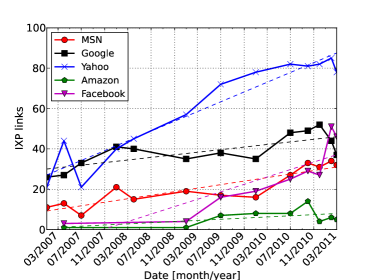
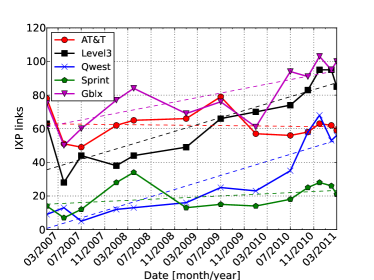
The simplest way to measure the connectivity of an AS is the number of neighboring ASes it is connected to, i.e., its degree in the AS graph. Fig. 1a and Fig. 1c show the expected vast difference between the degree of content providers and transit networks. However, while Fig. 1a shows that content providers are increasing their connectivity over time, the connectivity of transit networks depicted in Fig. 1c exhibits a slow decrease (except Qwest).
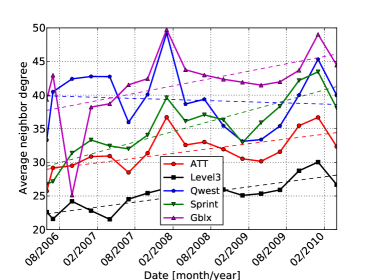
Fig. 1b shows that the average degree of the neighboring ASes of the three ‘veteran’ content providers slowly decreases over time, while the new ones, Amazon and Facebook, start with a high average neighbor degree, which is quickly reduced to match the other three. This indicates that the content providers start by connecting mostly to tier-1 providers, but as they expend they connect to additional providers which are mostly not tier-1 (see additional discussion below). Fig. 1d shows that the average neighbor degree of the transit networks increase. This can be an indication that small customers are disconnecting from the transit networks, or alternatively, that the tier-1 neighbors are becoming better connected, hence increase their degree. Both reasons imply that transit networks are loosing some of their dominance in Internet connectivity.
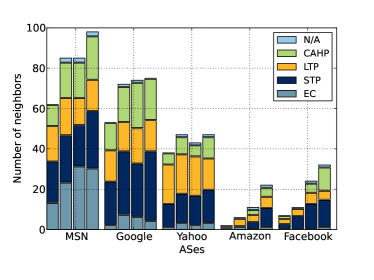
To further understand the reasons behind these trends, we classify the neighbors of each AS. We use the classification provided by Dhamdhere and Dovrolis [10], in which an AS is classified as an enterprize customer (EC), a small or large transit provider (STP and LTP), or a content, access and hosting provider (CAHP). The authors base their classification on the average customer and peer degrees of the AS over its entire lifetime within a 10 year longitudinal study, and claim to reach over 80% accuracy.
Fig. 2a depicts the distribution of the AS types of the neighbors of the content providers as captured during April in four consecutive years: 2007 (left-most bar in each AS) till 2010 (right-most bars). The figure shows that the number of LTP neighbors did not significantly change, however, since the number of neighbors increased over time for all content providers, the overall LTP percentage decreased. The most drastic change is observed for Amazon and Facebook, with a reduction. Amazon and Facebook greatly increased the number of CAHP and STP neighbors.
Similar analysis on transit providers revealed that they mostly interconnect with EC and CAHPs. These neighbors exhibit the largest reduction, indicating a market loss in their core business, probably impacting their dominance in the Internet connectivity.
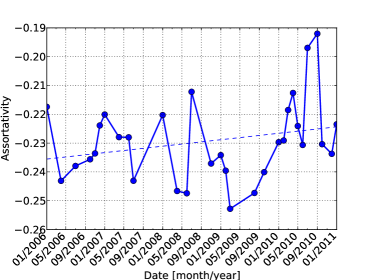
Finally, we measure the assortativity coefficient values [31] of the complete AS graph, using data from DIMES. These coefficients are positive when vertices tend to connect with similar-degree vertices and negative otherwise. The AS-graph was shown to be disassortative [31, 25], meaning comprise mostly of radial links, connecting ASes towards the tier-1 ASes. Looking at the trend of the assortativity coefficient depicted in Fig. 3 shows that the AS-graph becomes less disassortative, indicating that ASes increase their connections with other similar-degree ASes.
Overall, these findings agree with previous findings [17, 21, 11], and show a trend of large content providers that shift from relying mostly on large transit providers towards a flatter topology, interconnecting with smaller networks for gaining transit and direct access to last-mile customers. Content providers that have been around longer, such as Google, Yahoo!, and MSN do not increase the number of LTPs, mainly since they already exploit the benefit of connecting with them. The “younger” content providers follow this trend and mostly use STPs and CAHP. This trend reveals an overall decrease in the dominance of tier-1 networks in the Internet ecosystem. This observation repeats in the following sections, when we study the centrality of these networks.
IV-A Geographical Connectivity
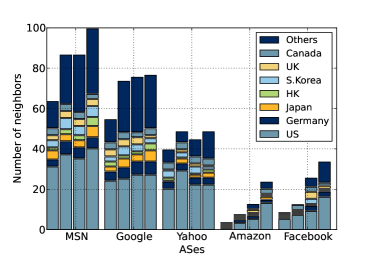
We further measure how the spatial connectivity of the content providers evolves. Each neighboring AS is resolved to its major country, i.e., the country that hosts most of its known IP addresses, using data from MaxMind [1]. This database is considered accurate in the country level of resolution [38, 37].
Fig. 2b depicts, for each AS, the number of neighbors in a set of countries, over a period of four years (the bars of each AS are for 2007, 2008, 2009, and 2010, from left to right). The content providers we analyze originate from the US, hence it is not surprising that the largest percentage of neighbors were found to be in the US. MSN, Google, and Yahoo! sustain a relative constant number of US-neighbors and increase the number of non-US neighbors, whereas Amazon and Facebook, which grew faster, significantly increase the number of US-neighbors. AT&T, Qwest and Sprint have a majority of neighbors in the US, whereas Level3 and Glbx have a lower percentage of US-neighbors.
IV-B Density and Clustering
The connectivity of the ASes in the graph directly affect its density and clustering. Given a graph , the density of the graph is defined as the number of existing links out of the number of potential links, i.e.:
Fig. 4 shows that the density of the AS-graph decreases over time, mainly since new ASes that join the Internet significantly increase the potential of links, however, they connect only to a small portion of the already existing ASes. This is expected since extremely large degrees are observed only in a relatively small number of ASes, and even these connect to a few thousands ASes.
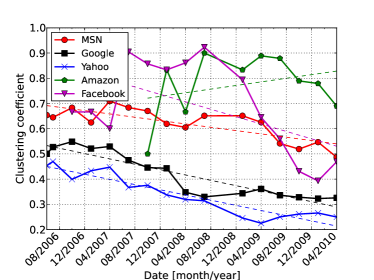
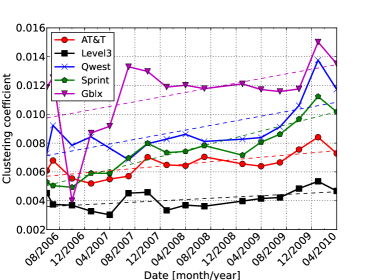
In order to better understand the local connectivity of the ASes, we look at their clustering coefficient (CC), which is a measure of the local density of an AS based on its neighbors. More formally, the CC of a vertex in a graph is the number of triangles it forms with its immediate neighbors out of the potential number of triangles.
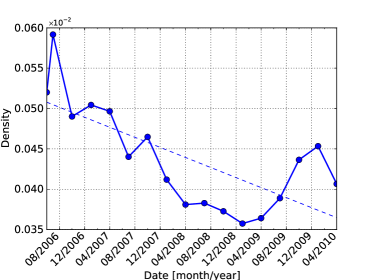
Fig. 5 depicts the CC of content and transit providers. Fig. 5a shows that the CC of content providers is mostly decreasing, which is a result of the increasing number of neighbors having few or no links amongst themselves. On the other hand, transit networks exhibit an increasing CC, meaning that they are loosing neighbors with low connectivity and maybe hints at an increase in neighbor interconnections.
These two observations strongly indicate that content providers are increasing connectivity with access providers that are not in the core and are thus not interconnected. On the other hand, transit networks lose small customers and the remaining customers increase their interconnections that are used to bypass the core [21], which causes the transit networks to gradually lose their centrality.
IV-C IXPs
IXPs are a convenient method for ASes to interconnect, since it provides a shared facility and infrastructure [5]. ASes that seek to expend their connectivity have an incentive to use such facilities as it enables them to connect to a wide range of other ASes. As such, content providers can leverage IXP connectivity to gradually increase the number of peering ASes with minimal setup costs. In this analysis we use DIMES data since it manages to detect more IXP links than iPlane.
Fig. 6 shows the number of IXPs used by content and transit providers. Fig. 6a shows that content providers gradually increased their adoption of IXPs mainly since early 2009. Most of the content providers increased the number of IXPs they connect through by more than 100% in only a few years, emphasizing the important role that IXPs play in the Internet.
Fig. 6b shows that transit providers use more IXPs, but their percentage out of the overall neighbors is extremely low. Additionally, although transit providers increase their usage of IXPs, the number of IXPs they connect through grows much slower than content providers.
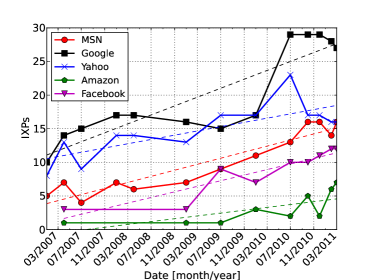
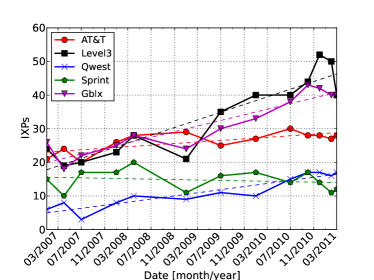
Fig. 7 depicts the number of AS-links that use an IXP, i.e., for each AS, the number of other ASes that it connects through an IXP. Although both transit and content providers exhibit a rising trend, the percentage of IXP links used by content providers is significantly higher, reaching almost 40% of their links, indicating that content providers indeed embrace IXPs as method for increasing connectivity.
Interestingly, the number of IXP links is not significantly higher than the number of IXPs, meaning that each IXP is used for connecting with only a few ASes. Since more ASes are expected to join these shared facilities [5], the growth potential of content networks connectivity is high.
V Autonomous Systems Hierarchy
The hierarchical structure of the Internet has been studied extensively, classifying ASes into the classical three-tiered model [16, 13], and understanding the valley-free packet routing rules [15]. A different method of hierarchical analysis is -pruning [7], which decomposes graphs into shells, based on the node connectivity towards the graph center. In the AS graph, ASes in the first shell are those who have only one link leading to the ‘center’ of the graph, whereas ASes in the th shell have -connectivity towards the center. The nucleus (or core) is the shell with the highest index, which is considered to contain top level providers, mostly tier-1 transit networks [7].
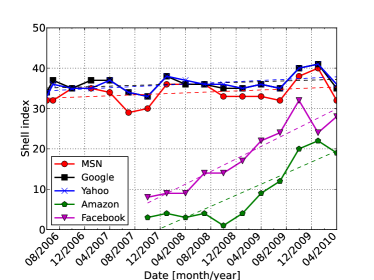
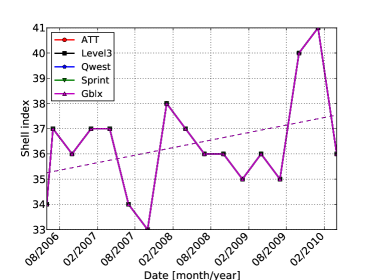
Fig. 8 shows the shell index of content and transit providers. Fig. 8b shows that all of the examined transit networks are in the same shell, which is the nucleus. This is expected, since these ASes are the top-level providers of the Internet, making them extremely central [7, 36].
Fig. 8a shows that Google, Yahoo!, and MSN have a very high shell index, and are either in the nucleus or in a very close shell. Facebook and Amazon exhibit a dramatic increase in their shell index. Facebook enjoyed increasing popularity, which drive it into connecting with high tier networks, improving its connectivity and service levels. Amazon’s increase reveals the market shift that the company had, from being an online store that resides in a low shell into a major cloud service provider, hosting numerous application. This change mandates significantly more connections with tier-1 networks, resulting in the increase witnessed in 2009.
For a content provider, being close to the nucleus has direct capital effect, because the higher the shell a network is located in, the less it needs to be a paying customer of transit networks [15], mainly since it does not need transit services in order to reach most other customer networks. Looking back at the degree of content providers in Fig. 1, their degree is significantly lower than tier-1 transit networks. Since tier-1 networks are expected to comprise the nucleus [7], it is unexpected that content providers manage to reach high shells. However, examining the types of ASes in the nucleus, reveals that unlike previously thought [7], there is a significant portion of STPs (roughly 40%) and even CAHPs (15-25%) in the nucleus. As content providers increase the portion of neighbors that reside in the core, they manage to increase their shell index, thus reduce their dependency on top-tier transit providers. We note that the nucleus index has slightly increased since 2006 (roughly 5% increase in iPlane and 10% in DIMES). An increase in this index indicates a richer interconnection within the Internet core.
VI Measuring Centrality
In this section we seek to understand the ways that the changing connectivity of content providers affects their centrality, and whether these changes actually change the centrality of large transit providers. We approximate the potential load on the ASes, and use a web-based centrality metric for assessing the centrality of the networks.
VI-A Approximation of Load
Approximating the potential load on an AS is an estimate of its importance, since it indicates that an AS serves many other ASes for routing packets [25]. This approximation is commonly achieved using betweenness centrality (BC). In graph theory, BC measures the number of appearances of a vertex in the shortest paths between all other vertices, relative to the total number of shortest paths. Given a vertex , its bc is calculated using:
where is the number of shortest paths from to and is the number of shortest paths from to that pass through .
Usually, BC is normalized by dividing it by the number of possible pairs, to enable comparison between graphs of different sizes. Given the number of vertices in the graph , in undirected graphs the number of pairs is .
BC is commonly applied to the AS-graph for measuring the possible load that an AS sustains. However, since packets traverse the Internet in valley-free paths [15], BC can only serve as an approximation for node centrality. To check the validity of this approximation, we first calculated the BC on the undirected AS graph, ignoring valley-free paths. Then, in order to account to the valley-free rules, we calculated the BC of each AS directly from the probed paths of each month, by dividing the number of traceroutes that traverse an AS (in the middle of the trace) by the total number of traceroutes. This method is more accurate than adding directions to the AS-graph, since inferring commercial relationships between ASes was shown to contain errors, with up to 20% mistakes in peer-to-peer relationships [41, 12]. We found that the measurement inference of centrality gave similar BC values as calculating shortest path on the undirected AS graph, with the measurement inference exhibiting slightly lower BC values and significantly more noise. Since we are interested in trends where the exact values are less significant, we use the common and easier method, which is less accurate but provides a clear view of the trends.
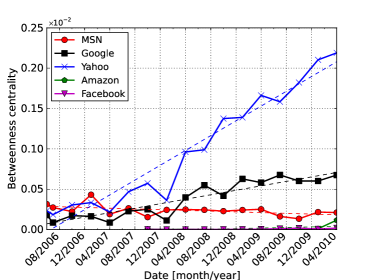
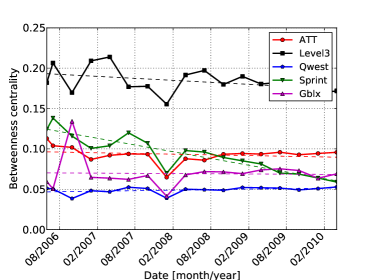
Fig. 9 shows the normalized BC of the selected content and transit networks. As expected, the BC values of the tier-1 transit networks are significantly higher (two orders of magnitude) than content network, as the latter are usually the last hop of the routes.
Interestingly, Fig. 9a shows an increasing trend in the BC of Google and Yahoo!. We validated this increase with the DIMES dataset and observed the same trend, with the difference that Google witnesses a slightly higher increase. We followed the AS-level traces of Yahoo! and Google during weeks 39 and 40 of 2010, and found that Yahoo! AS10310 and Google AS15169 appear mid-trace in roughly 22% and 14% of the traces they appear in, respectively. We further looked at the traces themselves, and found that both networks always appear as the hop-before-last, and are siblings of the last hop (owned by either Google or Yahoo!). In Google’s case, the majority of traces terminate with YouTube (AS36561). Yahoo! on the other hand is comprised of several different ASes, such as Yahoo! Japan (AS23926), Yahoo! US (AS7233), and Yahoo! Backbone (AS24018).
These two networks exhibit a similar behavior: they both provide transit for sibling ASes as well as content, but only for data belonging to their networks. Yahoo!’s major AS does this because their network is comprised of several regional and probably specialized networks. Google provides transit to companies they purchase, leveraging their major AS’s connectivity. In both cases, the end result is the same – content providers, which were once mainly stub networks that terminate routes, are becoming more central by providing transit towards other sibling and peering ASes, enabling network operators to save costs by leveraging their gradually improved connectivity. This observation is also backed from the findings of Labovitz et al. [21], who showed a decreasing traffic trend observed from YouTube AS and an increasing traffic trend from Google’s AS. This is the result of Google’s AS acting as the major transit provider for YouTube’s traffic.
VI-B PageRank Centrality
PageRank (PR), which was proposed initially for scoring web-pages [34], is a measure of the importance of a vertex in a network [30, 22]. PR assigns relative scores to all vertices in the network based on the iterative principle that high-scoring neighbors contribute more to the score of a vertex than low-scoring neighbors. More formally, given a graph , the PR of a vertex is iteratively computed using:
where the initial of all vertices is set uniformly, meaning: . Notice that this is a very simple formulation of PR, and a more complete form was used, however, the exact details are not essential for understanding its meaning.
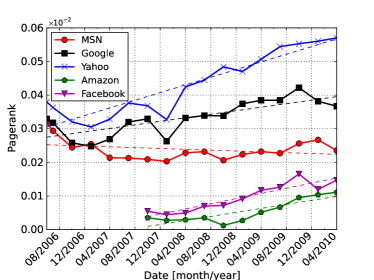
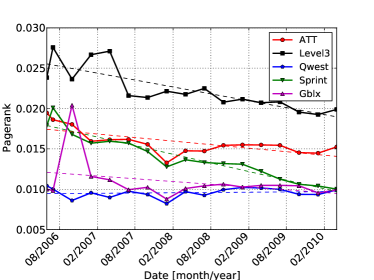
We applied PR on the AS graphs for extracting the centrality of ASes. Fig. 10 shows the PR score of content and transit providers, strengthening the above observations. The PR of transit providers is two orders of magnitude larger than content providers, indicating that they are significantly more central than content providers. However, while the PR of transit networks slowly decreases, content providers witness a gradual increase, with MSN being an exception.
VII Discussion
The AS-level graph exposes the trend that is changing the Internet – content providers become key players in the Internet. The connectivity trends indicate that content providers increase the number of neighbors and diversify their types and geographical spread. They mostly make new connections with small transit and access providers, enabling them a better reach to worldwide customers, while minimizing high-tier transit costs. These changes are also witnessed in the way content providers are gradually climbing towards the core of the Internet, actually reforming it so that it includes non-transit networks.
IXPs are also gaining popularity, and they seem to be underutilized, meaning that the growth potential using peering agreements is high. As they provide an easy method for interconnecting with other networks, they are likely to be better utilized in the future.
The centrality of content providers is a strong indication to their increasing dominance, and on the other hand, the changing role of top-tier transit providers. The latter, despite offering attractive wholesale pricing plans [39], lose their dominance, as content providers, which are amongst the highest paying customers due to the amount of traffic they produce [21], find ways to reduce redundancy on tier-1 networks, while better utilizing their own resources. In addition to saving transit costs, content providers increase their offerings to customers by providing Software as a Service (SaaS), such as hosting, cloud services, collaboration tools and others, without worrying for network neutrality violations or other traffic shaping that can interfere with the service grade they provide [9, 6, 40].
VIII Conclusion
This paper studies the topological trends of large content providers in the AS-level graph. We show that these networks increase their connectivity with other networks, mostly using IXPs. As a result, the centrality of these networks increase, as they manage to reduce their dependency in tier-1 transit networks, which lose dominance in the Internet ecosystem. Through well-designed selection of peers, usage of IXPs, and acting as transit networks for traffic originating from sibling ASes, the large content providers manage to climb the Internet hierarchy, enabling them to improve service to their customers while cutting down transit costs.
References
- [1] Maxmind, geolocation and online fraud prevention, (http://www.maxmind.com/).
- [2] Packet Clearing House, http: //www.pch.net/.
- [3] PeeringDB, http://www.peeringdb.org/.
- [4] B. Augustin, X. Cuvellier, B. Orgogozo, F. Viger, T. Friedman, M. Latapy, C. Magnien, and R. Teixeira. Avoiding traceroute anomalies with paris traceroute. In IMC’06, pages 153–158, 2006.
- [5] B. Augustin, B. Krishnamurthy, and W. Willinger. IXPs: mapped? In IMC ’09, pages 336–349. ACM, 2009.
- [6] R. Beverly, S. Bauer, and A. Berger. The Internet is not a big truck: Toward quantifying network neutrality. In PAM, pages 135–144, 2007.
- [7] S. Carmi, S. Havlin, S. Kirkpatrick, Y. Shavitt, and E. Shir. A model of Internet topology using -shell decomposition. Proceedings of the National Academy of Sciences USA (PNAS), 104(27):11150–11154, July 3 2007.
- [8] B. Chun, D. Culler, T. Roscoe, A. Bavier, L. Peterson, M. Wawrzoniak, and M. Bowman. Planetlab: An overlay testbed for broad-coverage services. ACM SIGCOMM Computer Communications Review, 33(3), July 2003.
- [9] A. Dhamdhere and C. Dovrolis. Can ISPs be profitable without violating “network neutrality”? In Proceedings of the 3rd international workshop on Economics of networked systems, pages 13–18, New York, NY, USA, 2008. ACM.
- [10] A. Dhamdhere and C. Dovrolis. Ten years in the evolution of the Internet ecosystem. In IMC, pages 183–196. ACM, 2008.
- [11] A. Dhamdhere and C. Dovrolis. The Internet is flat: modeling the transition from a transit hierarchy to a peering mesh. In CoNext ’10. ACM, 2010.
- [12] X. Dimitropoulos, D. Krioukov, M. Fomenkov, B. Huffaker, Y. Hyun, kc claffy, and G. Riley. AS relationships: Inference and validation. ACM SIGCOMM Computer Communications Review, 37:2007, 2006.
- [13] X. Dimitropoulos, D. Krioukov, G. Riley, and K. Claffy. Revealing the autonomous system taxonomy: The machine learning approach. In PAM, 2006.
- [14] C. Fraleigh, S. Moon, B. Lyles, C. Cotton, M. Khan, D. Moll, R. Rockell, T. Seely, and C. Diot. Packet-Level Traffic Measurements from the Sprint IP Backbone. IEEE Network, 17(6):6–16, 2003.
- [15] L. Gao. On inferring autonomous system relationships in the Internet. IEEE/ACM Trans. on Networking, 9(6):733–745, 2001.
- [16] Z. Ge, D. Figueiredo, S. Jaiwal, and L. Gao. On the hierarchical structure of the logical internet graph. In SPIE ITCOM, Aug. 2001.
- [17] P. Gill, M. Arlitt, Z. Li, and A. Mahanti. The flattening Internet topology: natural evolution, unsightly barnacles or contrived collapse? In PAM, pages 1–10. Springer-Verlag, 2008.
- [18] Y. He, G. Siganos, M. Faloutsos, and S. Krishnamurthy. Lord of the links: A framework for discovering missing links in the Internet topology. IEEE/ACM Trans. on Networking, 17(2):391–404, Apr. 2009.
- [19] Y. He, G. Siganos, M. Faloutsos, and S. V. Krishnamurthy. A systematic framework for unearthing the missing links: Measurements and impact. In NSDI, 2007.
- [20] X. Kuai, D. Zhenhai, Z. Zhi-Li, and C. Jaideep. On properties of internet exchange points and their impact on AS topology and relationship. In Networking, 2004.
- [21] C. Labovitz, S. Iekel-Johnson, D. McPherson, J. Oberheide, and F. Jahanian. Internet inter-domain traffic. In SIGCOMM, pages 75–86. ACM, 2010.
- [22] J. Liu, Y. Huang, and S. Li. Video search re-ranking via multi-graph propagation. In ACM Multimedia, 2007.
- [23] H. V. Madhyastha, T. Isdal, M. Piatek, C. Dixon, T. E. Anderson, A. Krishnamurthy, and A. Venkataramani. iPlane: An information plane for distributed services. In OSDI, pages 367–380, 2006.
- [24] H. V. Madhyastha, E. Katz-Bassett, T. Anderson, A. Krishnamurthy, and A. Venkataramani. iPlane Nano: path prediction for peer-to-peer applications. In NSDI, pages 137–152, 2009.
- [25] P. Mahadevan, D. Krioukov, M. Fomenkov, X. Dimitropoulos, k c claffy, and A. Vahdat. The Internet AS-level topology: three data sources and one definitive metric. ACM SIGCOMM Computer Communications Review, 36(1):17–26, 2006.
- [26] G. Maier, A. Feldmann, V. Paxson, and M. Allman. On dominant characteristics of residential broadband Internet traffic. In IMC, pages 90–102. ACM, 2009.
- [27] Z. Mao, D. Johnson, J. Rexford, J. Wang, and R. H. Katz. Scalable and accurate identification of AS-level forwarding paths. In INFOCOM, 2004.
- [28] Z. Mao, J. Rexford, J. Wang, and R. H. Katz. Towards an accurate AS-level traceroute tool. In SIGCOMM, 2003.
- [29] Z. M. Mao, L. Qiu, J. Wang, and Y. Zhang. On as-level path inference. In SIGMETRICS’05, pages 339–349, 2005.
- [30] V. Mehta, C. Bartzis, H. Zhu, E. Clarke, and J. Wing. Ranking attack graphs. In Proceedings of Recent Advances in Intrusion Detection, 2006.
- [31] M. E. J. Newman. Assortative mixing in networks. Physical Review Letters, 89(20), Oct. 2002.
- [32] W. Norton. Drpeering.net. http://drpeering.net.
- [33] R. V. Oliveira, D. Pei, W. Willinger, B. Zhang, and L. Zhang. In search of the elusive ground truth: the internet’s AS-level connectivity structure. In ACM SIGMETRICS, 2008.
- [34] L. Page, S. Brin, R. Motwani, and T. Winograd. The PageRank citation ranking: Bringing order to the web. Technical report, Stanford Digital Library Technologies Project, 1998.
- [35] Y. Shavitt and E. Shir. DIMES: Let the Internet measure itself. ACM SIGCOMM Computer Communications Review, 35(5), 2005.
- [36] Y. Shavitt and U. Weinsberg. Quantifying the importance of vantage points distribution in internet topology measurements. In IEEE Journal on Selected Areas in Communications, Oct. 2011.
- [37] Y. Shavitt and N. Zilberman. A geolocation databases study. IEEE Journal on Selected Areas in Communications. to appear.
- [38] S. S. Siwpersad, B. Gueye, and S. Uhlig. Assessing the geographic resolution of exhaustive tabulation for geolocating Internet hosts. In PAM. Springer-Verlag, 2008.
- [39] V. Valancius, C. Lumezanu, N. Feamster, R. Johari, and V. Vazirani. How many tiers? pricing in the Internet transit market. In SIGCOMM, 2011.
- [40] U. Weinsberg, A. Soule, and L. Massoulié. Inferring traffic shaping and policy parameters using end host measurements. In Infocom (min-conference). IEEE, 2011.
- [41] J. Xia and L. Gao. On the evaluation of AS relationship inferences. In IEEE Globecom, Dallas, TX, USA, 2004.