Highlights from Heavy Ion Collisions at RHIC and the Acoustics of the Little Bangs
Abstract
At the Relativistic Heavy Ion Collider (RHIC) at Brookhaven National Laboratory, heavy nuclei are collided at high energies to create matter that is hot enough and dense enough to dissolve hadrons into a quark-gluon-plasma (QGP). In this lecture, dedicated to the memory of Aditya Sambamurti, I present an introduction to heavy-ion collisions and highlights from the first decade of RHIC results.
1 Introduction
The motivation for the construction of the Relativistic Heavy Ion Collider at Brookhaven National Laboratory was to collide heavy nuclei so that a theoretically conjectured state of matter called the Quark Gluon Plasma (QGP) [1, 2] could be formed. These collisions deposit relatively large amounts of energy into a region the size of a nucleus. The matter left behind in that region is so hot and dense that hadronic matter undergoes a phase transition into a form of matter where quarks and gluons are the relevant degrees of freedom, not hadrons [3]. This is the state of matter that existed when the universe was young (less than a microsecond old) and very hot.
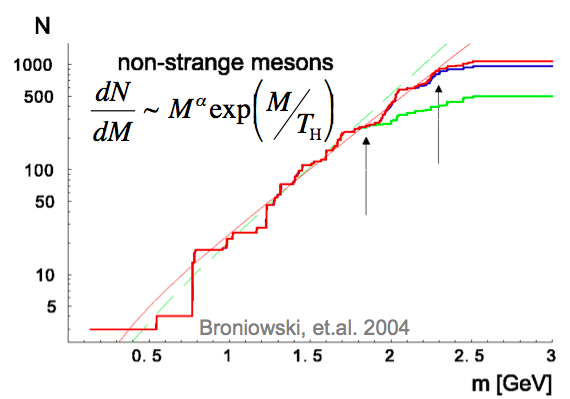
The first clues to the existence of a transition from hadronic matter to a different state of matter predate the discovery of quarks and the advent of Quantum Chromodynamics. Even before the quark model was proposed, Hagedorn noticed that the spectrum of hadronic states (shown in figure 1) grows exponentially with mass; that is, the number of hadronic states within a given mass window, increases exponentially with the mass. Hagedorn realized that this feature of the hadronic mass spectrum implies that there is a maximum temperature in a hadronic gas [4]. As we put more energy into the hadron gas, the energy can go into creating ever more higher mass states instead of increasing the temperature. Based on this observation, one could wonder, what existed in the universe when it was hotter than the limiting hadronic temperature? The answer to that question is provided by the theory of Quantum Chromodynamics.
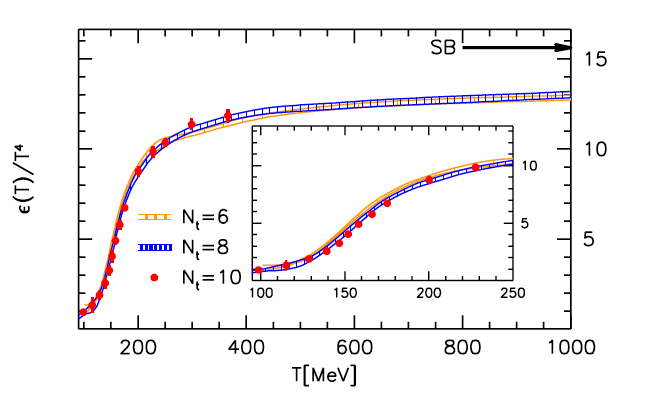
With the discovery that hadrons are made of quarks and gluons and the development of QCD, the theory that describes the interaction of quarks and gluons, it becomes clear what happens above Hagedorn’s limiting temperature for hadronic matter. That matter undergoes a phase transition into a plasma of color charged quarks and gluons called the quark gluon plasma (QGP) [6]. The theory of QCD has been tested and verified in the high energy, short wavelength, perturbative limit but the QGP is dominated by non-perturbative interactions. In this case, we rely on computationally intense Lattice QCD calculations to study the transition from hadronic matter to QGP [3]. Figure 2 shows a Lattice QCD calculation of energy density scaled by the fourth power of temperature versus the temperature. This quantity is proportional to the number of degrees of freedom. As expected, as the temperature is increased, the number of degrees of freedom begins to rapidly increase. This is the effect expected from the rise in the number of more massive hadronic states that become accessible at higher energies. Then, as the energy continues to grow, the number of degrees of freedom levels off and nearly saturates. That saturation is a clear demonstration of a transition into a QGP where the number of degrees of freedom is determined by the number of quarks and gluons, not by the ever increasing number of hadronic states. These calculations demonstrate that QGP is a state of matter predicted by QCD. The task undertaken by RHIC and other heavy ion experimental facilities [7] is to recreate that state and study its properties.
2 RHIC Collisions
The creation of a QGP at RHIC is typically initiated by colliding together Gold nuclei at GeV, the maximum center of mass energy acheivable at RHIC for those species. The RHIC facility is flexible however and can collide a range of nuclei from single protons up to even heavier elements like Uranium 238 and with energy ranges from approximately 5 GeV to 200 GeV (or higher for lighter nuclei up to 500 GeV for protons). With this broad flexibility and a suite of detector systems (the PHOBOS, BRAHMS, STAR and PHENIX detectors 111the smaller experiments PHOBOS and BRAHMS were decomissioned in 2005), RHIC is the ideal facility to study the transition from hadronic matter to QGP.
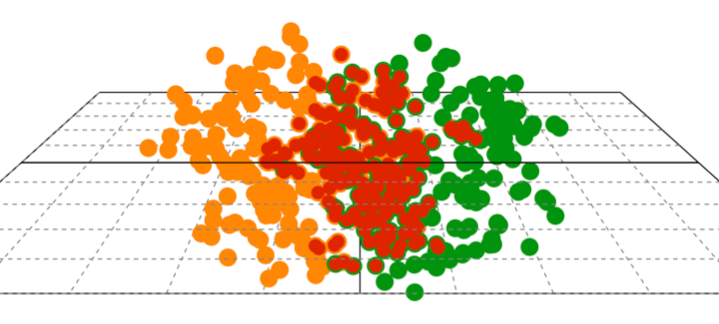
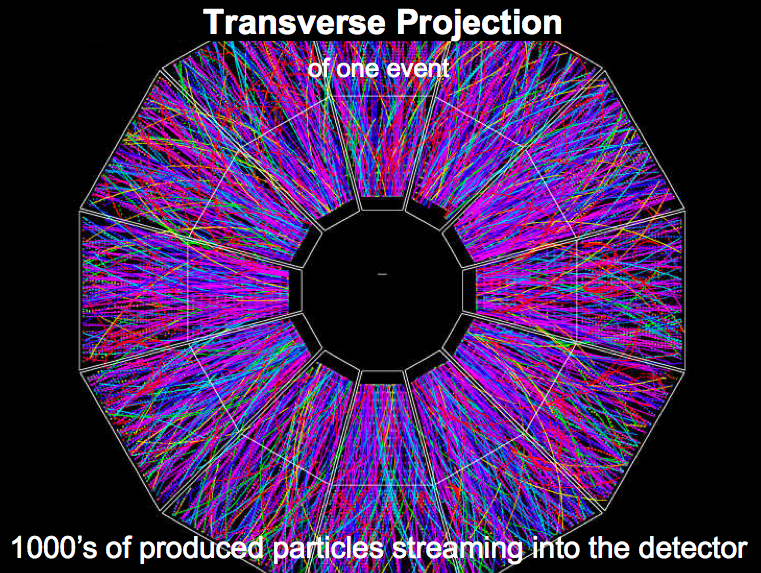
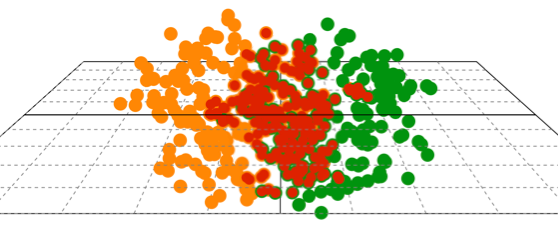
Figure 3 (left) shows a Monte-Carlo Model of the collision of two highly Lorentz contracted Gold nuclei [8]. For collisions at 200 GeV, the Gold nuclei are contracted along their direction of motion by a factor of 100. The illustration shows the protons and neutrons distributed within each nucleus — those that are expected to participate in the collision are shown in red. On the right, is an image from the STAR detector [9] showing the tracks left behind by thousands of charged particles produced in a 200 GeV Au+Au collision. From these tracks, we attempt to infer the properties of the tiny speck of matter that briefly existed after the collision. The size of the matter is approximately the size of a Au nucleus (10-14 meters or 10 fm), and it exists for fm/ ( seconds) before the interactions between the fireball’s constituents cease and hadrons freely stream to the detectors. Since it is impossible to directly observe the matter that is formed, we look at the abundances, and distributions of various particles species, and the patterns with which they are emitted to infer the properties of the matter.
3 RHIC Highlights
3.1 Particle Ratios and Chemical Freeze-out
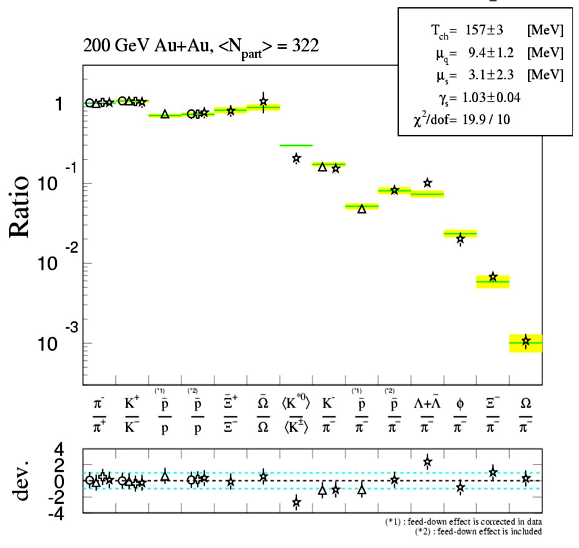
One of the firsts questions asked is whether regions of the fireball were locally able to achieve equilibrium before the system blasted apart. We specify local because causality dictates that the system cannot be completely equilibrated until it has lived for , where is the speed of sound in the medium and is the size of the system. Evidence for local thermal equilibration can be found by investigating the ratios of various particle species. A thermal model can be constructed to predict these relative abundances based on simple thermodynamic arguments [11]. For a thermally equilibrated system, the relative abundances of particles should only depend on the temperature of the system, the chemical potentials of the quarks and the masses of the particles. Figure 4 shows a fit of such a model to the particle ratios measured at RHIC. The fit demonstrates that particle production from 200 GeV Au+Au collisions is consistent with that expected from an equilibrated medium, thus satisfying a basic requirement for the formation of a state of matter.
3.2 Anisotropy: from Coordinate to Momentum Space
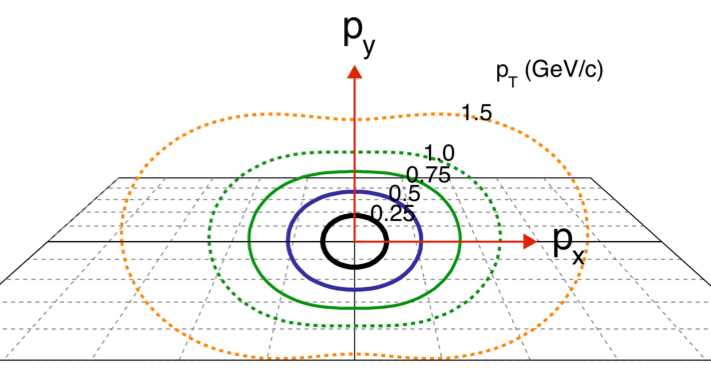
If interactions in the fireball are strong enough to create a locally thermalized medium, then we may expect the interactions to influence the patterns with which particles are emitted. Typically, the region where the two nuclei overlap is not isotropic; for non-central collisions, it possesses an elliptic shape. If particles free stream from that region, the elliptic shape will not be transferred into momentum space, and the particles will be emitted isotropically. Interactions, on the other hand, will lead to anisotropies in the momentum space distributions of particles. In particular, if we consider the pressure gradients in the system, we see that the largest pressure gradient will be along the short axis of the elliptic overlap region (see figure 5). That is the axis where the density goes most abruptly from the maximum at the center to the minimum at the edge. If pressure gradients are acting on the emitted particles, that anisotropy in the pressure gradient will lead to an elliptic anisotropy in the momentum space distribution of emitted particles (as shown in the right panel of figure 5) [12]. That elliptic anisotropy is quantified by , the second term in a Fourier Series expansion of the angular dependence of particle emission in the transverse plane, where the azimuthal angles are taken relative to the axis connecting the two colliding nuclei. The right panel of figure 5 illustrates how anisotropic the distributions are for particles emitted with different transverse momenta. In semi-central Au+Au collisions at 200 GeV, there are nearly twice as many 1.5 GeV particles emitted in the direction of the short axis of the overlap region as there are in the direction of the long axis: note this ratio will go as so that corresponds to . This is a remarkably large deviation from expectations of free-streaming that indicates the fireball maintains a memory it’s original geometry.
3.3 Elliptic Flow and Quark Number Scaling
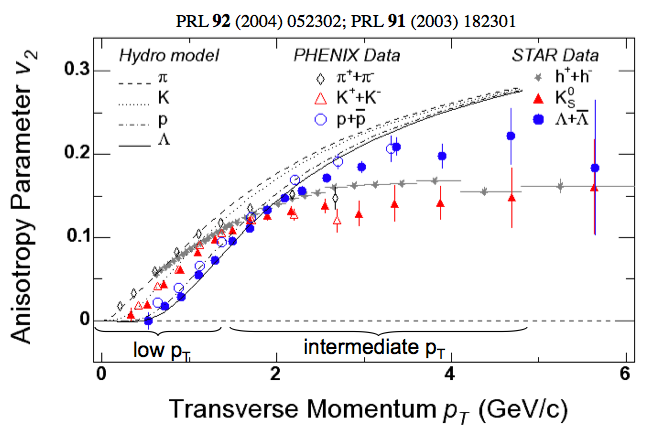
Measurements of for different particle species at different transverse momenta are shown in figure 6 [12]. In the region below GeV/, follows mass ordering with heavier particles having smaller at a given . Above this range, the mass ordering is broken and the heavier baryons take on larger values. A hydrodynamic model for is also shown which describes the in the lower region well [13]. The hydrodynamic model assumes local thermal equilibrium and zero mean-free-path for interactions. The mass ordering in the model and data are a feature expected for particle emission from a boosted source. In the case that particles move with a collective velocity, more massive particles will receive a larger kick. As the particles are shifted to higher , the lower momentum regions become depopulated with a larger reduction in the direction with the largest boost (in-plane). This reduction reduces at a given , with the reduction largest for more massive particles, as observed in the data. This is clear evidence for a fireball expanding under the influence of anisotropic pressure gradients. The successful description of the data in the momentum range where 99% of the particles are produced with a ideal hydrodynamic models led physicists at RHIC to dub the matter a perfect liquid [14]. In fact preliminary estimates of the viscosity of the QGP created at RHIC indicate that it is lower than any known substance and consistent with the lowest value possible [15].
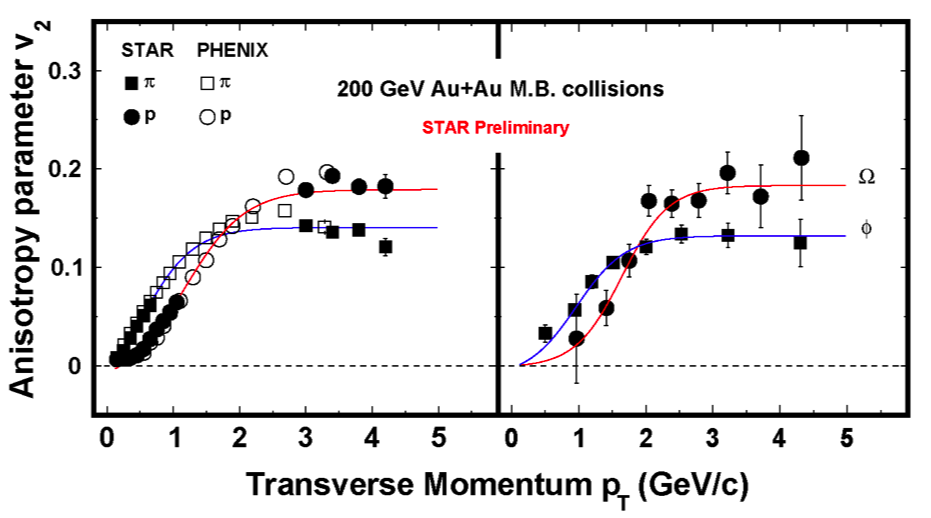
At higher , no longer rises with and the mass ordering is broken. Above near 2 GeV/ the more massive baryons exhibit a larger than the mesons. While the pion and kaon reach a similar maximum of at near 2.5 GeV/, the baryon continues to rise until it reaches a maximum of at near 4.0 GeV/. For still larger , the values exhibit a gradual decline until for all particles is consistent with at near 7 GeV/ (not shown in this figure). At these higher values one expects that the dominant process giving rise to is jet-quenching [16] where hadron suppression is larger along the long axis of the overlap region than along the short axis [17, 18, 19]. Jet quenching occurs as fast moving partons radiate energy in the expanding medium. This leads to a dramatic suppression of high momentum particles which will be discussed later. For very large energy loss, the value of should be dominated by the geometry of the collision region.
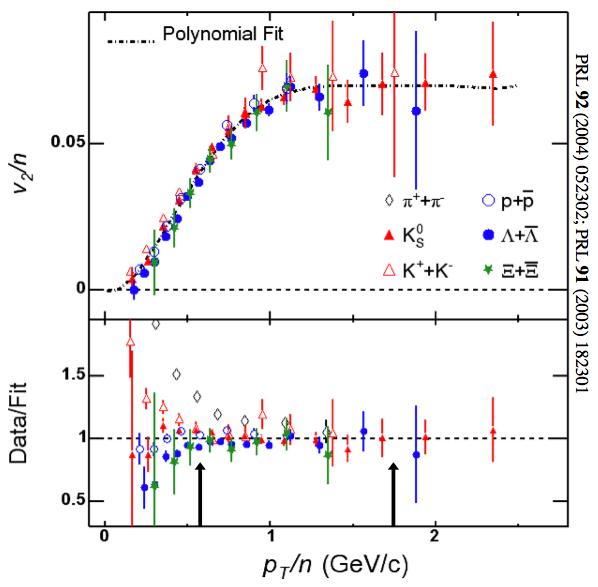
At an intermediate range, it was noted that mesons and baryons spread out into two bands with the generally heavier baryons developing a larger , contrary to the behavior in the lower momentum region. It was also noticed that if the and of the hadron were scaled by the number of constituent quarks in the hadron, the vs of various species all lined up with one another [20]. This scaling is shown in the right panel of figure 6. Figure 7 shows that this grouping of mesons and baryons extends to the heavier, multiply strange hadrons, the -meson and -baryon. The data in figure 7 is important because it shows that although the -meson is as heavy as the proton, it behaves like other mesons. Indeed, the number of constituent quarks seems to be more relevant than the mass of the hadron.
3.4 The Baryon Enhancement
The observation of the quark-number dependence of at intermediate and the constituent quark number scaling led to speculation that hadron formation was happening via the coalescence of dressed quarks at the hadronization phase boundary, leading to an amplification of with baryons getting amplified by a factor of 3 while mesons were amplified by a factor of two [20, 21, 22, 23, 20, 24, 25, 26, 27, 28, 29, 30]. This picture was subsequently strengthened by the observation that a similar quark-number dependence arises in [31, 32]: the ratio of the single particle spectra in central collisions to that in peripheral collisions. At intermediate the values for various particle species are also grouped by the number of constituent quarks, with baryons having a larger . The larger for baryons signifies that baryon production increases with collision centrality faster than meson production; an observation consistent with the speculation that hadrons from Au+Au collisions are formed by coalescence such that baryon production becomes easier as the density of the system increases. The more general and less model dependent statement is that the baryon versus meson dependence arises from high density and therefore most likely from multi-quark or gluon effects or sometimes called ”higher twist” effects.
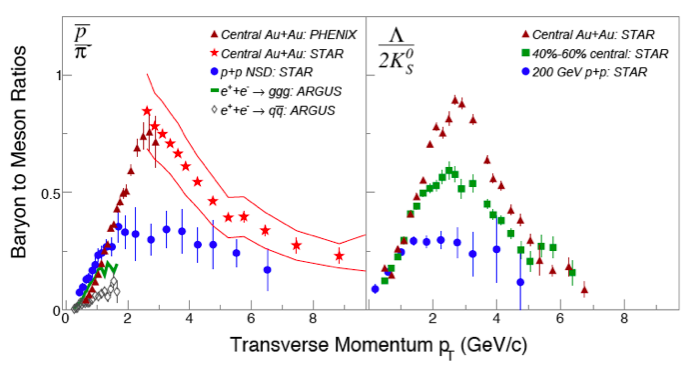
The combination of large baryon and large baryon also immediately eliminates a class of explanations attempting to describe one or the other observation: e.g. originally it was speculated that the larger for baryons might be related to a smaller jet-quenching for jets that fragment to baryons than for jets that fragment to mesons. This explanation would lead to a smaller baryon and is therefore ruled out by the larger for baryons. The same can be said for color transparency models [34] which would account for the larger baryon in this region but would predict a smaller baryon . Color transparency may still be relevant to the particle type dependencies at where for protons is slightly larger than for pions [35] and the measurements are not yet precise enough to conclude whether the baryon is also smaller than the meson . This is a topic that needs to be studied further. Figure 8 shows baryon to meson ratios for p+p collisions, mid-central Au+Au collisions, and central Au+Au collisions. At intermediate values, the number of baryons produced is similar to the number of mesons. measurements also demonstrate that baryons are more abundantly produce along the short axis of the overlap region rather than perpendicular to it. The two observations are directly related to each other.
3.5 Correlations and Fluctuations
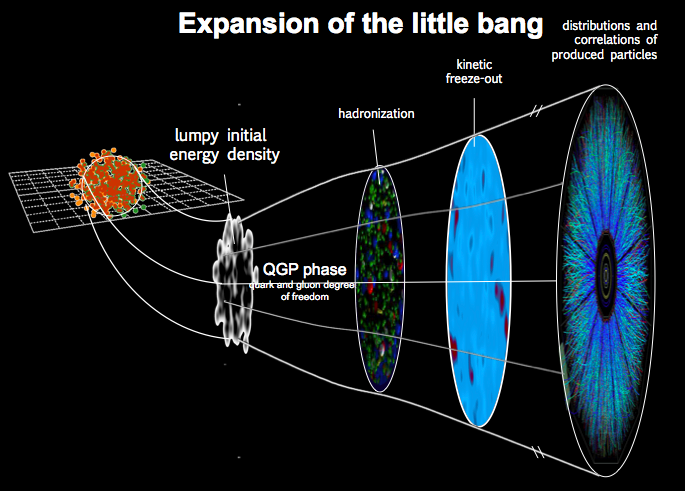
The data presented above along with many other observations have led to a picture of heavy-ion collisions summarized in the diagram in figure 9. Energy is deposited in the overlap region of the two colliding nuclei. That matter reaches local thermal equilibrium in a surprisingly short time (about 1 fm/c) and the quark-gluon-plasma phase of the expansion begins. The QGP expands in the longitudinal and transverse directions developing a hubble-type expansion with transverse velocity . The system quickly cools with cooler regions passing through the phase transition to hadronic matter. Eventually, all of the QGP has converted to hadronic matter. Later still, inelastic interactions cease and the particle ratios are fixed. This is called chemical freeze-out. Finally the elastic interactions cease and the momentum of the particles cease to change. This is called kinetic freeze-out. After this, the particles stream freely to the detector.
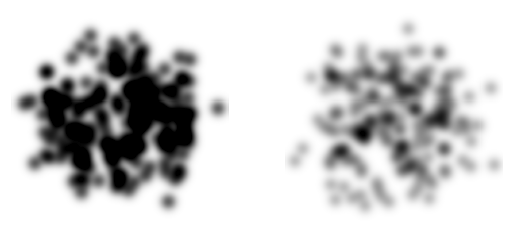
It is apparent from the measurements that during the evolution sketched in figure 9, the fireball converts features of the initial overlap geometry into momentum space. The initial overlap region, however, is neither a perfect sphere nor a perfect ellipse. It is expected to contain regions of high and low energy density. As an example, figure 10 shows the gluon density in the transverse plane probed by a 0.2 fm quark-antiquark dipole for two different values in the IPsat Mean-Field theoretical model of QCD [33] ( is in the left panel and in the right panel). A lumpiness is immediately apparent because the gluons are confined in the transverse plane to regions near the valence charges in the nucleons within the nucleus. Although this picture leads to longitudinally extended flux-tubes due to the overlap of the wave-functions in the longitudinal direction, in the transverse direction, there is a great deal of inhomogeneity. One can ask if the fireball transfers those features into the final momentum space distributions. If so, then they should show up as correlations between produced particles that are extended in the longitudinal direction but narrow in the azimuthal direction.
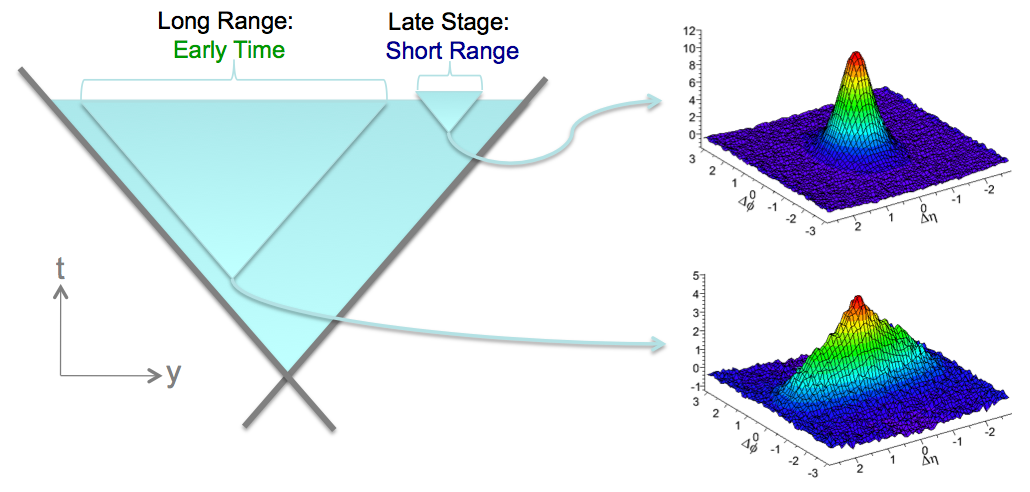
There are many conjectured processes that can lead to correlations between the produced particles; resonance decays, fragmentation of jets, bubble nucleation or spinodal decomposition at a phase boundary [37, 38, 39], and quantum interference are some of the sources of correlations frequently considered. Of all these correlations, only correlations from the very early stages of the evolution can spread out very far in the longitudinal direction. The reason for this is illustrated in figure 11. The left of the figure shows the space time picture of a heavy ion collision. The trajectories of the incoming nuclei and the outgoing nucleons moving near the speed of light are shown as thick grey lines. The horizontal axis shows the longitudinal rapidity y and the vertical axis shows time. Causality dictates that correlations at later times, cannot spread out far in rapidity [36]. Only correlations from early in the evolution can stretch far in rapidity. One way to look for correlations left over form the lumpiness in the initial overlap region, is to look for correlations that are extended in the longitudinal direction.
The left panel of figure 12 shows measurements of two particle correlations where one particle is required to have transverse momentum above 4 and the other above 2 GeV/ [40]. These selections are usually made to search for correlations arising from jets but they exhibit decidedly non-jet-like structures. A jet will lead to correlations that are narrow in the azimuthal and longitudinal direction. Such a correlation is apparent in the peak at and near zero where is the longitudinal pseudo-rapidity variable. In addition though, one notices a correlation which extends in across the entire acceptance of the detector. This ridge-like correlation structure has the characteristics one would expect from lumpiness in the initial overlap zone.
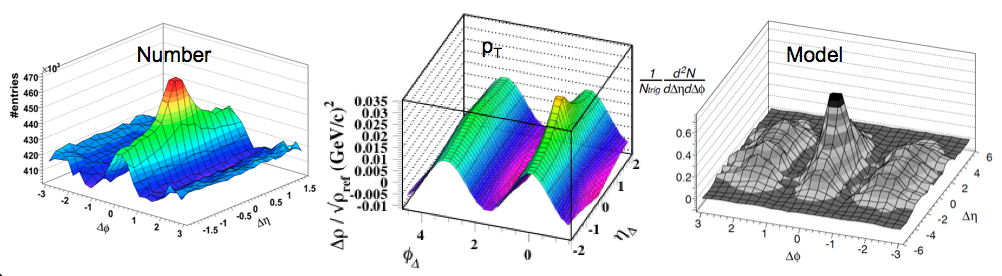
The middle panel of figure 12 shows two particle correlations between all observed hadrons (with no selection) [41]. This data shows the correlations expected from (a modulation) with an additional peak centered at and which is also broadened longitudinally. The model calculations shown in the right panel are from a hydrodynamic model with a lumpy initial overlap density as the initial conditions [42]. The granular nature of the initial conditions clearly show up after the hydrodynamic expansion as correlations similar to those seen in the data. This comparison therefore seems to support the picture of heavy-ion collisions described above, where a hubble-like expansion converts the lumpiness in the initial energy density into correlations that are observed in momentum space.
3.5.1 From to : the Power Spectrum of Heavy Ion Collisions
For several decades,emphasis has been placed on measurements of the second harmonic of the particle distributions in the azimuthal direction . This is natural since the dominant shape of the overlap region in non-central collisions is an ellipse. But understanding the finer detail in the overlap region has become increasingly important: both as a way to resolve previous uncertainties and as a way to learn something new about the collisions. By now it is clear that rather than only studying we should be studying the spectrum vs , particularly in very central collisions where the elliptic shape of the overlap area subsides so that the second harmonic doesn’t overwhelm the others [43]. This spectrum is analogous to the power spectrum that is extracted from temperature-temperature correlations measured in the cosmic microwave background radiation (CMB). This analogy was first pointed out in 2007 in a paper by Mishra et. al. where the authors proposed the analysis of for all values of as an analogous measurement to the Power Spectrum extracted from the CMB [44]. They argued that density inhomogeneities in the initial state would lead to non-zero values for higher harmonics including odd terms like that previously had been assumed to be zero by symmetry. It was subsequently pointed out that information on was to a large extent already contained within existing two-particle correlations data [45], and that and fluctuations would provide a natural explanation for the novel features seen in those correlations, such as the ridge like [49, 40] structure as well as double hump structure on the away side that had been attributed to a mach-cone [50].
That the ridge could be related to flux-tube like structures in the initial state was already argued by Voloshin in 2006 [51]. This was bolstered by hydrodynamic calculations carried out within the NEXSPHERIO model shown in figure 12 (right) which showed that fluctuations in the initial conditions lead to a near-side ridge correlation and a mach-cone like structure on the away-side [42]. In 2010, Alver and Roland used a generalization of participant eccentricity () to arbitrary values of (as had been done previously in Ref. [46]) to show that within the AMPT model, the final momentum space anisotropy for is proportional to the initial [47]. This explained the previous observation that the AMPT model produced correlations similar to those seen in the data (albeit with smaller amplitudes) [48]. This history of studies motivates the analysis of two-particle correlations in terms of harmonics.
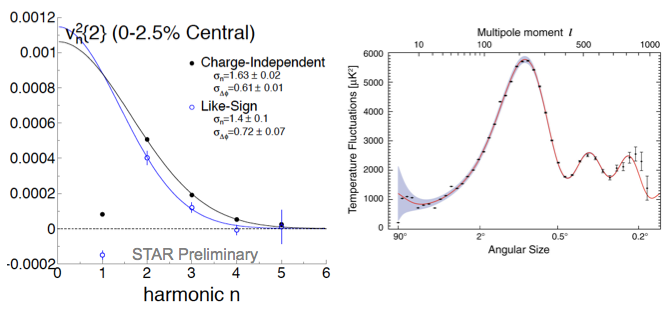
The left panel of figure 13 shows versus for 0-2.5% central collisions. The results are taken from the Q-cumulant analysis which integrates over either all pairs of particles within and GeV/ independent of charge or for only like-sign pairs. The two spectra show similar behavior with the components suppressed and the remainder of the spectra falling off quickly. Excluding , The drop with is well described by a Gaussian. The Gaussian width for vs. from all pairs independent of charge is as expected from the observed width of the near-side peak in the two-particle correlations [49]. If is sensitive to the initial eccentricity, should be suppressed because (due to the constraint that the eccentricity is defined relative to the center-of-mass of the participating nucleons [52]). Higher harmonics are expected to be washed out by viscous and other effects that smear out fine structure [53]. The shape of is therefore a sensitive probe of viscous effects in heavy ion collisions.
The spectrum from heavy-ion collisions can be compared and contrasted with the Power Spectrum from the CMB. One obvious difference is that viscous effects are not important in the early universe, owing to the large size of the universe compared to the viscous length scales, while in heavy-ion collisions, length scales like the mean-free-path are commensurate with the size of the system. As such, the Power Spectrum from the CMB extends to much higher harmonics whereas the spectrum in heavy ion collisions drops off very quickly with harmonic . The CMB power spectrum also exhibits a local maximum near Multi-pole moment followed by several oscillations. These features arise because fluctuations at length scales larger than the acoustic horizon are suppressed in the CMB. No such feature is seen in the spectrum for the kinematic selections shown here. Although Mishra et. al. proposed the measurement of vs. in order to observe the effect of super-horizon fluctuations, it was subsequently realized that higher harmonics of could be washed out by viscous effects and that the shape of vs. is more related to these effects [53].
An acoustic horizon suppresses lower harmonics while viscous-type effects suppress higher harmonics. Viscous effects appear to dominate the shape of the spectrum for low momentum particles but the effect of the horizon may have already been observed at higher where shows a local maximum at . This result may be explained by a hubble expansion and the suppression of lower harmonics which are super horizon. If the expansion velocity increases linearly with the radius as with a hubble expansion, higher particles tend to be emitted from the edge of the system. Hydrodynamic calculations show that this type of radial expansion should be established in a time of about 5 fm/ [54]. The edge of the collision region is also where horizon effects should be most prominent. The harmonic number below which the acoustic horizon will suppress the power spectrum (corresponding to one fourth of a wavelength fitting inside the horizon) goes as where is the radius at which the particles were emitted and is the horizon. If the average of the emission radius for all particles is 8 fm (consistent with blast-wave model fits to data [55]), and the acoustic horizon grows to approximately 7 fm (as estimated from lattice data and hydro [53]), then the peak in the spectrum should be near . A peak in the spectrum at will not be observable because is dominated by momentum conservation so that must be zero when averaged over all particles. We therefore cannot observe a suppression below due to the horizon since is already suppressed and we can only evaluate the spectrum in discrete steps.
If the fireball develops a hubble expansion, the edge of the system will be boosted with a larger velocity and tend to emit particles with higher . When we select high particles, their emission radius will therefore tend to be larger. In a blast wave model the average emission radius of particles near GeV/ is closer to 12 fm. For this subset of particles, the peak in the spectrum should be near . This is consistent with the observation of a local maximum in the spectrum near . This back-of-the-envelope calculation should be verified in a full simulation of heavy ion collisions. I’ve also neglected the possibility of a smaller acoustic horizon on the edge of the system than in the center but the argument at least appears plausible. Given that no other explanation of the local maximum at exists, if confirmed in a more rigorous calculation, this will provide powerful evidence for the existence of a hubble-like expansion in the evolution, thus adding yet another convincing piece of evidence in favor of the picture of heavy ion collisions described above.

Since there are several possible sources for the observed correlations, before interpreting the spectrum, one would like to be absolutely sure that the correlations are indeed dominated by the initial density inhomogeneities. Towards this goal, we can compare specific characteristics of the observed correlation functions to expectations for correlations from the initial density inhomogeneities. Data shows that the amplitude of the near-side ridge correlation rises rapidly with collision centrality [49] before reaching a maximum and falling off in the most central collisions. This rise and fall has been observed at center of mass energies of 62.4 GeV, 200 GeV, and 2.76 TeV [56]. The drop is often ignored but it shouldn’t be; it provides a clear indication that the correlations arise from the initial state lumpiness. Reference [52] provides the explanation for the rise and fall of the ridge amplitude by relating it to density inhomogeneities in the initial overlap region.
By generalizing the eccentricity to any arbitrary value of [46, 47], one can characterize the initial density distributions via the eccentricity of the participants in the collision. The participant eccentricity represents a harmonic decomposition of the azimuthal dependence of the initial overlap density. Smearing out the positions of the participants over some region () washes out higher harmonics such that the shape of vs is well described by a Gaussian centered at (except that will be zero since the eccentricity is naturally calculated in the center-of-mass frame). If then two-particle correlations due to eccentricity fluctuations should have the form shown in figure 14 (left): the two-particle correlations vs are just related to by a Fourier transform. Based on this realization, one can make a rough estimate of the centrality dependence of the near-side ridge due to the eccentricity fluctuations caused by the lumpiness of the initial density. The right panel of figure 14 shows that estimate compared to data. Although the agreement between model and data is not perfect, the model correctly describes the rise and fall of the ridge amplitude. The fact that the model provides an explanation for the rise and fall, suggests that the correlation data is dominated by eccentricity fluctuations. It is therefore worth delving into what causes the rise and fall in the eccentricity based model.
In the eccentricity based model, the rise and fall of the ridge is driven by fluctuations as illustrated in figure 15 (left). A nucleon near the edge of one nucleus impinges on many nucleons from the other nucleus. This induces participant eccentricity fluctuations for many harmonics leading to a near-side Gaussian peak in two-particle correlations. For very central collisions, a nucleon fluctuating beyond the edge of a nucleus will not likely encounter a nucleon from the other nucleus. In that case, this particular source of fluctuations will subside. The subsidence of that source of fluctuations is seen in the two-particle correlations as the drop-off of the ridge amplitude in the most central collisions.
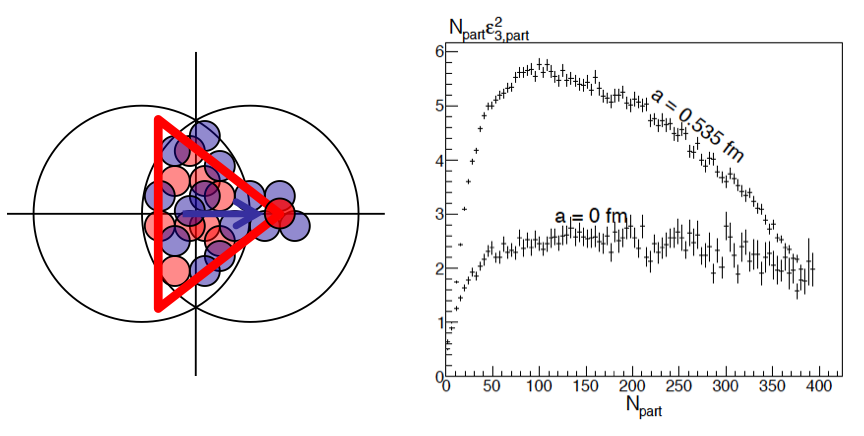
This detailed explanation for the rise and fall of the ridge demonstrates that the ridge in the two-particle correlations data is indeed caused by fluctuations in the initial density of the collisions. In the right panel of figure 15, Monte Carlo Glauber calculations of the mean of the square of the third harmonic participant eccentricity scaled by the number of participants are shown as a function of for Au+Au collisions. Two cases are given: In one case, the surface of the Au nucleus is treated as a hard cut-off so that nucleons do not fluctuate beyond the nominal radius of the Au nucleus (Woods-Saxon diffuseness parameter fm) and in the other case, the edge of the Au nucleus is treated as diffuse so that nucleons can fluctuate beyond the nominal Au radius (Woods-Saxon diffuseness parameter fm taken from electron scattering data [57]). The fm calculation artificially suppresses the fluctuations responsible for the rise and fall of the ridge. This case would lead to a ridge that increases linearly with centrality. The physically meaningful calculation with fm leads to a ridge that first rises abruptly and then falls in the most central collisions. The prediction for the amplitude of the ridge shown in figure 14 is based on the centrality dependence of the ridge amplitude following where is the particle density. This estimate correctly predicted the centrality dependence of the ridge in Pb+Pb collisions at 2.76 TeV prior to those measurements being made. There seems to be little doubt that the observed two-particle correlations are dominated by lumpiness in the initial density distributions.
Besides the dominant correlations that have been demonstrated to arise from the lumpiness of the initial density distributions, correlations and fluctuations can also develop at the phase boundary between QGP and hadronic matter. If the phase transition is second or first order we would expect the correlations to be larger for larger systems. These correlations and fluctuations are related to the susceptibilities in the system. Lattice QCD calculations show that the magnitude of the peak in the susceptibilities at the phase boundary does not change when the size of the lattice changes. This indicates that the phase transition in QCD at zero baryon density is a smooth cross-over [58]. In data, as discussed in the previous paragraphs, the measured correlations and fluctuations seem to be dominated by the initial conditions rather than by correlations and fluctuations from the phase boundary. The right panel of figure 16 shows fluctuations for several different energies vs an estimate of the number of nucleons participating in the collision [59]. Above about 100 participants, the fluctuations are independent of the system size. This is consistent with the smooth crossover from QGP to hadron gas as expected from Lattice QCD calculations.
3.6 The RHIC Beam Energy Scan
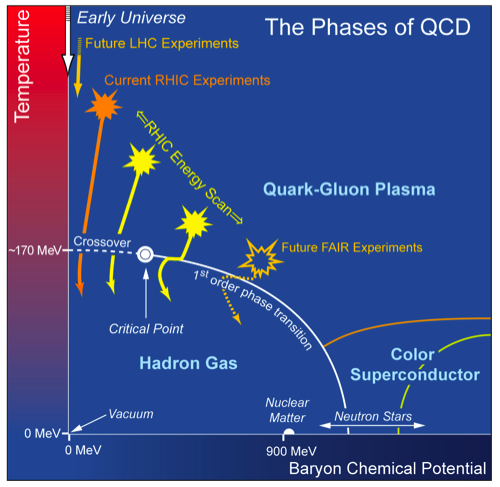
Although Lattice calculations show that the QGP to hadron phase transition is a smooth crossover at zero baryon density, it is thought to be a first-order phase transition at higher baryon densities [60]. Lattice calculations suffer from the sign problem at non-zero baryon chemical potential so it is not easy to infer from QCD where the transition from a smooth crossover to a first order phase transition occurs. The point where the smooth crossover and first order phase transition meet is called a critical point and represents an important landmark on the phase diagram of nuclear matter. Figure 17 shows a schematic diagram of the phases of QCD. Full energy heavy-ion collisions at RHIC and those that at the LHC, are nearly net baryon free and probe along the left axis of the diagram. The flexibility of RHIC makes it possible to probe deeply into the non-zero baryon chemical potential axis. By lowering the energy of the colliding beams, one initiates a system with larger net baryon density. By scanning down to lower and lower energies, the RHIC experiments can search for evidence of a critical point or of a first order phase transition. The first phase of this program has been completed at RHIC [61] with many results already available.
Besides looking for evidence of a critical point, which may or may not lie in a region of the phase diagram accessible to heavy-ion collisions, one can also look for indications of a softening of the equation of state as the initial energy density decreases at lower beam energies. Since the conversion of the initial state lumpiness into the final state ridge-correlation and equivalently fluctuations is likely to be sensitive to the early pressure gradients, we might expect these observables to be more sensitive to changes in what part of the QCD equation of state the collisions are probing. As the beam energy increases, the initial energy density increases. If the pressure is increasing with energy density, then collisions that start with higher energy density will have larger pressure gradients. Those larger pressure gradients will be more effective at converting the lumpiness of the initial energy density into a lumpiness in momentum space. If collisions create initial energy densities corresponding to the minimum in the pressure vs energy density, then that lumpiness may tend to get washed out. This is especially true given that the fluctuations are driven by hot-spots in the initial overlap geometry that are approximately 1 fm in size. Even a fairly brief period of free-streaming early in the evolution can smear out hot-spots of that size. If the lumpiness is washed out, measurements of or fluctuations (accessed in data through ) will show a minimum for collisions with initial energy densities near where the pressure has a minimum.
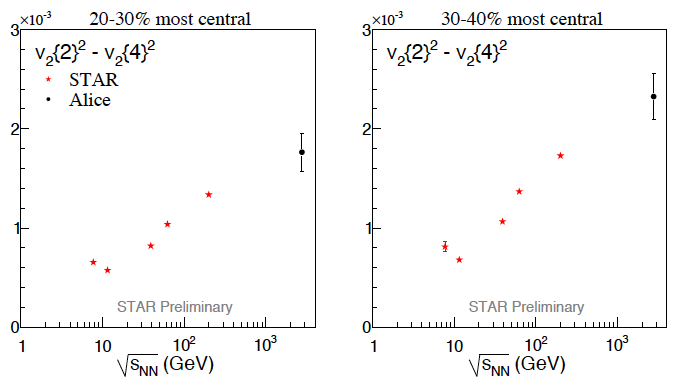
Figure 18 shows as a function of the colliding center of mass energy [43, 62]. The preliminary results do seem to indicate an increasing efficiency in the ability of early pressure gradients to convert density fluctuations into fluctuations. This is exactly what we expect based on the Lattice QCD calculations of the QCD equation of state (pressure vs. energy density). In short, the picture that seems to emerge is that the fluctuations are a snapshot of the initial density distributions. The clarity of that snapshot or the amplitude of the correlations, in turn, provides a measurement of the pressure at the very earliest time of the collision evolution. If the pressure is too low, the lumps expand and smear out before they can be efficiently converted into momentum space. Mapping out fluctuations vs beam energy is therefore, a very exciting topic in heavy-ion collisions. Even if a critical point is never found within the region of the phase diagram that can be accessed by heavy-ion collisions (as perhaps appears likely [63]), experimentally observing the QCD equation of state so directly, will be one of the most exciting results to emerge from heavy ion physics.
3.7 The Temperature of the Plasma
In order to map out the regions of the phase diagram probed by heavy-ion collisions and to study the thermodynamics of the matter created in the collisions, it’s important to estimate the temperature of the QGP when it is first formed. There are several ways to do this including by attempting to measure the color (or wavelength) of the photons emitted from the source. This method requires disentangling various sources of photons and then inferring the temperature from the slope of the spectra of the thermal photons. Recent studies indicate an inverse slope consistent with T=220 MeV [64], which is just above the expected transition temperature of 165 MeV. The photon data is also consistent with hydrodynamic models which start with temperatures in the range from 300 MeV to 600 MeV. This suggests again, that indeed we are probing above the phase transition.
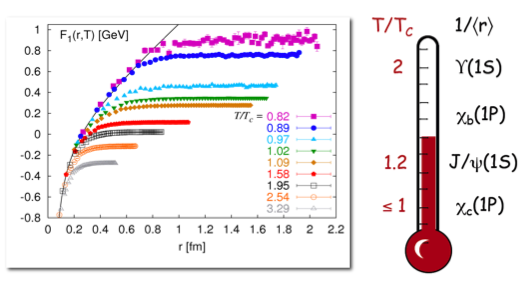
Another valuable tool for determining the temperature of the produced matter is the Debye screening of heavy quark pairs (Quarkonium). The idea is that in a hot and dense deconfined QGP, the abundant light quarks can screen the force acting to bind the heavy quark pairs in a quarkonium state [65]. The expectation of screening has been confirmed in lattice QCD calculations [66, 67]. Figure 19 shows the free-energy between two heavy quarks placed inside a bath of light quarks. The zero temperature free energy is shown as a black curve. As the temperature is increased the free energy drops further and further from the zero temperature case. At first the deviation is only at large distance, but as the temperature is increased, the screening sets in at smaller and smaller distances. This means that the large, loosely bound, quarkonium states will melt at low temperatures while the more tightly bound states will survive until hotter temperatures are reached. This sequential screening provides and effective thermometer for determining the temperature of the QGP by observing which Quarkonium states survive and which were unable to form in the QGP [68, 69]. Measurements show that the is suppressed at RHIC [72]. Measurements of higher excited states and the Upsilon still await more precise measurements.
3.8 The Opacity of the Plasma
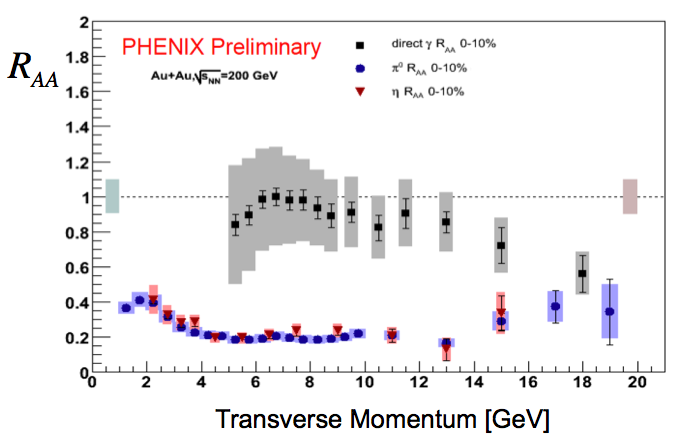
Another consequence of the formation of a hot and dense medium is jet quenching [17, 18, 19]. In a heavy ion collision, the hard scattered partons that form jets must traverse the hot and dense matter before they escape and hadronize in the vacuum. The time-scales require that hard processes occur early in the collision and the soft fragmentation process occurs late. As the fast moving parton traverses the dense medium, it can lose energy to the medium and be quenched. Since the number of high momentum particles falls quickly, even a modest loss of energy can result in a large suppression of high momentum hadrons observed in a particular bin. Figure 20 shows the ratio of particles observed in heavy-ion collisions compared to what is expected based on scaling of p+p collisions () [73, 74, 75, 76]. The left panel shows that the number of pions and -mesons with momentum above 5 GeV is suppressed by nearly a factor of 5. The figure also shows that photons in the same region are not suppressed, as is expected since they are color neutral and do not lose energy in the QGP.
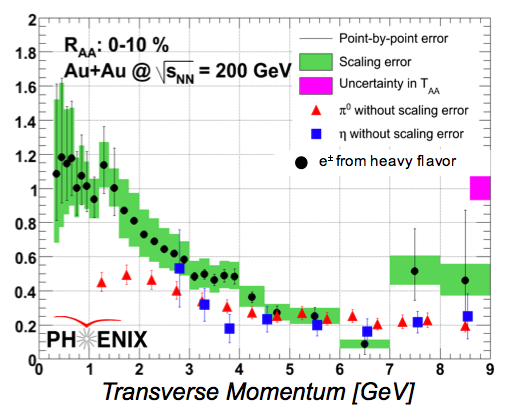
It is also of quite some interests to note that, as seen in the right panel of figure 20, even electrons coming from the decay of heavy flavor hadrons are suppressed [79]. This indicates that the QGP is able to quench even high momentum heavy-quark jets. Heavy quarks (e.g. charm and bottom quarks) where expected to lose less energy to the QGP matter[80, 81]. It’s not a priori obvious that heavy quarks will couple significantly to the medium and be influenced by its apparent expansion. The extent to which they do couple to the medium should be reflected in how large for heavy flavor hadrons becomes and how much the nuclear modification () deviates from unity. Precision measurements of Heavy Flavor mesons or baryons are not yet available from the RHIC experiments. As a proxy for identifying D-mesons, the STAR and PHENIX experiments have measured non-photonic electrons[77, 78]. Non-photonic electrons are generated from the weak-decays of heavy flavor hadrons and after various backgrounds have been accounted for can, with some caveats[82], be used to infer the and of D-mesons.
The right panel of figure 20 shows for non-photonic electrons[83, 79]. Prior to the measurement of non-photonic electron , it was expected that heavy-flavor hadrons would be significantly less suppressed than light flavor hadrons. These expectations based on a decrease in the coupling of charm quarks to the medium because of the dead-cone effect[80], are contradicted by the data; At GeV/, non-photonic electrons are as suppressed as pions. This suppression suggests a stronger than expected coupling of charm quarks to the medium. This coupling apparently also leads to significant for non-photonic electrons. The QGP created at RHIC turns out to be exceptionally opaque, even to heavy-quark jets.
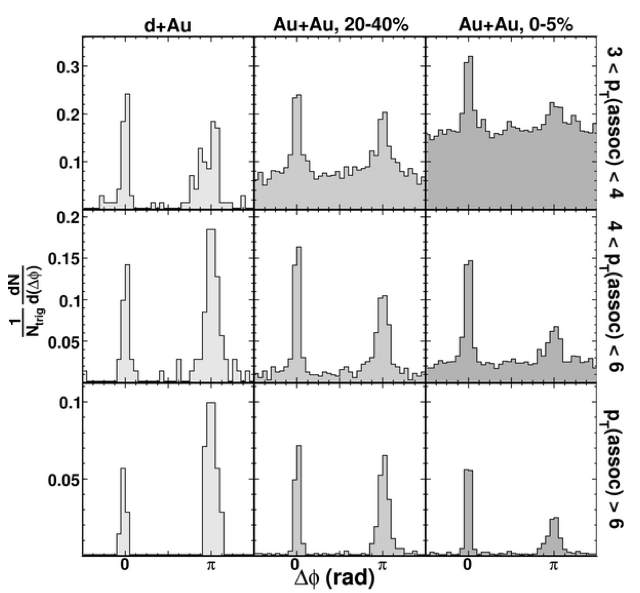
Evidence of the opacity of the QGP is also evident in the correlations between high momentum particles [84, 85]. These measurements serve as a stand-in for jet studies which are very difficult to carry out in heavy-ion collisions and are just now coming to fruition. The two particle correlations however, already demonstrate the opacity of the QGP to jets. The figure shows the angular difference between an 8 GeV hadron and a lower momentum associated hadron which satisfies the cut specified in the figure. These kinematic selections seem to be sufficient hard to resolve the correlations due to jet fragmentation as opposed to the correlations at lower momentum dominated by flow and initial state density fluctuations. The left panels of figure 21 show the results for d+Au collisions while the center and right panels show the results for mid-central and central Au+Au respectively. The peak near zero, is caused by the correlation between two particles coming from the same parton. The peak at is caused by the correlation between a hadron from a jet and a hadron from the away-side jet created in the original scattering process. For d+Au collisions, the away-side peak contains more pairs than the near-side peak. For central Au+Au collisions the away-side peak is suppressed. This suppression is consistent with an opaque medium. When looking for high momentum particles, we have a preference for finding particles originating from jets near the surface of the medium. When we look at the away-side, we see the correlations from the jet that needed to traverse the medium before escaping. The away-side jet is shown to be quenched in the opaque medium.
4 Conclusion
Studies at RHIC have revealed that the collision of Au nuclei at ultra-relativistic energies creates a hot and dense QGP that is opaque to fast moving color charges, acts like a liquid, transforms into hadronic matter through a smooth cross-over, and converts spatial structure in the initial density distributions into correlations between final particles in momentum space. Current studies are searching for a first order phase transition at higher baryon chemical potentials, a possible critical point, and/or indications relatively rapid increases in the degrees-of-freedom indicating the onset of QGP. Recent advances in understanding heavy-ion phenomenology and detector upgrades will allow RHIC to remain at the forefront of nuclear physics for another decade. The RHIC facility is ideally suited for these studies and continues to provide fascinating insights on the nature of QCD matter.
References
- [1] W. Reisdorf and H. G. Ritter, Ann. Rev. Nucl. Part. Sci. 47, 663 (1997).
- [2] N. Herrmann, J. P. Wessels and T. Wienold, Ann. Rev. Nucl. Part. Sci. 49, 581 (1999).
- [3] S. Borsanyi et al., JHEP 1011, 077 (2010); F. Karsch, PoS C POD07 (2007) 026 [arXiv:0711.0656 [hep-lat]]; PoS LAT2007 (2007) 015 [arXiv:0711.0661 [hep-lat]].
- [4] R. Hagedorn, Statistical Thermodynamics of Strong Interactions at High Energies, Nuovo Cim. Suppl. 3, 147–186, 1965.
- [5] W. Broniowski, W. Florkowski and L. Y. Glozman, Phys. Rev. D 70, 117503 (2004) [arXiv:hep-ph/0407290].
- [6] E. V. Shuryak, Phys. Rept. 61, 71 (1980).
- [7] I. Arsene et al. [BRAHMS Collaboration], Nucl. Phys. A 757, 1 (2005); B. B. Back et al. [PHOBOS Collaboration], Nucl. Phys. A 757, 28 (2005); J. Adams et al. [STAR Collaboration], Nucl. Phys. A 757, 102 (2005); K. Adcox et al. [PHENIX Collaboration], Nucl. Phys. A 757, 184 (2005).
- [8] M. L. Miller, K. Reygers, S. J. Sanders and P. Steinberg, Ann. Rev. Nucl. Part. Sci. 57, 205 (2007) [arXiv:nucl-ex/0701025].
- [9] STAR Collaboration, C. Adler et al., Nucl. Instr. Meth. A 499, 624 (2003).
- [10] O. Y. Barannikova [STAR Collaboration], arXiv:nucl-ex/0403014.
- [11] P. Braun-Munzinger, K. Redlich and J. Stachel, arXiv:nucl-th/0304013.
- [12] K. H. Ackermann et al. [STAR Collaboration], Phys. Rev. Lett. 86, 402 (2001); C. Adler et al. [STAR Collaboration], Phys. Rev. Lett. 89, 132301 (2002); J. Adams et al. [STAR Collaboration], Phys. Rev. Lett. 92, 052302 (2004); J. Adams et al. [STAR Collaboration], Phys. Rev. C 72, 014904 (2005); J. Adams et al. [STAR Collaboration], Phys. Rev. Lett. 95, 122301 (2005).
- [13] P. Huovinen, P. F. Kolb, U. W. Heinz, P. V. Ruuskanen and S. A. Voloshin, Phys. Lett. B 503, 58 (2001); D. Teaney, Phys. Rev. C 68, 034913 (2003).
- [14] B. Muller, Acta Phys. Polon. B 38, 3705 (2007) [arXiv:0710.3366 [nucl-th]]; W. A. Zajc, Nucl. Phys. A 805, 283 (2008) [arXiv:0802.3552 [nucl-ex]].
- [15] P. Danielewicz and M. Gyulassy, Phys. Rev. D 31, 53 (1985); P. Kovtun, D. T. Son and A. O. Starinets, Phys. Rev. Lett. 94, 111601 (2005).
- [16] X. N. Wang and M. Gyulassy, Phys. Rev. Lett. 68, 1480 (1992).
- [17] X. N. Wang, Phys. Rev. C 63, 054902 (2001) [arXiv:nucl-th/0009019].
- [18] M. Gyulassy, I. Vitev, X. N. Wang and P. Huovinen, Phys. Lett. B 526, 301 (2002) [arXiv:nucl-th/0109063].
- [19] M. Gyulassy, I. Vitev and X. N. Wang, Phys. Rev. Lett. 86, 2537 (2001) [arXiv:nucl-th/0012092].
- [20] R. J. Fries, V. Greco and P. Sorensen, arXiv:0807.4939 [nucl-th].
- [21] S. A. Voloshin, Nucl. Phys. A 715, 379 (2003) [arXiv:nucl-ex/0210014].
- [22] Z. w. Lin and C. M. Ko, Phys. Rev. C 65, 034904 (2002) [arXiv:nucl-th/0108039].
- [23] D. Molnar and S. A. Voloshin, Phys. Rev. Lett. 91, 092301 (2003) [arXiv:nucl-th/0302014].
- [24] R. C. Hwa and C. B. Yang, Phys. Rev. C 67, 064902 (2003).
- [25] R. J. Fries, B. Muller, C. Nonaka and S. A. Bass, Phys. Rev. C 68, 044902 (2003).
- [26] V. Greco, C. M. Ko and P. Levai, Phys. Rev. C 68, 034904 (2003).
- [27] V. Greco, C. M. Ko and P. Levai, Phys. Rev. Lett. 90, 202302 (2003).
- [28] R. J. Fries, B. Muller, C. Nonaka and S. A. Bass, Phys. Rev. Lett. 90, 202303 (2003).
- [29] S. Pratt and S. Pal, Nucl. Phys. A 749, 268 (2005) [Phys. Rev. C 71, 014905 (2005)] [arXiv:nucl-th/0409038].
- [30] L. Ravagli, H. van Hees and R. Rapp, arXiv:0806.2055 [hep-ph].
- [31] J. Adams et al. [STAR Collaboration], Phys. Rev. Lett. 92, 052302 (2004) [arXiv:nucl-ex/0306007].
- [32] S. S. Adler et al. [PHENIX Collaboration], Phys. Rev. Lett. 91, 172301 (2003) [arXiv:nucl-ex/0305036].
- [33] H. Kowalski, T. Lappi and R. Venugopalan, Phys. Rev. Lett. 100, 022303 (2008)
- [34] S. J. Brodsky and A. Sickles, Phys. Lett. B 668, 111 (2008) [arXiv:0804.4608 [hep-ph]].
- [35] B. I. Abelev et al. [STAR Collaboration], Phys. Lett. B 655, 104 (2007) [arXiv:nucl-ex/0703040].
- [36] A. Dumitru, F. Gelis, L. McLerran and R. Venugopalan, Nucl. Phys. A 810, 91 (2008) [arXiv:0804.3858 [hep-ph]].
- [37] L. P. Csernai and J. I. Kapusta, Phys. Rev. D 46, 1379 (1992).
- [38] J. Randrup, Phys. Rev. Lett. 92, 122301 (2004) [arXiv:hep-ph/0308271].
- [39] A. Mocsy and P. Sorensen, Phys. Lett. B 690, 135 (2010) [arXiv:0908.3983 [nucl-th]].
- [40] J. Adams et al. [STAR Collaboration] Phys. Rev. Lett. 95:152301, (2005); F. Wang [STAR Collaboration], J. Phys. G 30 (2004) S1299; J. Adams et al. [STAR Collaboration], Phys. Rev. C 73 (2006) 064907; J. Putschke, J. Phys. G 34 (2007) S679; J. Adams et al. [Star Collaboration], Phys. Rev. C 75 (2007) 034901; Brijesh Srivastava for the STAR Collaboration, Int. J. Mod. Phys. E16, 3371 (2008); A. Adare et al. [PHENIX Collaboration], Phys. Rev. C 78 (2008) 014901; B. Alver et al. [PHOBOS Collaboration], J. Phys. G 35, 104080 (2008).
- [41] J. Adams et al. [STAR Collaboration], J. Phys. G 32, L37 (2006).
- [42] J. Takahashi, B. M. Tavares, W. L. Qian, F. Grassi, Y. Hama, T. Kodama and N. Xu, arXiv:0902.4870 [nucl-th].
- [43] A. Adare et al. [PHENIX Collaboration], arXiv:1105.3928 [nucl-ex]; P. Sorensen [STAR Collaboration], J. Phys. GG 38, 124029 (2011) [arXiv:1110.0737 [nucl-ex]]; [ALICE Collaboration], Phys. Rev. Lett. 107, 032301 (2011) [arXiv:1105.3865 [nucl-ex]]; J. Jia [ATLAS Collaboration], J. Phys. GG 38, 124012 (2011) [arXiv:1107.1468 [nucl-ex]].
- [44] A. P. Mishra, R. K. Mohapatra, P. S. Saumia, A. M. Srivastava, Phys. Rev. C77, 064902 (2008).
- [45] P. Sorensen, [arXiv:0808.0503 [nucl-ex]]; P. Sorensen, J. Phys. G G37, 094011 (2010).
- [46] W. Broniowski, P. Bozek and M. Rybczynski, Phys. Rev. C 76, 054905 (2007).
- [47] B. Alver, G. Roland, Phys. Rev. C81, 054905 (2010).
- [48] G. L. Ma et al., Phys. Lett. B 641, 362 (2006).
- [49] G. Agakishiev et al. [STAR Collaboration], arXiv:1109.4380 [nucl-ex].
- [50] J. Adams et al. [STAR Collab.], Phys. Rev. Lett. 95, 152301 (2005); M. McCumber and J. Frantz, Acta Phys. Hung. A 27, 213 (2006).
- [51] S. A. Voloshin, Nucl. Phys. A 749, 287 (2005).
- [52] P. Sorensen, B. Bolliet, A. Mocsy, Y. Pandit and N. Pruthi, Phys. Lett. B 705, 71 (2011)
- [53] P. Staig and E. Shuryak, arXiv:1008.3139 [nucl-th]; A. Mocsy and P. Sorensen, arXiv:1008.3381 [hep-ph]; [arXiv:1101.1926 [hep-ph]]; B. H. Alver, C. Gombeaud, M. Luzum and J. Y. Ollitrault, Phys. Rev. C 82, 034913 (2010).
- [54] P. F. Kolb, Heavy Ion Phys. 21, 243 (2004).
- [55] F. Retiere and M. A. Lisa, Phys. Rev. C 70, 044907 (2004) [arXiv:nucl-th/0312024].
- [56] A. R. Timmins [ALICE Collaboration], arXiv:1106.6057 [nucl-ex].
- [57] H. De Vries, C. W. De Jager and C. De Vries, Atom. Data Nucl. Data Tabl. 36, 495 (1987).
- [58] Y. Aoki, G. Endrodi, Z. Fodor, S. D. Katz and K. K. Szabo, Nature 443, 675 (2006) [arXiv:hep-lat/0611014].
- [59] J. Adams et al. [STAR Collaboration], Phys. Rev. C 72, 044902 (2005) [arXiv:nucl-ex/0504031].
- [60] J. Cleymans, H. Oeschler, K. Redlich and S. Wheaton, Phys. Rev. C 73, 034905 (2006) [arXiv:hep-ph/0511094]; F. R. Brown et al., Phys. Rev. Lett. 65, 2491 (1990); A. Mocsy, F. Sannino and K. Tuominen, Phys. Rev. Lett. 92, 182302 (2004) [arXiv:hep-ph/0308135]; F. Karsch and M. Lutgemeier, “Deconfinement and chiral symmetry restoration in an SU(3) gauge theory Nucl. Phys. B 550, 449 (1999) [arXiv:hep-lat/9812023]; M. Asakawa and K. Yazaki, Nucl. Phys. A 504, 668 (1989); A. Barducci, R. Casalbuoni, G. Pettini and R. Gatto, Phys. Rev. D 49, 426 (1994); J. Berges and K. Rajagopal, “Color superconductivity and chiral symmetry restoration at nonzero baryon Nucl. Phys. B 538, 215 (1999) [arXiv:hep-ph/9804233]; A. M. Halasz, A. D. Jackson, R. E. Shrock, M. A. Stephanov and J. J. M. Verbaarschot, Phys. Rev. D 58, 096007 (1998) [arXiv:hep-ph/9804290]; O. Scavenius, A. Mocsy, I. N. Mishustin and D. H. Rischke, Phys. Rev. C 64, 045202 (2001) [arXiv:nucl-th/0007030]; N. G. Antoniou and A. S. Kapoyannis, Phys. Lett. B 563, 165 (2003) [arXiv:hep-ph/0211392]; Y. Hatta and T. Ikeda, Phys. Rev. D 67, 014028 (2003) [arXiv:hep-ph/0210284]; M. A. Stephanov, Prog. Theor. Phys. Suppl. 153, 139 (2004) [Int. J. Mod. Phys. A 20, 4387 (2005)] [arXiv:hep-ph/0402115]; M. A. Stephanov, K. Rajagopal and E. V. Shuryak, Phys. Rev. Lett. 81, 4816 (1998) [arXiv:hep-ph/9806219].
- [61] P. Sorensen [STAR Collaboration], PoS CPOD2006 (2006) 019 [arXiv:nucl-ex/0701028]; T. Satogata, et.al., PoS CPOD2007 (2007) 051.
- [62] M. Mitrovski for the STAR Collaboration, Quark Matter Poster.
- [63] E. S. Fraga, L. F. Palhares and P. Sorensen, Phys. Rev. C 84, 011903 (2011) [arXiv:1104.3755 [hep-ph]].
- [64] A. Adare et al. [PHENIX Collaboration], Phys. Rev. Lett. 104, 132301 (2010) [arXiv:0804.4168 [nucl-ex]].
- [65] T. Matsui and H. Satz, Phys. Lett. B 178, 416 (1986).
- [66] O. Kaczmarek, F. Karsch, F. Zantow and P. Petreczky, “Static quark anti-quark free energy and the running coupling at finite Phys. Rev. D 70, 074505 (2004) [Erratum-ibid. D 72, 059903 (2005)] [arXiv:hep-lat/0406036].
- [67] K. Petrov [RBC-Bielefeld Collaboration], PoS LAT2006, 144 (2006) [arXiv:hep-lat/0610041].
- [68] F. Karsch, M. T. Mehr and H. Satz, Z. Phys. C 37, 617 (1988).
- [69] S. Digal, P. Petreczky and H. Satz, Phys. Rev. D 64, 094015 (2001) [arXiv:hep-ph/0106017].
- [70] A. Mocsy and P. Petreczky, Phys. Rev. D 73, 074007 (2006) [arXiv:hep-ph/0512156].
- [71] A. Mocsy and P. Petreczky, Phys. Rev. Lett. 99, 211602 (2007) [arXiv:0706.2183 [hep-ph]].
- [72] A. Adare et al. [PHENIX Collaboration], Phys. Rev. Lett. 98, 232301 (2007) [arXiv:nucl-ex/0611020].
- [73] S. S. Adler et al. [PHENIX Collaboration], Phys. Rev. Lett. 91, 072301 (2003) [arXiv:nucl-ex/0304022].
- [74] J. Adams et al. [STAR Collaboration], Phys. Rev. Lett. 91, 172302 (2003) [arXiv:nucl-ex/0305015].
- [75] S. S. Adler et al. [PHENIX Collaboration], Phys. Rev. Lett. 94, 232301 (2005) [arXiv:nucl-ex/0503003].
- [76] S. S. Adler et al. [PHENIX Collaboration], Phys. Rev. C 75, 024909 (2007) [arXiv:nucl-ex/0611006].
- [77] S. S. Adler et al. [PHENIX Collaboration], Phys. Rev. Lett. 96, 032301 (2006) [arXiv:nucl-ex/0510047].
- [78] B. I. Abelev et al. [STAR Collaboration], Phys. Rev. Lett. 98, 192301 (2007) [arXiv:nucl-ex/0607012].
- [79] A. Adare et al. [PHENIX Collaboration], Phys. Rev. Lett. 98, 172301 (2007) [arXiv:nucl-ex/0611018].
- [80] Y. L. Dokshitzer and D. E. Kharzeev, Phys. Lett. B 519, 199 (2001) [arXiv:hep-ph/0106202].
- [81] M. Djordjevic and M. Gyulassy, Nucl. Phys. A 733, 265 (2004) [arXiv:nucl-th/0310076].
- [82] P. R. Sorensen and X. Dong, Phys. Rev. C 74, 024902 (2006) [arXiv:nucl-th/0512042].
- [83] S. S. Adler et al. [PHENIX Collaboration], Phys. Rev. C 72, 024901 (2005) [arXiv:nucl-ex/0502009].
- [84] C. Adler et al. [STAR Collaboration], Phys. Rev. Lett. 90, 082302 (2003) [arXiv:nucl-ex/0210033].
- [85] J. Adams et al. [STAR Collaboration], Phys. Rev. Lett. 97, 162301 (2006) [arXiv:nucl-ex/0604018].