Relative merits of different types of rest-frame optical observations to constrain galaxy physical parameters
Abstract
We present a new approach to constrain galaxy physical parameters from the combined interpretation of stellar and nebular emission in wide ranges of observations. This approach relies on the Bayesian analysis of any type of galaxy spectral energy distribution using a comprehensive library of synthetic spectra assembled using state-of-the-art models of star formation and chemical enrichment histories, stellar population synthesis, nebular emission and attenuation by dust. We focus on the constraints set by 5-band photometry and low- and medium-resolution spectroscopy at rest wavelengths =3600–7400 Å on a few physical parameters of galaxies: the observer-frame absolute -band stellar mass-to-light ratio, ; the fraction of a current galaxy stellar mass formed during the last 2.5 Gyr, ; the specific star formation rate, ; the gas-phase oxygen abundance, ; the total effective -band absorption optical depth of the dust, ; and the fraction of this arising from dust in the ambient interstellar medium, . Since these parameters cannot be known a priori for any galaxy sample, we assess the accuracy to which they can be retrieved from observations by simulating ‘pseudo-observations’ using models with known parameters. Assuming that these models are good approximations of true galaxies, we find that the combined analysis of stellar and nebular emission in low-resolution (50 Å FWHM) galaxy spectra provides valuable constraints on all physical parameters. The typical uncertainties in high-quality spectra are about 0.13 dex for , 0.23 for , 0.24 dex for , 0.28 for , 0.64 for and 0.16 for . The uncertainties in and tighten by about 20 percent for galaxies with detectable emission lines and by another 45 percent when the spectral resolution is increased to 5 Å FWHM. At this spectral resolution, the analysis of the combined stellar and nebular emission in the high-quality spectra of 12,660 SDSS star-forming galaxies using our approach yields likelihood distributions of , , and similar to those obtained in previous separate analyses of the stellar and nebular emission at the original (twice higher) SDSS spectral resolution. Meanwhile, rest-frame photometry provides competitive constraints on . We show that the constraints derived on galaxy physical parameters from these different types of observations depend sensitively on signal-to-noise ratio. Our approach can be extended to the analysis of any type of observation across the wavelength range covered by spectral evolution models.
keywords:
galaxies: general – galaxies: ISM – galaxies: stellar content – galaxies: statistics.1 Introduction
The light emitted by stars and the interstellar medium in galaxies contains important clues about the physical processes that drive galaxy evolution. Different strategies have been adopted to survey the spectral energy distributions of large samples of galaxies to gather these clues. High-quality photometry from surveys such as the Sloan Digital Sky Survey (SDSS, York et al. 2000), the Canada-France-Hawaii Telescope Legacy Survey (CFHTLS, Goranova et al. 2009) and the Cosmic Evolution Survey (COSMOS, Scoville et al. 2007) has brought important information about the rest-frame optical emission from millions of galaxies out to redshifts of a few. This is supplemented by medium-resolution spectroscopy of over a million local galaxies from the SDSS and the Two-degree Field Galaxy Redshift Survey (2dFGRS, Colless et al. 2001), and low- and medium-resolution spectroscopy of tens of thousands of galaxies at higher redshift from surveys such as the VIMOS VLT Deep Survey (VVDS, Le Fèvre et al. 2005) and the Deep Extragalactic Evolutionary Probe (DEEP2, Davis et al. 2003). The interpretation of the high-quality data gathered by these surveys has triggered the development of sophisticated models of galaxy spectral evolution (e.g., Bruzual & Charlot 2003; González Delgado et al. 2005; Maraston 2005; Coelho et al. 2007; Walcher et al. 2009; Vazdekis et al. 2010; Thomas et al. 2011; see also Charlot & Longhetti 2001; Kewley & Dopita 2002). These models can help us constrain the star formation and chemical enrichment histories of galaxies through the analysis of different types of photometric and spectroscopic observations. So far, however, the relative merits of different observational approaches to constrain basic physical properties of galaxies have not been quantified in detail.
Recent studies have brought important insight into the efficiency of different types of observations to constrain physical quantities such as star formation history, metallicity and dust content from observations of the rest-frame optical emission of galaxies. Multiband photometry has proved valuable to constrain galaxy redshifts and basic quantities such as stellar mass-to-light ratio (provided a stellar initial mass function; hereafter IMF) and, when combined with rest-frame ultraviolet and near-infrared constraints, star formation rate and attenuation by dust (e.g., Bell & de Jong 2001; Salim et al. 2005, 2007; Ilbert et al. 2006; Schaerer & de Barros 2010; but see Wuyts et al. 2009; Conroy et al. 2010). Medium-resolution spectroscopy allows separate analyses of nebular-emission and stellar-absorption features, and hence, more accurate constraints on the star formation history, stellar and interstellar metallicities, attenuation by dust and nuclear activity (e.g., Kauffmann et al. 2003a; Brinchmann et al. 2004; Heckman et al. 2004; Tremonti et al. 2004; Cid Fernandes et al. 2005; Gallazzi et al. 2005; Panter et al. 2007; Wild et al. 2007). At low spectral resolution, the difficulty of distinguishing between the signatures of nebular-emission and stellar-absorption features, especially around H-Balmer lines, renders analyses more complicated (e.g., Lamareille et al. 2006). This difficulty could be overcome with the ability to interpret simultaneously the stellar and nebular emission from galaxies. In this case, the relative merits of multiband photometry and low- and medium-resolution spectroscopy to constrain galaxy physical parameters would need to be reexamined.
In this paper, we develop a new approach to interpret the combined stellar and nebular emission from galaxies in wide ranges of multi-wavelength observations. To achieve this, we appeal to a set of state-of-the-art models of galaxy star formation and chemical enrichment histories, stellar population synthesis, nebular emission and attenuation by dust. We use these models to generate a comprehensive library of several million galaxy spectral energy distributions. This library can be used to retrieve probability density functions of physical parameters from the Bayesian analysis of any observed spectral energy distribution. We focus here on the constraints set by 5-band photometry and low- and medium-resolution spectroscopy at rest wavelengths =3600–7400 Å on a few basic physical parameters of galaxies: the observer-frame absolute -band stellar mass-to-light ratio (); the fraction of a current galaxy stellar mass formed during the last 2.5 Gyr (); the specific star formation rate (); the gas-phase oxygen abundance []; the total effective -band absorption optical depth of the dust (); and the fraction of this arising from dust in the ambient interstellar medium (hereafter ISM; ). These parameters cannot be known a priori for any galaxy sample. To assess the accuracy to which they can be retrieved from different types of observations, we therefore simulate ‘pseudo-observations’ by convolving the spectral energy distributions of models with known parameters with appropriate instrument responses and then applying artificial noise to mimic true observations. This approach allows us to make accurate predictions for the optimistic case in which the models we rely on are good approximations of true galaxies. A most notable outcome of our study is that the combined analysis of stellar and nebular emission in low-resolution (50 Å FWHM), high-quality (median signal-to-noise ratio per pixel ) galaxy spectra provides valuable constraints on all the physical parameters mentioned above. We also explore how the constraints from different types of photometric and spectroscopic observations depend on signal-to-noise ratio and the inclusion of nebular emission in the analysis. Our main results are summarized in Table 2 (Section 5).
We describe our approach to constrain galaxy physical parameters from the combined analysis of stellar and nebular emission in Section 2 below. In Section 3, we investigate the accuracy to which the parameters , , , , and can be constrained from different types of photometric and spectroscopic observations. Then, in Section 4, we compare the constraints derived from the analysis of the medium-resolution spectra of 12,660 SDSS star-forming galaxies using our approach with those obtained in previous separate analyses of the stellar and nebular emission. We also investigate the influence of the prior distributions of physical parameters on the retrieved probability density functions. Our conclusions are summarized in Section 5. Throughout this paper, we adopt the standard cosmology , and .
2 Modeling approach
In this section, we describe our approach to assess the retrievability of galaxy physical parameters from the combined analysis of stellar and nebular emission in wide ranges of multi-wavelength observations. We first build a comprehensive library of star formation and chemical enrichment histories of galaxies (Section 2.1). We appeal to state-of-the-art models of spectral evolution to compute the emission from stars and gas and the attenuation by dust in these galaxies (Section 2.2). This allows us to assemble a large library of galaxy spectral energy distributions (Section 2.3), which we can use to retrieve likelihood distributions of physical parameters from the Bayesian analysis of any type of observed spectral energy distribution (Section 2.4).
2.1 Library of star formation and chemical enrichment histories
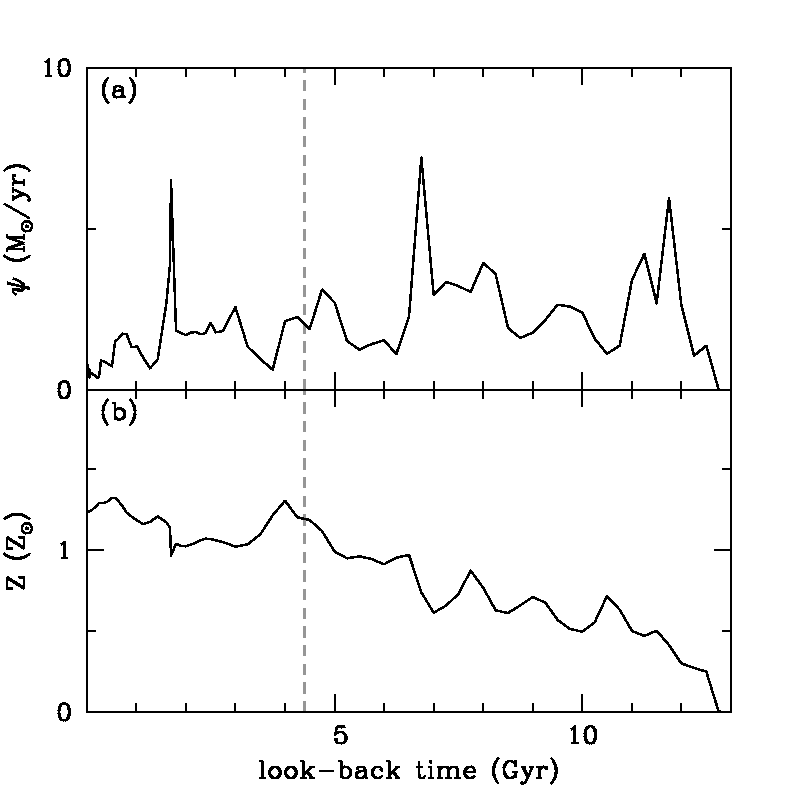
We build a comprehensive library of galaxy star formation and chemical enrichment histories by performing a semi-analytic post-treatment of the Millennium cosmological simulation of Springel et al. (2005). This large-scale cosmological simulation follows the growth, interaction and merging history of dark matter haloes from redshift to the present time.111In the Millennium simulation, dark matter is represented as a set of about point particles, which interact gravitationally in a cubic region of side Mpc. Individual particles have a mass of , and the detection threshold for a dark matter halo is 20 particles, i.e. about (see Springel et al. 2005, for detail). We adopt the simple semi-analytic recipes of De Lucia & Blaizot (2007, see also ) to follow star formation and the associated metal production by gas falling into these dark matter haloes. We compute in this way the star formation and chemical enrichment histories of 500,000 galaxies with present-day stellar masses comprised between (corresponding roughly to the mass resolution of the simulation; Blaizot et al. 2004) and . Figure 1 shows an example of star formation and chemical enrichment histories of a galaxy with present-day stellar mass . The spikes in both curves reflect the various episodes of interactions and mergers that shaped the evolution of the galaxy. As shown by Wild et al. (2008), star formation histories computed in this way account well for the observed properties of galaxies at different redshifts in the VVDS () and SDSS () samples.
About 35 percent of the 500,000 galaxies generated from the semi-analytic post-treatment of the Millennium simulation do not form stars at . These contain a negligible amount of interstellar gas and correspond to the population of present-day early-type galaxies. The remaining galaxies span a relatively narrow range of star formation properties. Their specific star formation rates peak around , with a dispersion of only a factor of 2. Furthermore, the interstellar metallicity in these galaxies correlates significantly with , in the sense that the most metal-poor galaxies form stars most actively. The galaxies also have roughly similar recent histories of star formation, as quantified by the star formation history parameter , which we define as the fraction of the current galaxy stellar mass formed during the last 2.5 Gyr (this time lag corresponds to the main-sequence lifetime of A-F stars with strong Balmer absorption features). This parameter has a narrow distribution centred on , with a dispersion of only 0.1. The distributions of and are compatible with roughly constant (overall) star formation over the past 2.5 Gyr in galaxies more massive than , given that 40 percent of the stellar mass formed during this period is returned to the ISM in the form of winds and supernovae (e.g. Bruzual & Charlot 2003). The above distributions of , and are consistent with the observed properties of nearby, star-forming SDSS galaxies (e.g. Kauffmann et al. 2003a; Brinchmann et al. 2004; Tremonti et al. 2004).
The relatively limited ranges of star formation histories and interstellar metallicities described above, while appropriate to interpret observations of nearby SDSS galaxies more massive than , could bias statistical estimates of , and in galaxies drawn from other samples or in different mass ranges (e.g. Weinmann et al. 2006; see also Section 4.2 below). To avoid such biases, we broaden the original prior distributions of these parameters predicted by the semi-analytic recipes of De Lucia & Blaizot (2007) in 2 ways. Firstly, we widen the range in by randomly drawing the evolutionary stage (i.e. galaxy age) at which a galaxy is looked at in the library. In practice, we draw this stage uniformly in redshift between and 1.7, i.e. the upper limit beyond which reaches unity for a substantial fraction of the galaxies (Fig. 4b below; this resampling makes the proportion of early-type galaxies drop from 35 to about 10 percent in the library). Secondly, for galaxies with ongoing star formation at the selected stage, we broaden the distributions of the current star formation rate and the current interstellar metallicity, as follows (we define here as ‘current’ the average of a quantity over a period of 10 Myr before a galaxy is looked at). We redistribute the specific star formation rate over the interval using the probability density function , which is approximately uniform over the logarithmic range from to and drops to zero at and (Fig. 4c). We redistribute the current interstellar metallicity logarithmically between 0.1 and 3.5 times solar ().
The random resampling of and for star-forming galaxies in the library is justified in part by the stochastic nature of star formation and chemical evolution in hierarchical scenarios of galaxy formation. Also, since the changes impact only the last 10 Myr of evolution, they have a negligible influence on the global star formation and chemical enrichment histories derived from the semi-analytic post-treatment of the Millennium simulation. In return, the use of wider and uncorrelated prior distributions of and , together with the broader sampling in galaxy age (and ), greatly enhances the usefulness of the model library to explore and interpret the spectral properties of observed galaxy populations.
2.2 Galaxy spectral modeling
We now describe the way in which we compute the emission from stars and gas and the attenuation by dust in the model galaxies generated in the previous section. The luminosity per unit wavelength emerging at time from a galaxy can be expressed as (see, e.g., Charlot & Longhetti 2001)
| (2.1) |
where is the star formation rate at time , is the luminosity emitted per unit wavelength and per unit mass by a stellar generation of age and metallicity , and is the transmission function of the interstellar medium, defined as the fraction of the radiation produced at wavelength at time by a generation of stars of age that is transferred by the ISM. Following Charlot & Longhetti (2001), we write as the product of the transmission functions of the ionized gas, , and the neutral ISM, ,
| (2.2) |
In the next paragraphs, we describe the prescriptions we adopt for the functions , and .
2.2.1 Stellar emission
We compute the luminosity emitted per unit wavelength and per unit mass by a stellar generation of age and metallicity using the latest version of Bruzual & Charlot (2003) stellar population synthesis code (Charlot & Bruzual, in preparation). This code predicts the spectral evolution of stellar populations at wavelengths from 91 Å to 160 m and at ages between and yr, for different metallicities (from about 0.005 to 4), initial mass functions and star formation histories. We use the most recent version of the code, which incorporates a new library of observed stellar spectra (Sánchez-Blázquez et al. 2006) and new prescriptions for the evolution of stars less massive than 20 (Bertelli et al. 2008, 2009) and for the thermally pulsating asymptotic giant branch (TP-AGB) evolution of low- and intermediate-mass stars (Marigo et al. 2008). The main effect of the revised TP-AGB prescription is to improve the predicted near-infrared colours of intermediate-age stellar populations (e.g., González-Lópezlira et al. 2010). In all applications throughout this paper, we adopt the Galactic-disc IMF of Chabrier (2003).
2.2.2 Nebular emission
A main feature of our study is that we account for the contribution by ionized gas to the emission from galaxies. We follow the prescription of Charlot & Longhetti (2001) to compute the transmission function of the gas photoionized at time by stars of age in a galaxy. This consists in adopting effective (i.e. galaxy-wide) parameters to describe the ensemble of H ii regions and the diffuse gas ionized by young stars throughout the galaxy. The main adjustable parameters are the interstellar metallicity, , the zero-age ionization parameter, (which characterizes the volume-averaged ratio of ionizing-photon to gas densities at age ), and the dust-to-metal (mass) ratio, (which characterizes the depletion of metals on to dust grains) of the photoionized gas.222These effective parameters were denoted by , and in Charlot & Longhetti (2001).
Following Charlot & Longhetti (2001), we neglect the contribution by stars older than 10 Myr to nebular emission, i.e., we write
| (2.3) |
We use the standard photoionization code cloudy (Ferland 1996) to compute the transmission function at earlier ages, assuming that galaxies are ionization bounded. For , therefore, is close to zero at wavelengths blueward of the H-Lyman limit and greater than unity at wavelengths corresponding to emission lines (we record the luminosities of the 109 most prominent emission lines at all wavelengths; we also include the recombination continuum radiation). When computing in equations (2.1)–(2.2), we take the metallicity of the photoionized gas to be the current metallicity of the galaxy. We randomly draw the dust-to-metal ratio from a uniform prior distribution between and , and the zero-age ionization parameter from a logarithmic prior distribution between and . We fix all other parameters of the photoionization code at the standard values favored by Charlot & Longhetti (2001, see their paper for detail).
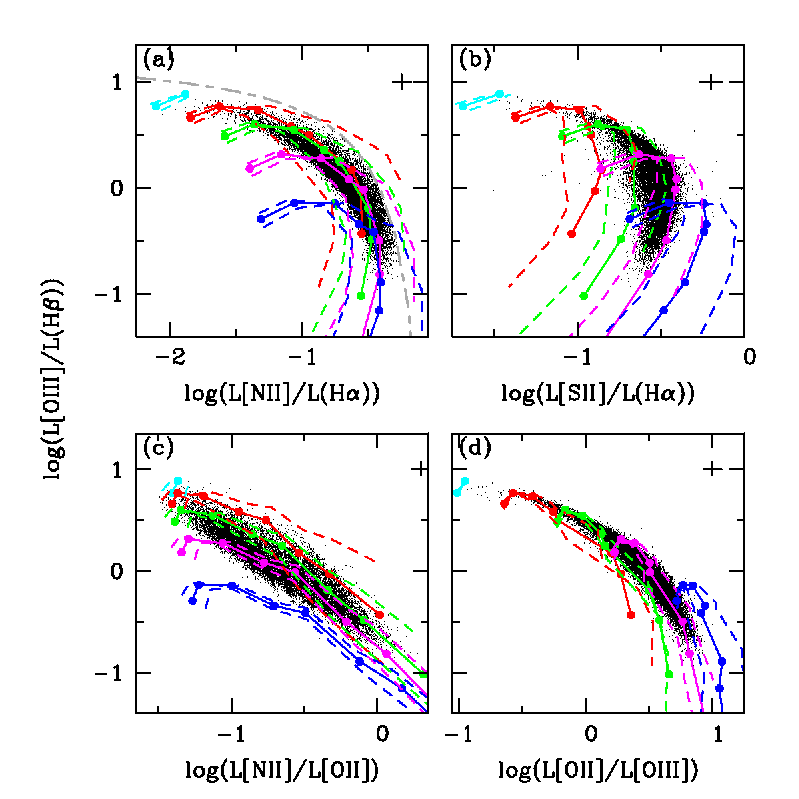
In Fig. 2, we compare the luminosities of prominent optical emission lines obtained in this way for galaxies with different , and , with high-quality observations of a sample of 28,075 star-forming galaxies from the SDSS Data Release 7 (DR7; Abazajian et al. 2009). The different panels show the relations between different luminosity ratios constructed with the (hereafter ), H, , H, and lines. We selected the star-forming galaxies of Fig. 2 from the SDSS DR7 by requiring high signal-to-noise ratio () in all lines and excluding galaxies in which the emission could be contaminated by an active galactic nucleus (AGN; we applied the conservative criterion of Kauffmann et al. 2003b to reject AGNs from the standard Baldwin et al. 1981 line-diagnostic diagram reproduced in Fig. 2a). The excellent agreement between models and SDSS observations in Fig. 2 is similar to that obtained by Brinchmann et al. (2004) using the original Charlot & Longhetti (2001) models. This allows the derivation of independent constraints on , and from the different line luminosity ratios. For simplicity, in what follows, we adopt a fixed intrinsic line velocity dispersion of 100 km s-1 (typical of SDSS star-forming galaxies; e.g. Brinchmann et al. 2004) when computing the contribution by ionized gas to the emission from galaxies.
2.2.3 Attenuation by dust
The attenuation by dust of the emission from a galaxy depends on several factors, including the amount and structure of the interstellar gas, the metallicity and physical conditions of this gas and the orientation of the galaxy. Two galaxies with identical star formation and chemical enrichment histories but different sizes (and hence different total gas masses), ISM structures and orientations can have widely different dust attenuation optical depths, even though their dust-free spectral energy distributions are the same (modulo a mass scaling factor). We assume here for simplicity that the dust attenuation optical depth of a galaxy does not depend on other global galaxy parameters, such as the age , the specific star formation rate and the gas metallicity . We therefore write the transmission function of the neutral ISM in equations (2.1)–(2.2) as simply a function of stellar age ,
| (2.4) |
In the ISM, stars are born in giant molecular clouds, which dissipate on a time-scale of the order of 10 Myr (e.g., Blitz & Shu 1980; Kawamura et al. 2009). Thus the emission from stars younger than this time-scale and from the photoionized gas is more attenuated than that from older stars. We account for this effect using the simple dust model of Charlot & Fall (2000), who express the transmission function of the neutral gas as333The function denoted here by is equivalent to the function defined by equation (6) of Charlot & Fall (2000), for in their notation.
| (2.5) |
Here is the ‘effective absorption’ (or attenuation) optical depth of the dust seen by stars of age . This represents the average absorption of photons emitted in all directions by stars in all locations within the galaxy, including the effects of scattering on the path lengths of the photons before they are absorbed. Following Charlot & Fall (2000), we write
| (2.6) |
where and are the effective absorption optical depths of the stellar birth clouds and the ambient (i.e. diffuse) ISM, respectively. We note that, since the intrinsic spectral energy distributions of young and old stars evolve in time, equation (2.6) implies that the global attenuation curve of a galaxy containing several generations of stars is complicated function of galaxy age, even though is a simple function of (see, e.g., fig. 5 of Charlot & Fall 2000).
We must also specify the dependence of and on wavelength. For stellar birth clouds, we adopt a simple power-law of index appropriate for optically thick clouds with dust properties in the middle range of the Milky Way, the Large and the Small Magellanic Clouds (da Cunha et al. 2008). In the ambient ISM, the shape of the effective absorption curve is more uncertain, as the spatial distribution of dust relative to the stars can vary widely from galaxy to galaxy. Also, while represents an average optical depth along rays emanating in all directions from all stars, in practice, the attenuation will depend to some degree on the angle under which a galaxy is observed. Thus we write
| (2.7) |
| (2.8) |
In these expressions, is the total effective V-band absorption optical depth of the dust seen by young stars inside birth clouds, and is the fraction of this contributed by dust in the ambient ISM. A value of around 0.3 and a typical slope in equation (2.8) account remarkably well for several observed mean relations between the ultraviolet, optical and infrared properties of nearby galaxies (Charlot & Fall 2000; Kong et al. 2004; Salim et al. 2007; da Cunha et al. 2008; Wild et al. 2011a). More refined investigations using sophisticated dust models suggest that, in detail, the attenuation curve should flatten when the optical depth increases (Pierini et al. 2004; Tuffs et al. 2004; Rocha et al. 2008). This is supported by the typically greyer optical attenuation curves observed in nearby edge-one galaxies compared to face-on ones (Wild et al. 2011b). A recent analysis shows that the trend favored by current models and observations can be reasonably well approximated by a simple expression of the slope of the attenuation curve of the form
| (2.9) |
with a scatter of about 20 percent at fixed (Chevallard et al., in preparation).
To compute in equations (2.1)–(2.2), we therefore proceed as follows. We first draw between 0.01 and 4 from the probability density function , which is approximately uniform over the range from to and drops to zero at (see Fig. 4e below). We further draw from a uniform prior distribution between 0.1 and 0.7, and we draw uniformly over an interval centred on the mean value predicted by equation (2.9). Then, we report the selected , and in equations (2.4)–(2.8). This prescription accounts for a much broader range of plausible dust attenuation laws than the simple recipes usually adopted in galaxy spectral analyses (e.g., Kauffmann et al. 2003a; Brinchmann et al. 2004; Cid Fernandes et al. 2005; Panter et al. 2007; Wuyts et al. 2009). We therefore expect larger typical uncertainties arising from attenuation by dust than in these previous studies.
2.3 Library of galaxy spectral energy distributions
We use the library of star formation and chemical enrichment histories described in Section 2.1 and the spectral models described in Section 2.2 to simulate a large library of galaxy spectral energy distributions. This will be used in the remainder of this paper to assess the retrievability of galaxy physical parameters from various types of observations. To ensure that all kinds of spectral energy distributions are properly sampled, for each of the 500,000 star formation and chemical enrichment histories in the original library, we draw 10 different realizations of the evolutionary stage (and hence of the parameter ) and, for star-forming galaxies, of the current physical properties (parameters , , , , and ), as summarized in Table 1. The final library therefore contains 5 million models, which we can use to generate catalogs of galaxy spectra.
| Parameter | Description | Range | Probability Density Function |
|---|---|---|---|
| Specific star formation rate | |||
| Metallicity of the star-forming gas | uniform | ||
| Zero-age ionization parameter | uniform | ||
| Dust-to-metal ratio in the ionized gas | uniform | ||
| Total -band attenuation optical depth of the dust | |||
| Fraction of contributed by dust in diffuse ISM | uniform | ||
| Slope of the attenuation curve in the diffuse ISM | uniform |
In the present study, we focus primarily on the rest-frame optical properties of galaxies. Our main goal is to compare the constraints that can be derived on galaxy physical parameters from different types of observations in this wavelength range. At wavelengths between 3525 and 7500 Å, the stellar population spectra computed using the models presented in Section 2.2.1 have a native spectral resolution of 2.3 Å (full width at half-maximum, hereafter FWHM), corresponding to a resolving power at 5000 Å (the resolution is coarser outside this wavelength range). This allows us to investigate the retrievability of galaxy physical parameters from 4 different types of observations at optical wavelengths:
-
•
Medium-resolution spectroscopy (=3600–7400 Å). We adopt a fiducial resolution of 5 Å FWHM, corresponding to at Å, and a fixed pixel size of 2.5 Å.
-
•
Low-resolution spectroscopy (=3600–7400 Å). We adopt a fiducial resolution of 50 Å FWHM, corresponding to at Å, and a fixed pixel size of 25 Å.
-
•
Equivalent-width measurements of strong emission lines. We also investigate the constraints set purely by the equivalent widths of the following emission lines, at both low and medium spectral resolution: ; H; , ; ; H; ; and . An advantage of equivalent widths is that they can provide useful information even in spectra which are not flux-calibrated.
-
•
Broadband photometry. We adopt the SDSS filter response functions.
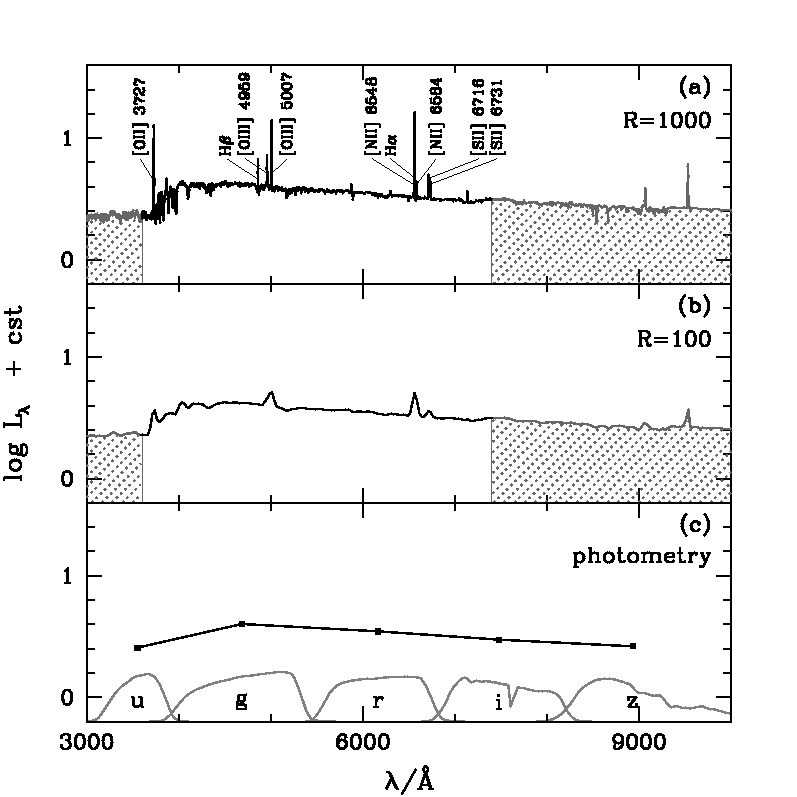
As an example, Fig. 3 shows the spectral energy distribution of the same model galaxy as in Fig. 1 at the age of 8.4 Gyr (with current physical parameters resampled using the distributions in Table 1), computed alternatively at medium (panel a) and low (panel b) spectral resolution and convolved with the SDSS filter response functions (panel c).
2.4 Retrievability of galaxy physical parameters
The galaxy spectral library generated in the previous section can be used to assess the retrievability of physical parameters from different types of observations. To achieve this, we first draw a random subsample of 10,000 spectral energy distributions from the library, to which we apply artificial noise to mimic true observations. For low- and medium-resolution spectroscopy, we apply noise independent of wavelength (i.e. white noise), parametrized in terms of the median S/N per pixel, . We consider the cases and 20 (for reference, the stellar population spectra computed using the models presented in Section 2.2.1 have a native of about 95). For multiband photometry, instead, we take the signal-to-noise ratio to be the same in all wavebands ( or 30). In the following, we refer to this subsample of 10,000 noisy spectral energy distributions as ‘pseudo-observations’, and to the 4,990,000 remaining spectral energy distributions in the library as simply ‘models’.
We use a Bayesian approach to quantify the accuracy to which several physical parameters of these pseudo-galaxies can be retrieved from different types of observables. The likelihood of the th model, noted , given the spectral energy distribution of a pseudo-galaxy can be written
| (2.10) |
where and are the spectral energy distributions (i.e., either the spectral flux density at the th wavelength, or the equivalent width of the th emission line, or the flux in the th photometric band; see Section 2.3) of the pseudo-galaxy and the th model, respectively, is the uncertainty in corresponding to the adopted signal-to-noise ratio, and
| (2.11) |
is the model scaling factor that maximizes (this parameter is unity in the case of scale-free equivalent widths). In practice, in the case of medium-resolution spectroscopy, the summation on the right-hand side of expression (2.10) extends over 1520 wavelength points and hence generally yields values greater than 2000, even for a good-fit model.444We note that only a small contribution to these high values arises from our neglect of intrinsic correlations between spectral pixels in equation (2.10). A detailed investigation reveals that such correlations are significant only for pixels associated with emission lines, which reflects the fact that all emission lines arise from the same ionizing radiation. We have used a test sample of 3000 pseudo-galaxies to check the effect of accounting for pixel-to-pixel correlations on the calculation of model likelihoods. This requires the introduction of the covariance matrix in equation (2.10) and is computationally very demanding. The result is a negligible effect on the computed model likelihoods. Hence equation (2.10) should be appropriate to compute model likelihoods. The absolute likelihood in this case cannot be evaluated numerically, as it is always rounded to 0. For medium-resolution spectroscopy, therefore, we rather compute the probability of the th model relative to the best-fitting model, noted ,
| (2.12) |
We have checked that in the case of low-resolution spectroscopy, where both and can be evaluated numerically, the likelihood distributions of galaxy physical parameters obtained using equations (2.10) and (2.12) are similar.
In this paper, we focus on the retrievability of 6 physical parameters from the observed spectral energy distributions of galaxies:
-
•
the observer-frame absolute -band (stellar) mass-to-light ratio, . This is the ratio of the galaxy stellar mass to the absolute luminosity in the observed band;
-
•
the fraction of the current galaxy stellar mass formed during the last 2.5 Gyr, ;
-
•
the specific star formation rate, ;
-
•
the gas-phase oxygen abundance in units of , where O/H is the abundance by number of oxygen relative to hydrogen. In the models of nebular emission adopted in Section 2.2.2, the gas-phase oxygen abundance corresponding to solar metallicity () is 8.81, 8.73 and 8.63 for dust-to-metal ratios , 0.3 and 0.5, respectively.
-
•
the total effective -band absorption optical depth of the dust, (Section 2.2.3);
-
•
the fraction of arising from dust in the ambient ISM, .
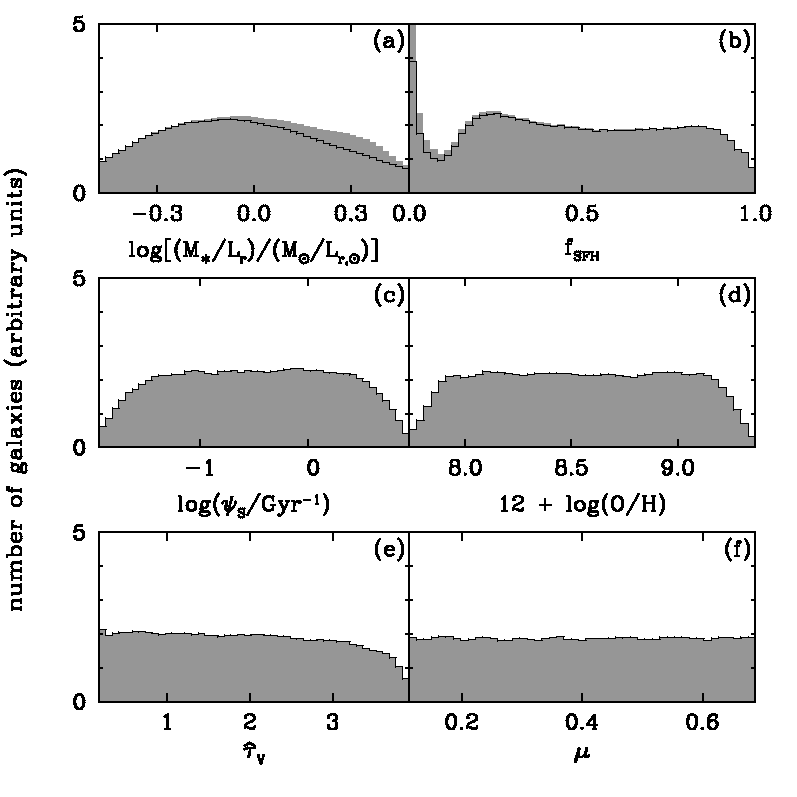
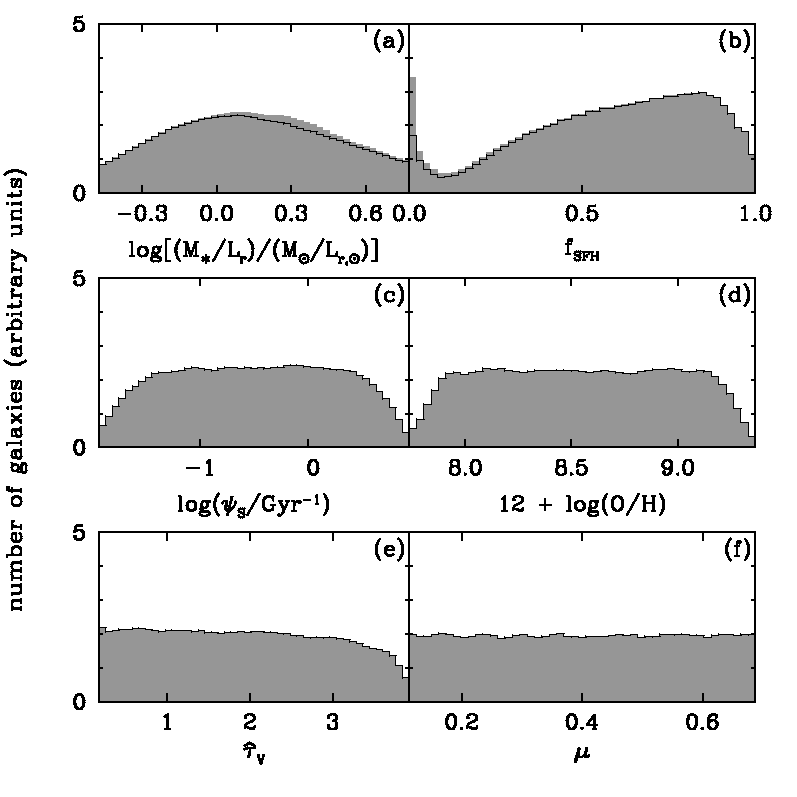
Fig. 4 shows the prior distributions of these parameters in the galaxy spectral library generated in Section 2.3. In each panel, the shaded histogram shows the distribution including all galaxies, while the solid histogram shows the contribution by star-forming galaxies alone. Galaxies without star formation have typically high in Fig. 4a and in Fig. 4b. These galaxies are off scale (at ) in Fig. 4c. They do not contribute to the histograms in Figs 4d–f, which pertain to interstellar parameters. As emphasized in Sections 2.1 and 2.2, the prior distributions of Fig. 4 are as flat as possible to avoid unwanted biases in the retrieval of physical parameters from observed spectral energy distributions of galaxies. This choice is motivated by the desire to make the spectral library appropriate for the analysis of galaxies in wide ranges of physical properties (we note that the finite extent of the prior distributions in Fig. 4 could still bias analyses of galaxies with extreme parameters). Alternative prior distributions can be designed to help reduce the uncertainties in the parameters derived for galaxies with known specific physical properties (e.g., actively star-forming, early-type, metal-poor). We return to the influence of prior distributions on parameter determinations in Section 4.2 below, where we investigate the results obtained using the library of galaxy star formation and chemical enrichment histories derived from the original semi-analytic recipes of De Lucia & Blaizot (2007) .
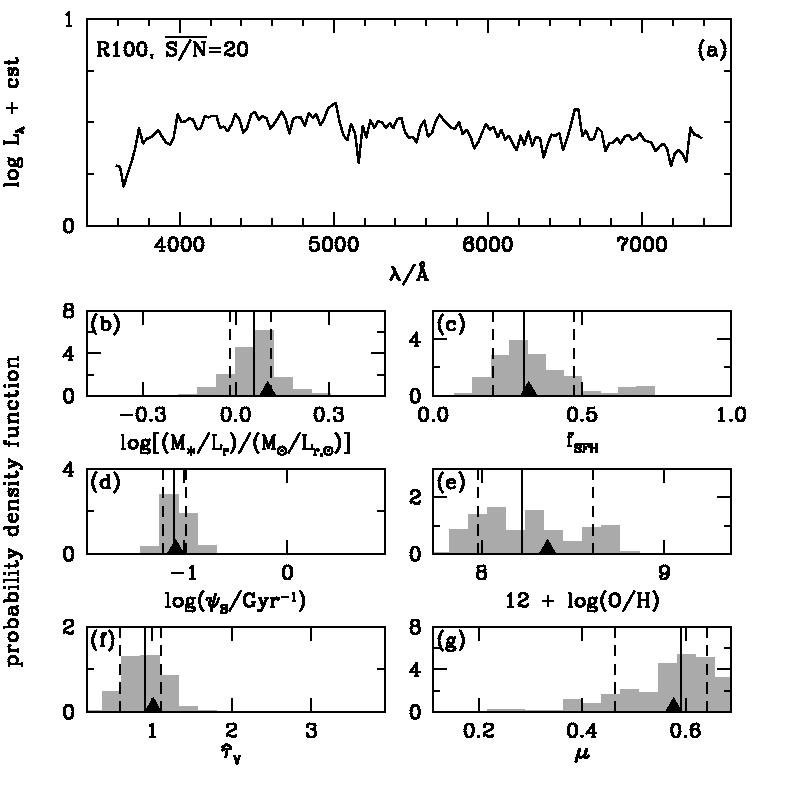
In Fig. 5, we show examples of the probability density functions (likelihood distributions) of physical parameters retrieved, using equations (2.10)–(2.11) and the prior distributions of Fig. 4, from the low-resolution, high-S/N spectrum of a pseudo-galaxy in our library. This pseudo-observation was obtained by adding artificial noise () to the model spectrum of Fig. 3b. We take the ‘best estimate’ of each parameter in Fig. 5 to be the median of the retrieved probability density function and the associated ‘uncertainty’ to be half the 16th–84th percentile range (this would be equivalent to the range in the case of a Gaussian distribution). To quantify potential biases in the retrieved likelihood distribution, we further define the ‘accuracy’ as the absolute difference between the retrieved best estimate and true parameter value. In this example, all the parameters are well retrieved. The success in recovering the fraction of intermediate-age stars (Fig. 5c) and the interstellar parameters , and (Figs 5e–5g) is remarkable. It is the first illustration of the power of our approach to exploit strong absorption- and emission-line signatures in noisy, low-resolution spectra. We examine this property in detail in Section 3.2 below.
It is important to stress that the approach adopted here to assess the retrievability of galaxy physical parameters from different types of observations, while idealized, is as realistic as can be achieved using modern techniques. Pseudo-observations are required to test the retrievability of physical parameters from observables, because the physical parameters of observed galaxies cannot be known a priori. The fact that we draw pseudo-observations from the same spectral library as the models used to analyze them makes the constraints derived on the retrievability of physical parameters optimistic: our results correspond to the best possible case in which the models are a realistic representation of true galaxies. In Section 4 below, we also illustrate the constraints that can be derived by applying our approach to interpret a sample of observed galaxy spectra.
3 Constraints on galaxy physical parameters from different types of observations
In this section, we use the modeling approach described in the previous section to quantify the accuracy to which physical parameters of galaxies can be retrieved from different types of observations. We focus on the retrievability of the 6 parameters introduced in Section 2.4: the observer-frame absolute -band stellar mass-to-light ratio, ; the fraction of the current galaxy stellar mass formed during the last 2.5 Gyr, ; the specific star formation rate, ; the gas-phase oxygen abundance, ; the total effective -band absorption optical depth of the dust, ; and the fraction of arising from dust in the ambient ISM, . In Section 3.1 below, we first examine the constraints set on these parameters by multi-band photometric observations. We consider the influence of several factors, such as the signal-to-noise ratio, the number of photometric bands, the contamination of broad-band fluxes by nebular emission lines and the uncertainty introduced by the lack of redshift information. We find that photometric observations can provide useful constraints mainly on and . Then, in Section 3.2, we quantify the improvement that can be achieved in the constraints on all parameters by appealing to different types of spectroscopic observations.
3.1 Constraints from multi-band photometry
3.1.1 Nearby galaxies
We first explore the extent to which physical parameters of nearby galaxies can be constrained using 5-band photometry. We extract 10,000 spectral energy distributions from the library assembled in Section 2.3 to compute pseudo-observations of galaxies in these bands, as described in Section 2.4. We adopt for the moment a signal-to-noise ratio in all bands and place all spectral energy distributions at . The rest of the 5 million models in the library allow us to retrieve likelihood distributions of , , , , and for each of these 10,000 pseudo-galaxies, by means of equations (2.10)–(2.11). In the following, we refer to this setting as the ‘standard’ case.
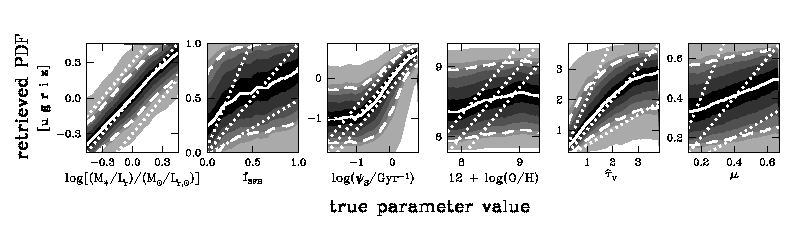
Fig. 6 summarizes the constraints that can be set on the physical parameters of nearby galaxies using high-quality, 5-band photometry. For each parameter, we plot the average probability density function retrieved from the above analysis as a function of true parameter value. This average was obtained by coadding and then renormalizing the probability density functions retrieved in narrow bins of true parameter value for the 10,000 pseudo-galaxies in our sample. The solid line in each panel of Fig. 6 locates the median (i.e. best estimate; Section 2.4) of the average likelihood distribution in each bin, the dashed lines the 16th and 84th percentiles (68-percent confidence interval) and the outer edges of the lightest grey level the 2.5th and 97.5th percentiles (these would correspond to the levels in the case of a Gaussian distribution). For reference, 3 dotted lines indicate the identity relation and deviations by a factor of 2 (dex) between the retrieved and true parameters.
Fig. 6 shows that the -band stellar mass-to-light ratio of nearby galaxies can be reasonably well constrained using 5-band photometry. The retrieved best estimate is in excellent agreement with the true parameter value over most of the explored range, and the associated uncertainty, defined as half the 16th–84th percentile range (Section 2.4), is only about 0.19 dex (this number would be larger if we allowed for IMF variations). At the extremities of the range, the relative deficiency of galaxies with very small and very large in the spectral library (Fig. 4a) slightly biases the retrieved likelihood distributions toward intermediate values. Fig. 6 also shows that, in contrast to , the fraction of stellar mass formed in the past 2.5 Gyr cannot be well retrieved from 5-band photometry. This is because the strong absorption features of intermediate-age stars have a negligible influence on broadband fluxes. The signatures of on broadband colours are otherwise difficult to disentangle from those of stellar metallicity and attenuation by dust.
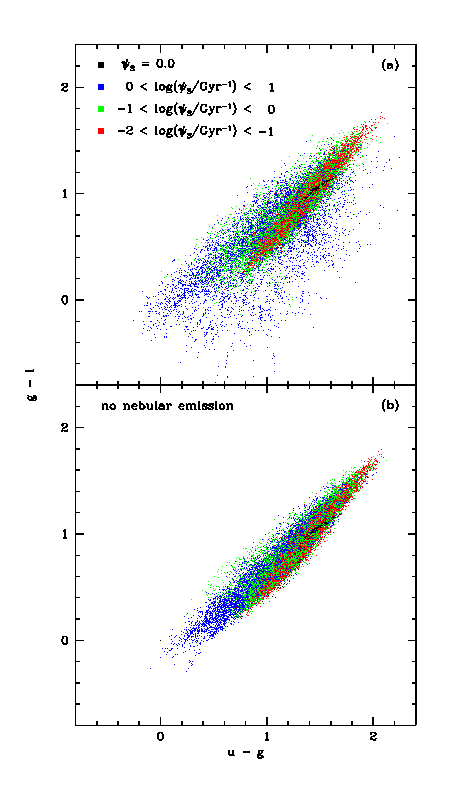
The constraints on specific star formation rate from 5-band photometry in Fig. 6 are meaningful only for actively star-forming galaxies, i.e. for , and the associated uncertainty is at best 0.30 dex. In such galaxies, the contamination of broadband fluxes by strong emission lines produces identifiable signatures ([O ii] in the band; H and [O iii] in the band; H, [N ii] and [S ii] in the band). Even then, the similar colours of galaxies with both low and and those with both high and give rise to long tails toward low in the retrieved likelihood distributions. This degeneracy is illustrated by the overlap of galaxies with different in Fig 7a, which shows the versus colours of a subset of 50,000 models in the spectral library. Together with the fact that, even in galaxies with strong emission lines, broadband colours do not allow the distinction between different line ratios, this also implies poor constraints on the gas-phase oxygen abundance and the dust parameters and in Fig. 6. The retrieved likelihood distributions of these parameters are largely driven by the prior distributions of Fig. 4.
The results of Fig. 6 are consistent with those of Wuyts et al. (2009), who explored the recovery of physical parameters from broadband spectral energy distributions of model galaxies taken from hydrodynamical merger simulations. Our study differs from theirs in that we consider much wider ranges of star formation and chemical enrichment histories and dust properties to retrieve likelihood distributions of physical parameters. Also, Wuyts et al. (2009) neglect the contribution by nebular emission to broadband fluxes and include 11 bands to sample the rest-frame spectral energy distributions of galaxies over a wide range of wavelengths, between roughly 0.15 and 3 m. Finally, they analyze galaxy simulations in the redshift range , which span a much narrower range of stellar population ages than the pseudo-galaxies in our sample. For all these reasons, Wuyts et al. (2009) find smaller typical uncertainties in the retrieved stellar mass (dex) and star formation rate (dex) than can be inferred from the constraints on and in Fig. 6. They also find much tighter constraints on the dust attenuation optical depth (). Wuyts et al. (2009) note that using simple (single-burst, constant and exponentially declining) star formation histories to fit the results of more realistic hydrodynamical merger simulations can induce significant deviations between the retrieved maximum-likelihood and true parameters values. Our adoption of the sophisticated galaxy spectral library assembled in Section 2.3 should minimize this type of limitation when applying our approach to the interpretation of real observations (Section 4).
We now return to our investigation and examine the sensitivity of the results of Fig. 6 to the adopted signal-to-noise ratio, the photometric wavelength coverage and the inclusion of nebular emission when interpreting broadband observations of galaxies. To quantify potential differences in the retrieved likelihood distributions relative to the standard case, we define the improvement factor as the ratio
| (3.13) |
This quantity can be computed for any true parameter value. It exceeds unity when the constraints are tighter (i.e. the uncertainty smaller) than in the standard case. We further define the gain in accuracy as the difference
| (3.14) |
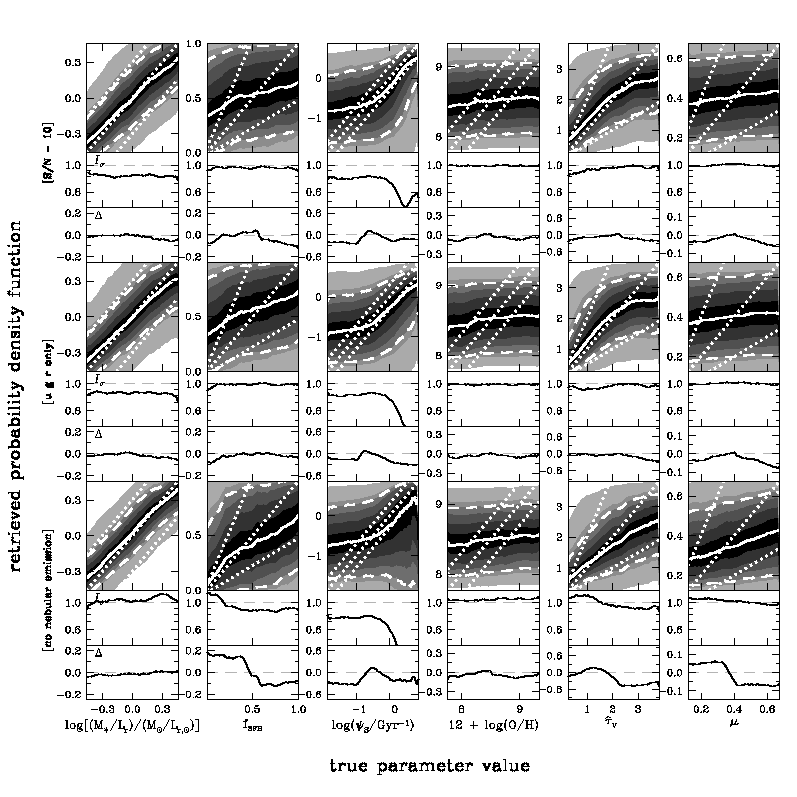
This quantity is positive when the retrieved best estimate is more accurate (i.e. the absolute difference between the retrieved best estimate and true parameter value smaller) than in the standard case. In Fig. 8, we show the analog of Fig. 6 for 3 distinct alternatives to the standard case: adopting a signal-to-noise ratio instead of 30 (top row); removing the constraints from the reddest 2 photometric bands, and (middle row); and not including nebular emission in the model library used to analyze pseudo-observations (bottom row). In all cases, we show at the bottom of each panel the improvement factor and the gain in accuracy as a function of true parameter value.
Fig. 8 (top row) shows that reducing the signal-to-noise ratio from to 10 makes the uncertainty in the retrieved larger by about 15 percent and, at the extremities of the explored range, the accuracy between 10 and 25 percent worse. A more dramatic difference relative to the standard case arises from the loss of the emission-line signal for actively star-forming galaxies. This causes a sharp drop in at high , implying poor constraints on the specific star formation rate over the entire explored range. Interestingly, Fig. 8 (middle row) shows that the effect of removing the - and -band constraints at is very similar to that of lowering the signal-to-noise ratio of 5-band photometry. This is because the signatures of dust attenuation can be less well delineated from those of star formation from the ugr colours alone, even if the contamination of these broadband fluxes by strong emission lines can in principle be detected at high S/N (Fig. 6). As expected, the other parameters, , , and , can be even less well retrieved than in the standard case when the signal-to-noise ratio is lowered and when the - and -band constraints are removed.
It is also of interest to quantify the importance of including nebular emission when interpreting broadband observations of galaxies. A comparison between the top and bottom panels of Fig. 7 shows that the contribution by [O ii] emission to the -band flux and that of H and [O iii] emission to the -band flux can change the broadband and colours of galaxies with by several tenths of a magnitude. In Fig. 8 (bottom row), we show the results of attempting to interpret the same pseudo-observations as in Fig. 6 (which include the contribution by nebular emission to the fluxes) using a spectral library which neglects nebular emission. This spectral library was constructed in the same way as that assembled in Section 2.3, but ignoring the prescription for nebular emission in Section 2.2.2. The retrieved in this case is very similar to that obtained in the standard case, except for the slightly worse accuracy () at very low , consistent with the contamination of the -band flux by H, [N ii] and [S ii] emission in actively star-forming galaxies. As anticipated from Fig. 7, models without nebular emission do not sample broadband colours well enough to allow the retrieval of meaningful constraints on for actively star-forming galaxies. The other parameters, , , and , are as poorly constrained as in the standard case. We conclude from Fig. 8 that high S/N, good wavelength coverage and accounting for nebular emission are all important to tighten the constraints on specific star formation rate from broadband observations of galaxies, while the inclusion of nebular emission is less crucial to constrain stellar mass-to-light ratio.
3.1.2 Galaxies at unknown redshift
We have tested so far the retrievability of physical parameters from 5-band photometry only for nearby galaxies. We now wish to explore the constraints achievable for galaxies at unknown redshift. Ilbert et al. (2006) have shown that redshift can be best estimated from 5-band photometry out to . Photometric redshift measurements of more distant galaxies require observations at longer wavelengths (e.g. Ilbert et al. 2009), which are beyond the scope of the present paper (see Pacifici et al., in preparation). We therefore restrict ourselves here to the retrievability of physical parameters of galaxies from 5-band photometry at redshifts in the range .
We use an approach similar to that described in Section 2.3 to generate a new library of 5 million spectral energy distributions of galaxies at random redshifts between 0 and 1. For each of the 500,000 star formation and chemical enrichment histories in the original library of Section 2.1, we first draw an observation redshift between 0 and 1. Then, we proceed as outlined in Section 2.3 and draw 10 different realization of the evolutionary stage (i.e. galaxy age) at which the galaxy is looked at (uniformly in redshift between and , to better sample the parameter ; see Section 2.1) and, for star-forming galaxies, of the current parameters , , , , and (using the distributions in Table 1). The resulting spectral library contains about 8 percent early-type galaxies, i.e. slightly less than the 10 percent in the library assembled in Section 2.3. Fig. 9 shows the prior distributions of the physical parameters , , , , and in this library. As in Fig. 4, in each panel, the shaded histogram shows the distribution including all galaxies, while the solid histogram shows the contribution by star-forming galaxies alone. The prior distribution of the observer-frame absolute -band stellar mass-to-light ratio in Fig. 9a reaches larger values than in Fig. 4a because of the contribution by (dusty) high-redshift galaxies with large K corrections. The early evolutionary stage of high-redshift galaxies also implies a larger typical in Fig. 9b than in Fig. 4b. By construction, the distributions of the current physical parameters , , and are the same in Figs 4 and 9 (from Table 1).
By analogy with Section 3.1.1, we generate pseudo-observations in the photometric bands of 10,000 galaxies in the new library. These pseudo-observations sample different wavelength ranges of the rest-frame spectral energy distributions of galaxies at different redshifts, from roughly 3000–10,000 Å at to 1500–5000 Å at . We consider both high-quality () and low-quality () observations. Using the rest of the 5 million models in the library, we can retrieve likelihood distributions of for each of the 10,000 pseudo-galaxies, as well as likelihood distributions of , , , , and .
In Fig. 10a, we plot the distribution of the difference between the retrieved best estimate (i.e. median) and true value of , in units of , for the 10,000 pseudo-galaxies in our sample. The results for (shaded histogram) are in remarkable agreement with the Gaussian uncertainty in this quantity quoted by Ilbert et al. (2006), who analyzed CFHTLS () photometry of about 3000 galaxies with spectroscopic redshifts between 0.2 and 1.5 (dashed line). For , the retrieved best estimate of in Fig. 10a remains in good general agreement with the true value (solid histogram). To better illustrate the origin of the histograms in Figs 10a, we show in Figs 10b and 10c the detail of the average retrieved probability density functions as a function of for and 10, respectively.
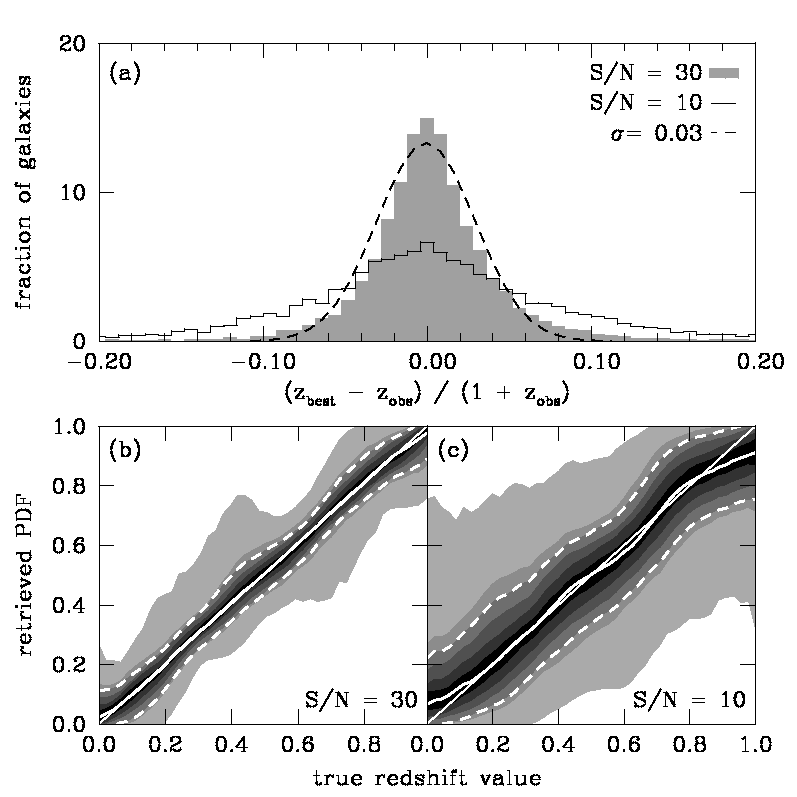
The retrieved probability density functions of the other physical parameters of interest to us are difficult to interpret when averaged over galaxies at all redshifts between 0 and 1, because of the different effects impacting the recovery of parameters in different redshifts ranges. For this reason, it is more instructive to explore the retrievability of , , , , and for galaxies in different redshift ranges, for example, and . We redraw 10,000 spectral energy distributions in each of these redshift ranges from the new galaxy spectral library, which we use to generate pseudo-observations in the photometric bands, for . As before, we assume that the redshift of a galaxy is unknown a priori and use all models at redshifts between 0 and 1 in the spectral library to retrieve likelihood distributions of physical parameters. According to Fig. 10b, can be retrieved with an uncertainty of roughly 0.05 in both redshift ranges at the adopted signal-to-noise ratio.
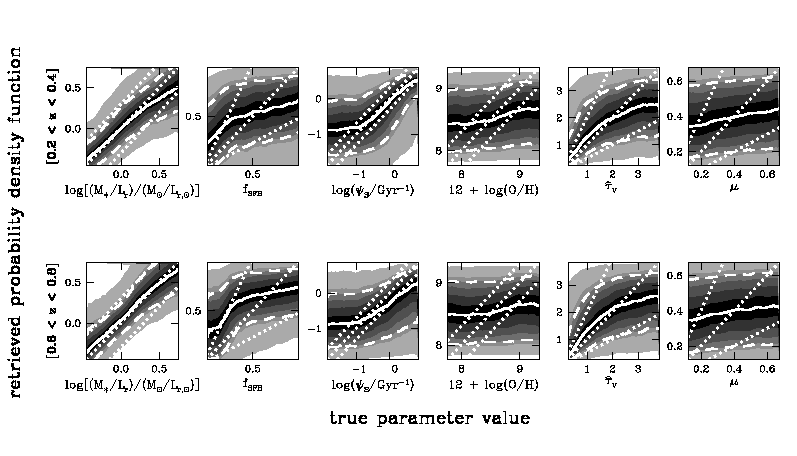
Fig. 11 shows the average probability density functions of physical parameters retrieved in this way for galaxies at redshifts (top row) and (bottom row). At low redshift, the constraints are similar to those obtained in Fig. 6 for galaxies at . The main difference is the extension of the probability density functions to larger values, induced by the tail of high-redshift galaxies with large K corrections in the prior distribution (Fig. 9a). This tends to worsen the typical uncertainty in (from 0.19 to 0.22 dex) over the range sampled by Fig. 6, i.e. for , while at larger , the smaller number of models implies a significant bias in the retrieved likelihood distribution. Another noticeable difference caused by the absence of redshift information between Fig. 11 (top row) and Fig. 6 is the slightly worse uncertainty and bias in the retrieved specific star formation rate of actively star-forming galaxies. Fig. 11 (bottom row) also shows that, at higher redshift, the loss of H information further worsens estimates in these galaxies. The constraints on are similar to those for low-redshift galaxies. In both redshift ranges in Fig. 11, the parameters , , and are as poorly constrained as for galaxies in Fig. 6.
We conclude that high-quality photometry in the bands can provide useful constraints on the mass-to-light ratio and specific star formation rate of galaxies, especially at low redshift, but less so on the recent history of star formation and the enrichment in metals and dust of the interstellar medium. The lack of redshift information can significantly weaken these constraints.
3.2 Spectroscopic constraints
We now investigate how the constraints obtained above from multi-band photometry on the parameters , , , , and can be improved by appealing to different types of spectroscopic observations. In Section 3.2.1 below, we first show that the equivalent widths of strong optical emission lines alone can provide useful clues about the specific star formation rate and enrichment of the interstellar medium in star-forming galaxies. Then, in Sections 3.2.2 and 3.2.3, we explore in detail the constraints retrievable from low- and medium-resolution spectroscopy, exploiting the ability with our approach to interpret simultaneously the stellar and nebular emission from galaxies. Throughout this section, we assume that the galaxies have well-determined spectroscopic redshifts and perform all calculations at rest-frame wavelengths in the range between 3600 and 7400 Å (Fig. 3).
3.2.1 Equivalent widths of strong optical emission lines
The equivalent widths of optical emission lines reflect the ratio of young stars, which produce ionizing radiation, to older stars, which dominate the optical continuum radiation. These equivalent widths should therefore provide valuable information about the specific star formation rate and, if several lines are available, the gas-phase oxygen abundance and dust attenuation optical depth in star-forming galaxies. Since line equivalent widths do not provide any information about the absolute stellar continuum emission, they cannot be used to constrain the parameters nor . Similarly, line equivalent widths should not provide any useful constraint on the dust attenuation optical depth in the ambient ISM, , which affects in similar ways emission lines emerging from stellar birth clouds and the continuum radiation from old stars (equation 2.8). We therefore focus here on the retrievability of the parameters , and the dust attenuation optical depth in stellar birth clouds, , from observations of the equivalent widths of strong optical emission lines in star-forming galaxies.
To proceed, we select a sample of 10,000 spectral energy distributions from the library assembled in Section 2.3 to compute pseudo-observations of the net emission equivalent widths of the following emission lines: ; H; ; ; ; H; ; and . We consider both the cases of low (50 Å FWHM; at Å) and medium (5 Å FWHM; at Å) spectral resolution and fix the median signal-to-noise ratio per pixel at . In the case of low spectral resolution, we treat as single emission features the line blends: ; and . We also require that, at a given spectral resolution, the net emission equivalent widths of all features be measured at better than the 3 level.555To compute net emission equivalent widths in low-resolution (medium-resolution) spectra, we measure the continuum level as follows. We first de-spike the spectrum with a 9-pixel (11-pixel) median smoothing. We then mask 5-pixel-wide (9-pixel-wide) regions centred on the emission lines, through which we interpolate the spectrum. Finally, we smooth the spectrum again and adopt the result as the continuum level. We apply the same requirement to the model spectra used to compute likelihood distributions of , and for each pseudo-galaxy. These requirements are filled by roughly 2.7 million out of the 5 million original models at low resolution, and 1.7 million models at medium resolution (where lines are not blended).
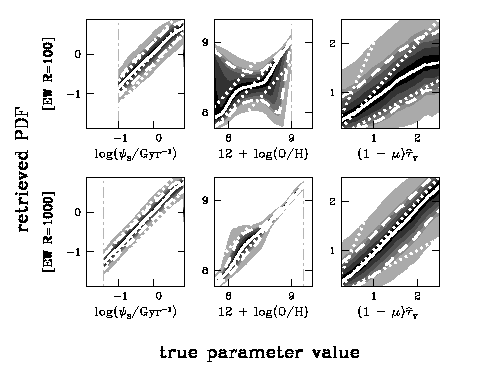
Fig. 12 shows the average retrieved probability density functions of , and for the 10,000 star-forming pseudo-galaxies in our sample, for low (top row) and medium (bottom row) spectral resolution. We find that, as expected, the equivalent widths of strong optical emission lines set tight constraints on the specific star formation rate, . The uncertainty in the retrieved best estimate is only slightly worse at low (0.23 dex) than at medium (0.18 dex) spectral resolution. An advantage of medium spectral resolution is the possibility to constrain in more quiescent star-forming galaxies than at low spectral resolution, for fixed . According to Fig. 12, for , the limit under which the equivalent widths of all lines of interest cannot be measured at the 3 level is at and at .
Fig. 12 (bottom row) further shows that, at medium spectral resolution, the equivalent widths of optical emission lines provide tight constraints on the gas-phase oxygen abundance in star-forming galaxies. The uncertainty in the retrieved best estimate of is only 0.02 at the high-metallicity end. It reaches 0.17 at low , because the rise in intrinsic emission-line intensity with decreasing metallicity (e.g., figure 4d of Charlot & Longhetti 2001) allows the inclusion of more dusty galaxies in the likelihood distributions. At low spectral resolution, the blending of the H and [N ii] lines worsens considerably these constraints (Fig. 12, top row). Moreover, the drop in emission-line intensity with increasing metallicity implies that can be retrieved in more metal-rich galaxies at medium than at low spectral resolution, for fixed . The constraints on the dust attenuation optical depth in stellar birth clouds in Fig. 12 are also much tighter at medium than at low spectral resolution. At low spectral resolution, the median retrieved uncertainty in is only about 20 percent larger than at medium spectral resolution, but the best estimate is much more severely biased toward the prior expectation.
3.2.2 Low-resolution spectroscopy
We now turn to one of the most innovative parts of the present study enabled by the approach developed in Section 2: the retrieval of physical parameters from the simultaneous interpretation of strong absorption and emission features in low-resolution spectral energy distribution of galaxies over the entire rest-wavelength range from to 7400 Å. As before, we extract 10,000 spectral energy distributions from the library assembled in Section 2.3 to compute pseudo-observations of galaxies at the resolution of 50 Å FWHM ( at Å) in this wavelength range. We adopt for the moment a median signal-to-noise ratio per pixel . We use the rest of the 5 million models in the library to retrieve likelihood distributions of physical parameters for each of these 10,000 pseudo-galaxies.
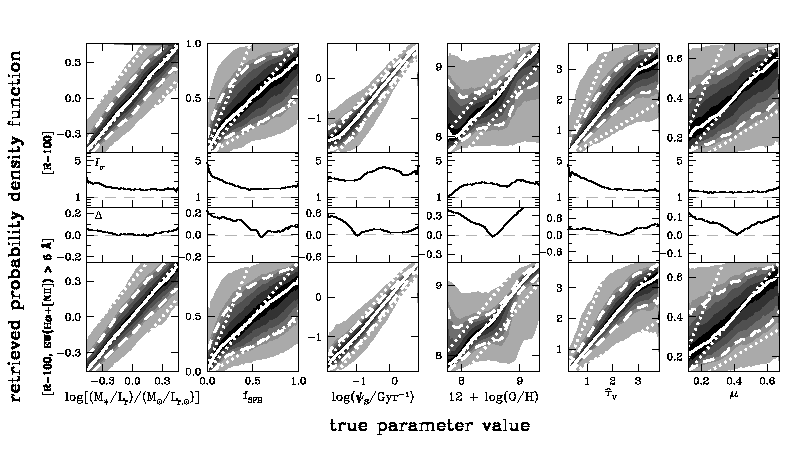
Fig. 13 (top row) shows the average retrieved probability density functions of , , , , and for the 10,000 pseudo-galaxies in our sample. Also shown at the bottom of each panel are the factor of improvement in the retrieved uncertainty, , and the gain in accuracy, , relative to the standard case of Fig. 6 (equations 3.13–3.14). Fig. 13 (top row) reveals that a major improvement of low-resolution spectroscopy over rest-frame photometry is the ability to retrieve meaningful (i.e. unbiased) constraints not only on the stellar mass-to-light ratio and the specific star formation rate, but also on the recent star formation history () and the enrichment of metals and dust in the interstellar medium of galaxies [, and, to a lesser extent, ]. The gain in accuracy () reaches up to 30 percent of the explored dynamic range for , 15 percent for and and up to 20 percent for . This results from the ability to detect and interpret, even at low resolution, the strong Balmer absorption features of intermediate-age stars and the emission-line signatures of interstellar gas. The median uncertainty in the retrieved fraction of current stellar mass formed in the last 2.5 Gyr amounts to about 0.23, that in about 0.28 and that in the total dust attenuation optical depth, , about 0.64. For and , already constrained in a meaningful way by multiband photometry, the improvement in uncertainty relative to the standard case amounts to a factor () of between 1.5 and 3.
A more in-depth investigation reveals that, in all panels in Fig. 13 (top row), the largest uncertainties pertain to galaxies with emission lines too weak to allow a distinction between the signatures of star formation history, metallicity and dust in the spectra. These are mainly galaxies with low specific star formation rate, high metallicity and strong attenuation of emission lines by dust in stellar birth clouds. In this context, it is interesting to explore how much the constraints tighten if we restrict the sample to low-resolution galaxy spectra exhibiting unambiguous emission lines. We appeal again to the library assembled in Section 2.3 to generate a sample of 10,000 pseudo-observations of low-resolution galaxy spectra, for , with the requirement that the net H+[N ii] emission equivalent width be greater than 5 Å (throughout this paper, we adopt the convention of positive equivalent widths for emission lines). Fig. 13 (bottom row) shows that, in this case, the constraints on the interstellar parameters and improve significantly. The corresponding median uncertainties both drop by about 20 percent. The constraints on improve mainly at the low end of the explored range (the uncertainty dropping by about 15 percent at ), where the omission of galaxies with weak emission lines is most significant. The improvement is only marginal for , and , which are constrained primarily by stellar continuum and absorption-line features rather than by nebular emission lines.
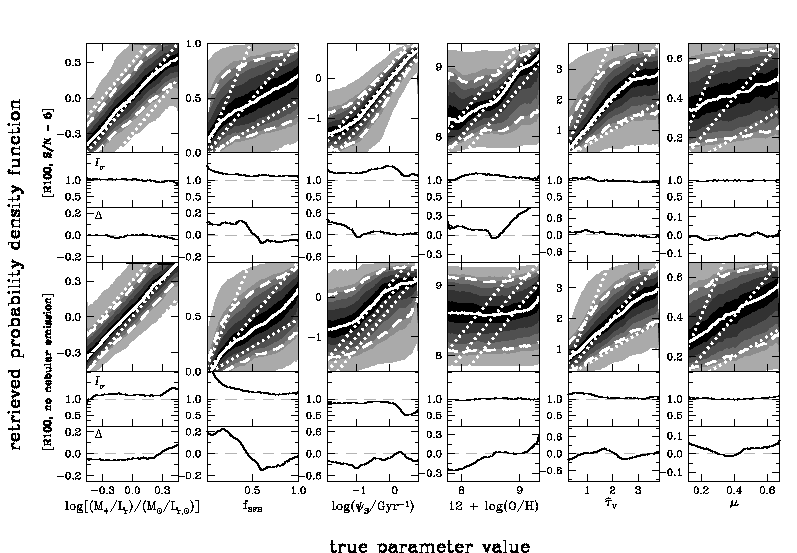
The ability with our approach to exploit strong absorption and emission features in low-resolution galaxy spectra depends critically on the quality of the observations. To illustrate this, we show in Fig. 14 (top row) the analog of Fig. 13 (top row) when adopting a median signal-to-noise ratio per pixel instead of 20. The reduced ability to interpret spectral features at makes the median uncertainties in the different retrieved parameters increase by 30 percent (for , , ) up to 90 percent (for ) relative to the case . It also introduces substantial biases in the retrieved likelihood distributions. A comparison of Fig. 14 (top row) with Fig. 6 reveals that, in fact, low-resolution spectroscopy with over the wavelength range from to 7400 Å provides hardly better constraints on the different parameters than high-quality photometry (as confirmed by the fact that is close to unity and close to zero in Fig. 13, top row). The constraints on and are somewhat tighter because of the influence of actively star-forming galaxies with strong emission lines on the average retrieved probability density functions. The star formation history parameter is only slightly better constrained, as even strong Balmer absorption lines are difficult to interpret at low . The constraints on are as poor as inferred from multiband photometry, reflecting the inability to extract useful information from the H/H ratio in low-quality spectra. In Fig. 14 (top row), the constraints on are actually weaker and more severely biased at the extremities of the explored range than those obtained from rest-frame photometry in Fig. 6. This suggests that high-quality photometry including the near-infrared bands can better constrain galaxy stellar masses than low-resolution optical spectroscopy with .
The inclusion of nebular emission also has a crucial influence on the ability to constrain galaxy physical parameters from low-resolution optical spectroscopy. Fig. 14 (bottom row) shows the results obtained when attempting to interpret the same pseudo-observations as in Fig. 13 (top row; which include nebular emission) with the library of models not including nebular emission already used in Fig. 8 (bottom row).666 To avoid artefacts in the resulting probability density functions, we remove prominent emission lines from the pseudo-galaxy spectra before computing the likelihood of models without nebular emission (equation 2.10). To achieve this, we first measure the continuum level across the whole range from to 7400 Å, as described in footnote 5. Then, we reset to the continuum level the flux of every pixel exceeding the continuum flux by more than 5 times the noise level. In this case, the average retrieved likelihood distributions of all parameters are severely degraded relative to Fig. 13 (top row). In fact, for most parameters, the constraints are worse than those derived in Fig. 6 from high-quality photometry when accounting for the effect of nebular emission on photometric fluxes. Fig. 14 (bottom row) shows that, for example, using models which neglect the contamination of the -band flux by H+[N ii] and [S ii] line emission biases estimates upward for star-forming galaxies. Moreover, ignoring the contamination of stellar Balmer absorption features by nebular emission in low-resolution spectra causes systematic underestimates of in star-forming galaxies. For actively star-forming galaxies, the constraints on in Fig. 14 (bottom row) are weaker than the rough constraints derived in Fig. 6 from the influence of nebular emission on photometric observations. Not surprisingly, models without nebular emission do not allow the extraction of useful constraints on the interstellar parameters , and from low-resolution galaxy spectra.
Hence, we find that important constraints can be obtained on the stellar and interstellar parameters of galaxies from low-resolution spectra at optical wavelengths. This however requires high-quality observations as well as the inclusion of nebular emission in the spectral analysis.
3.2.3 Medium-resolution spectroscopy
Medium-resolution spectroscopy should provide even more insight into the physical properties of galaxies than low-resolution spectroscopy, because composite features such as the [O iii] doublet, the H+[N ii] blend and the [S ii] doublet can be resolved into individual emission lines. To investigate this, we extract 10,000 spectral energy distributions from the library assembled in Section 2.3 and compute pseudo-observations of galaxies at the resolution of 5 Å FWHM ( at Å) over the wavelength range from to 7400 Å. We adopt a median signal-to-noise ratio per pixel . As before, we use the rest of the 5 million models in the library to retrieve likelihood distributions of physical parameters for each of these 10,000 pseudo-galaxies.
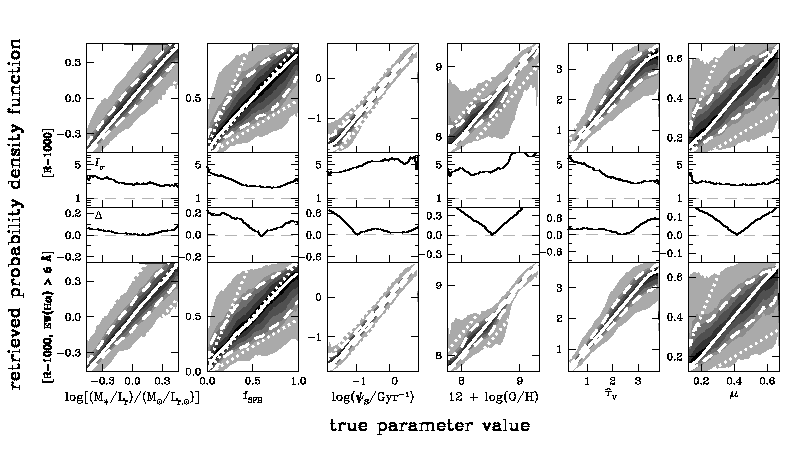
In Fig. 15 (top row), we show the average probability density functions of , , , , and retrieved from the medium-resolution spectra of the 10,000 pseudo-galaxies in our sample. The factor and the gain quantifying the improvements in the retrieved uncertainty and accuracy relative to the standard case of Fig. 6 (equations 3.13–3.14) are also shown at the bottom of each panel. A comparison of Fig. 15 (top row) with Fig. 13 (top row) shows that an increase in spectral resolution by a factor of 10 produces significantly tighter constraints on all parameters. The improvement is most significant for the specific star formation rate, the gas-phase oxygen abundance and the total dust attenuation optical depth, for which the median retrieved uncertainty drops by about 45 percent from low to medium spectral resolution. The gain is more modest, of the order of 25 percent, for , , and . The refined spectral information available at medium resolution also help reduce some biases in the retrieved best estimates of (for young galaxies), (for quiescent star-forming galaxies) and (across most of the explored range) in Fig. 15 (top row) relative to Fig. 13 (top row).
By analogy with Fig. 13, we further show in Fig. 15 (bottom row) the average probability density functions obtained when selecting a sample of 10,000 pseudo-observations of medium-resolution galaxy spectra, for , with the requirement that the net H emission equivalent width be greater than 5 Å. The retrieved likelihood distributions of and are significantly narrower than when including also galaxies with weak emission lines in the sample, with median retrieved uncertainties of about 0.08 for and 0.30 for . As at low spectral resolution, restricting the sample to galaxies with prominent emission lines reduces the uncertainties in mainly at the low end of the explored range. Changes in the retrieved likelihood distributions of , and are marginal, because these parameters are constrained primarily by stellar continuum and absorption-line features.
We have also investigated how the constraints obtained in Fig. 15 from the analysis of medium-resolution galaxy spectra depend on the assumed signal-to-noise ratio of the observations and the inclusion of nebular emission in the modeling (not shown). We find that adopting a median signal-to-noise ratio per pixel instead of 20 for the 10,000 pseudo-galaxy spectra makes the median retrieved uncertainties in most parameters increase by 30 to 50 percent (only 15 percent for ) relative to Fig. 15 (top row). The biases in the retrieved best estimates are less severe than found in Fig. 14 (top row) at low spectral resolution. As expected from Fig. 14 (bottom row), accounting for nebular emission also has a critical influence on the retrievability of the specific star formation rate and the interstellar parameters from medium-resolution galaxy spectra. It is worth pointing out that, at medium (and high) spectral resolution, prominent nebular emission lines can be excised from the spectra and analyzed separately from the stellar continuum and absorption-line signatures if no tool is available to analyze the stellar and nebular emission simultaneously (e.g., Kauffmann et al. 2003a; Brinchmann et al. 2004; Gallazzi et al. 2005). This is not the case at low spectral resolution, where the analysis of the stellar and nebular emission must be combined to obtain meaningful constraints on galaxy physical parameters.
4 Application to a real sample
The conclusions drawn in the previous section about the retrievability of galaxy physical parameters from different types of observations at optical wavelengths rely on sophisticated simulations of galaxy spectral energy distributions. As emphasized in Section 2.4, such pseudo-observations are required to test the retrievability of physical parameters from observables, because the physical parameters of real galaxies cannot be known a priori. In this section, we apply our approach to the interpretation of observed medium-resolution spectra of galaxies from the SDSS DR7. We compare the results obtained through the simultaneous interpretation of stellar and nebular emission (at the resolving power considered in Section 3.2.3) with results obtained for the same galaxies from previous separate analyses of nebular emission-line and stellar absorption-line features (at the native resolving power of the SDSS observations). We also investigate the influence of the adopted prior distributions on the retrieved physical parameters of the galaxies.
4.1 Physical parameters of SDSS galaxies
The SDSS DR7 contains about 1 million galaxy spectra covering the wavelength range from 3800 to 9200 Å (observer frame) at a spectral resolution of roughly 3 Å FWHM. Of these, we extract a subsample of 12,660 star-forming galaxies with high-quality spectra as follows. We first reject any duplicate spectrum of a same galaxy, all spectra of merger candidates (i.e. corresponding to spatial separations less than 1.5″ and redshift separations less than 200 km s-1) and all galaxies at redshift less than (to ensure that the spectrum includes the doublet) from the original sample. Among the remaining 829,570 galaxies, we select all emission-line galaxies with signal-to-noise ratio greater than 10 in , H, , H, and . We reject AGNs by applying the conservative criterion of Kauffmann et al. (2003b) in the standard Baldwin et al. (1981) line-diagnostic diagram (see Fig. 2a above). The resulting 28,075 star-forming galaxies have a mean redshift of . We exclude all galaxies at redshift to keep the sample homogeneous and further select galaxies with median signal-to-noise ratio per pixel in the range . This leaves 23,213 spectra of galaxies at a mean redshift of , all of which have net H emission equivalent widths greater than 5 Å. We identify 12,660 galaxies in this sample for which good measurements of stellar mass, star formation rate, gas-phase oxygen abundance and dust attenuation optical depth are available from previous studies (see next paragraph). For the purpose of illustrating the usefulness of our approach to interpret galaxy spectra, we focus on the galaxy physical properties probed by the 3-arcsec-diameter SDSS fibers and do not consider any photometry-based aperture correction.
Estimates of star formation rate, gas-phase oxygen abundance and dust attenuation optical depth are available for the 12,600 SDSS galaxies in this sample from the work of Brinchmann et al. (2004) and Tremonti et al. (2004). These estimates were obtained by fitting the fluxes of the , H, , H, and emission lines (measured to high precision by adjusting a stellar population model to the spectral continuum) with a large library of Charlot & Longhetti (2001) nebular emission models. In addition, stellar-mass estimates are available for all galaxies from the work of Gallazzi et al. (2005), who fitted the strengths of the 4000 Å break and the H, H+H, and absorption-line features with a large library of Bruzual & Charlot (2003) stellar population synthesis models. The combination of these stellar-mass estimates with the star-formation-rate estimates of Brinchmann et al. (2004) provides estimates of the specific star formation rate probed by the SDSS fiber.
The above physical parameters were derived from spectral analyses at the original SDSS resolution of about 3 Å FWHM. To exemplify the power of the approach developed in Section 2, and for the purpose of comparison with the results of Section 3.2.3, we degrade the SDSS spectra to a resolution of 5 Å FWHM, adopting as before a fixed pixel size of 2.5 Å. Also, we focus on the rest-frame wavelength range from 3700 to 7400 Å, which does not extend as much in the ultraviolet as that considered in Section 3.2.3 (Fig. 3a), but which does include the emission doublet. By analogy with the analysis of pseudo-observations in Section 3.2.3, we use the 5 million models in the spectral library assembled in Section 2.3 to retrieve likelihood distributions of physical parameters from the simultaneous analysis of the stellar and nebular emission (equations 2.10–2.12) for each SDSS galaxy in the sample. We note that, when computing likelihood distributions for a given galaxy, we exclude from the library all models older than the age of the Universe at the redshift of that galaxy.
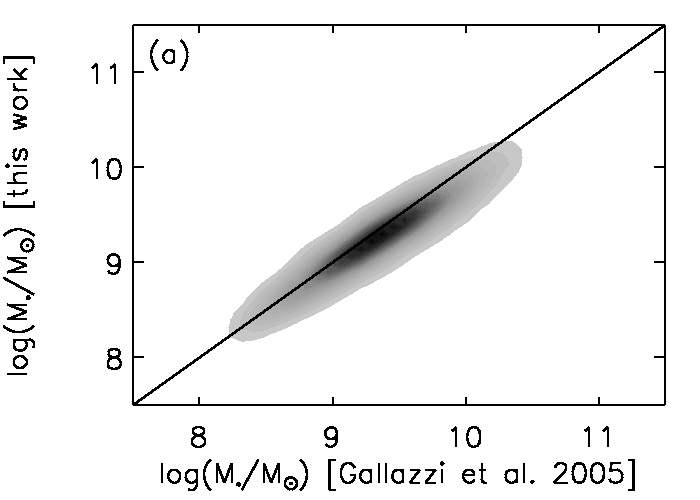
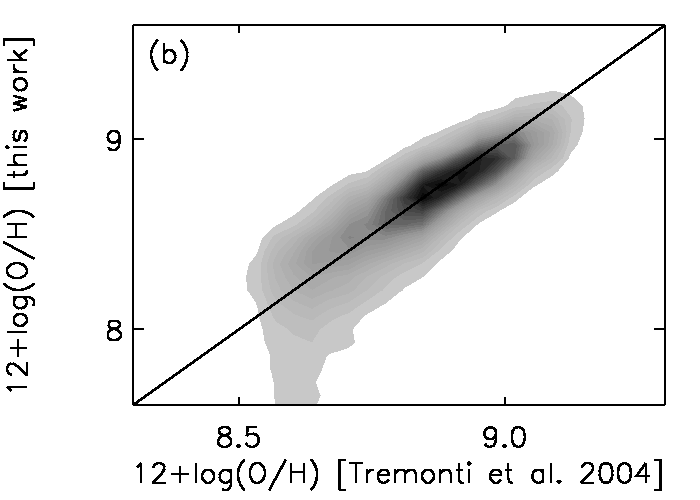
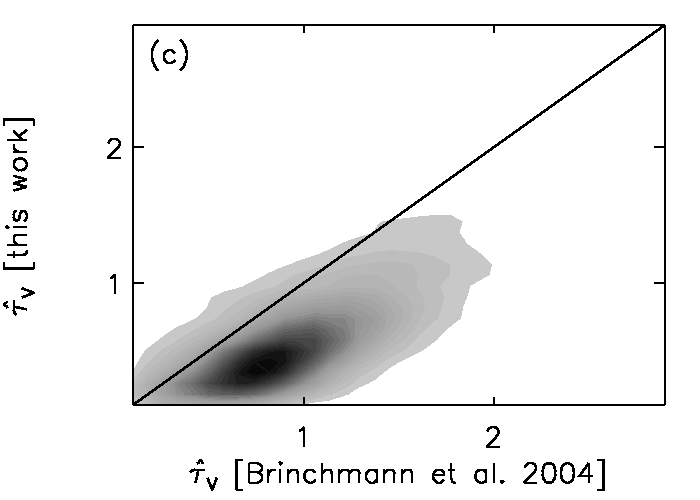
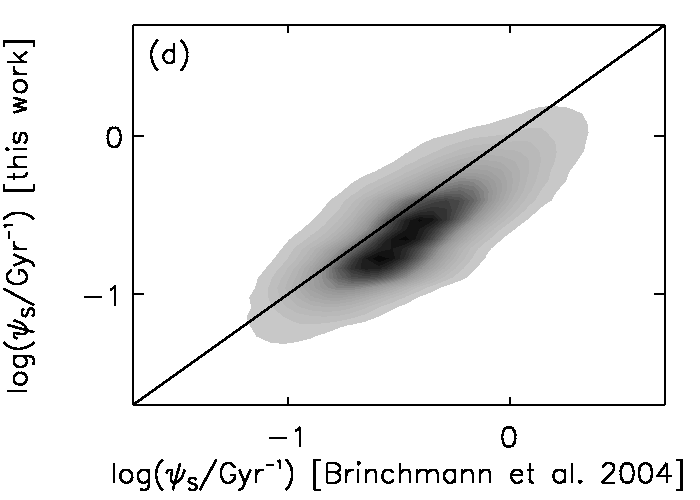
In Fig. 16, we show how the probability density functions of stellar mass, gas-phase oxygen abundance, total -band attenuation optical depth of the dust and specific star formation rate retrieved from our analysis compare with those obtained in previous separate studies of the stellar and nebular emission at higher spectral resolution. Fig. 16a shows that, for example, our estimates of (obtained by multiplying by the absolute galaxy luminosity in the observed band) agree well with those derived by Gallazzi et al. (2005) from the analysis of selected absorption-line indices. The slightly lower values derived here (dex) are attributable to the updated stellar population synthesis prescription (Section 2.2.1). We also find good agreement in Fig. 16b between our estimates of and those obtained by Tremonti et al. (2004) from the analysis of selected emission-lines luminosities. The discrepancies at are consistent with the uncertainty expected at low metallicity from interpretations of medium-resolution galaxy spectra (Fig. 15, bottom row). In Figs 16c and 16d, the likelihood distributions retrieved from our analysis favor systematically lower and than derived by Brinchmann et al. (2004) from the analysis of emission-line luminosities. This is because Brinchmann et al. (2004) adopt a shallower dust attenuation curve ( both in stellar birth clouds and in the ambient ISM) than that resulting typically from equations (2.7)–(2.9). This makes the inferred dust optical depth and the correction for obscured star formation smaller at fixed observed reddening.
Fig. 16 therefore shows that the likelihood distributions of , , and retrieved using our approach agree well (modulo some understood offsets) with those obtained in previous separate analyses of the stellar and nebular emission of SDSS galaxies at twice higher spectral resolution. Such an agreement is expected in part from the fact that these previous analyses rely on earlier versions of the same stellar population synthesis code and nebular emission models as adopted here (Bruzual & Charlot 2003; Charlot & Longhetti 2001; see Sections 2.2.1 and 2.2.2). What is most remarkable is the demonstrated ability with our approach to interpret simultaneously the stellar and nebular emission from galaxies without having to excise nebular emission lines from noisy spectra. As shown in Section 3, this ability extends to low-resolution galaxy spectra and even to multi-band photometry.
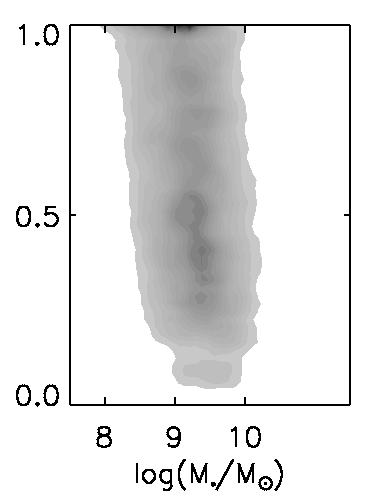
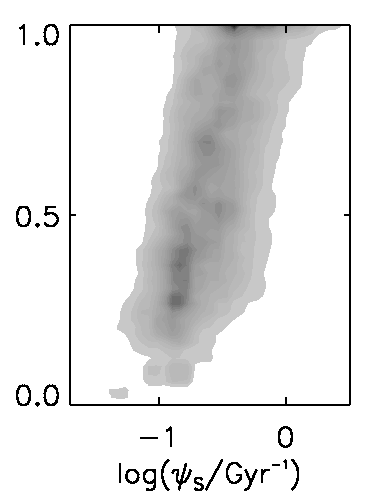
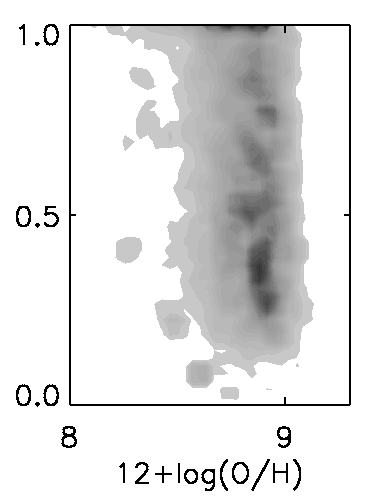
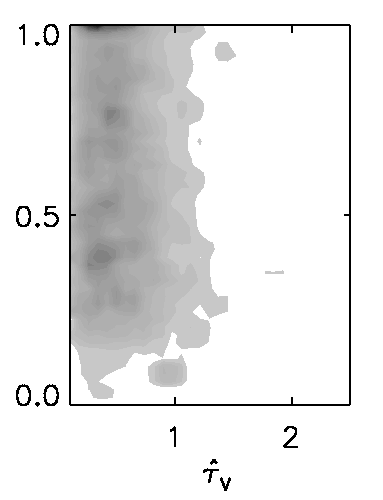
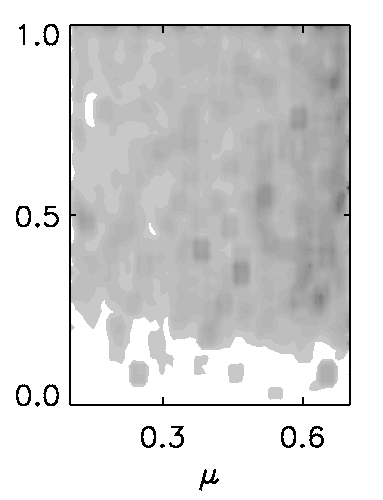
It is of interest to see how the fraction of the current stellar mass formed during the last 2.5 Gyr, which has not been investigated previously, relates to the other physical parameters of SDSS galaxies retrieved using our approach. In Fig. 17, we show the 2D probability density functions of versus , , , and for the 12,660 SDSS star-forming galaxies in our sample. The Spearman rank correlation coefficients (evaluated using the median estimates of the different parameters) are for the relation between and and for that between and . For this sample size, both correlations are significant at better than the 5 level. In contrast, none of the interstellar parameters , and correlates significantly with (we note in passing that the required high-S/N detection of 6 emission lines tends to select galaxies with low and high ). Taken at face value, the results of Fig. 17 would suggest that the least massive galaxies, which are the most actively star-forming ones today, have also formed the largest proportion of stars over the last 2.5 Gyr. Such a trend would be consistent with the general expectation that, as galaxies grow through star formation, the exhaustion of the gas supply makes the rate of star formation drop gradually (see also, e.g., fig. 22 of Brinchmann et al. 2004). However, this conclusion must be taken with caution, as the present sample is not complete and the SDSS fibers probe only the inner parts of galaxies.
4.2 Influence of the prior distributions of physical parameters
The constraints derived above on the stellar and interstellar properties of SDSS galaxies, along with the analyses of pseudo-observations carried out in Section 3, rely on the adoption of the prior distributions of galaxy physical parameters in Fig. 4. As outlined in Section 2.4, these distributions are designed to be as flat as possible to make the spectral library appropriate for the retrieval of physical parameters from observed spectral energy distributions of galaxies in wide ranges of physical properties. To illustrate the importance of this choice, we examine here the results obtained when adopting different prior distributions reflecting more specific properties of the galaxy population. As an example, we consider the prior distributions of galaxy physical parameters derived from the original semi-analytic recipes of De Lucia & Blaizot (2007).
In Section 2.1, we used the semi-analytic recipes of De Lucia & Blaizot (2007) to generate the star formation and chemical enrichment histories of 500,000 galaxies extracted from the Millennium cosmological simulation of Springel et al. (2005). The parameters , , and the interstellar metallicity are computed by default in this procedure. De Lucia & Blaizot (2007) do not provide any recipe to compute the gas-phase oxygen abundance nor the ionization parameter of the gas heated by young stars. Also, while attenuation by dust is included using the 2-component model of Charlot & Fall (2000, adopting a fixed attenuation curve both in stellar birth clouds and in the ambient ISM), we find that the recipe used by De Lucia & Blaizot (2007) to relate the -band dust optical depth to the galaxy gas mass, metallicity and orientation produces typically much lower than observed in SDSS galaxies. To compute prior distributions of interstellar parameters associated to the original semi-analytic recipes of De Lucia & Blaizot (2007), we therefore proceed as follows. For each of the 500,000 galaxies in the library, we draw 10 different realizations of , and from the distributions in Table 1. We also draw 10 different realizations of from a Gaussian distribution centred on 1.2 with a standard deviation of 0.6. This roughly represents the global properties of SDSS galaxies for a fixed attenuation curve in stellar birth clouds and in the ambient ISM (Brinchmann et al. 2004). The new spectral library contains 5 million models, which we can use to interpret observations of galaxy spectral energy distributions in the same way as the library assembled in Section 2.3.
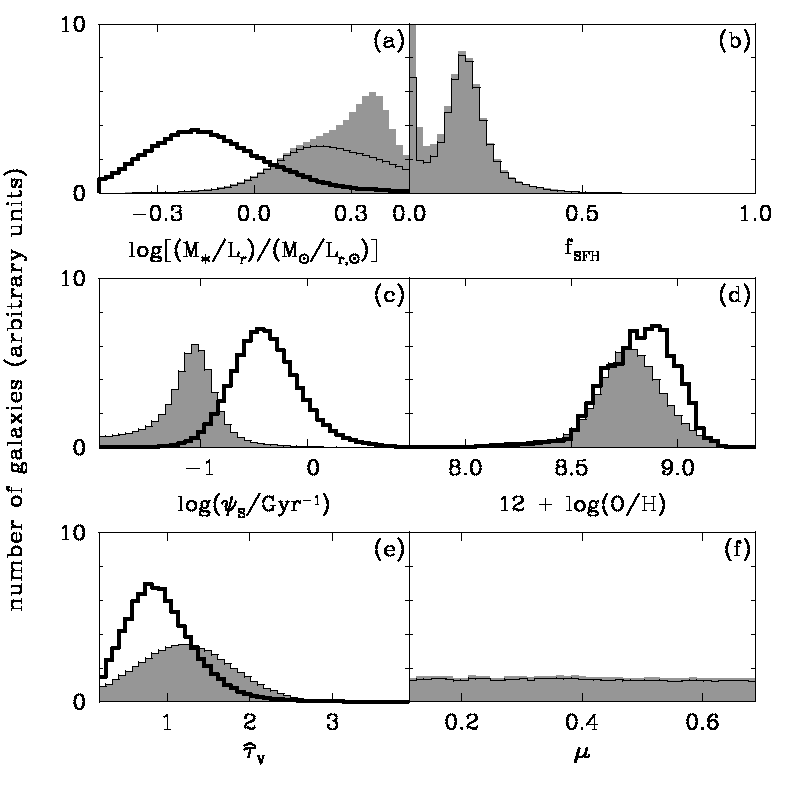
Fig. 18 shows the prior distributions of , , , , and in this library at the mean redshift of the SDSS sample of Section 4.1. In each panel, the shaded histogram shows the distribution including all galaxies, while the thin solid histogram shows the contribution by star-forming galaxies alone. As noted in Section 2.1, 35 percent of the galaxies in the original library of De Lucia & Blaizot (2007) do not form stars at low redshift, while the distributions of and for the remaining galaxies are narrow and characteristic of quiescent star formation (Figs 18b and 18c). As a result, most galaxies have relatively large (Fig. 18a). In Fig. 18d, the narrow distribution of arises from the correlation of the interstellar metallicity with for star-forming galaxies in this library. Also shown as thick solid histograms in Fig. 18 are the distributions of the best estimates of , , and from Gallazzi et al. (2005), Brinchmann et al. (2004) and Tremonti et al. (2004) for the 12,660 SDSS star-forming galaxies of Section 4.1. The required detection of 6 emission lines with in these galaxies implies that they are typically more actively star-forming (and hence have lower ) and less dusty than the bulk of SDSS galaxies the Millennium cosmological simulation is expected to represent. This is the origin of the differences between the shaded and thick solid histograms in Fig. 18.
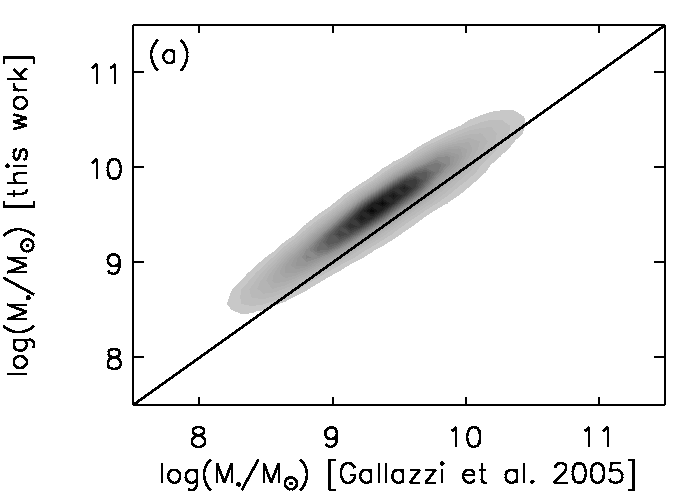
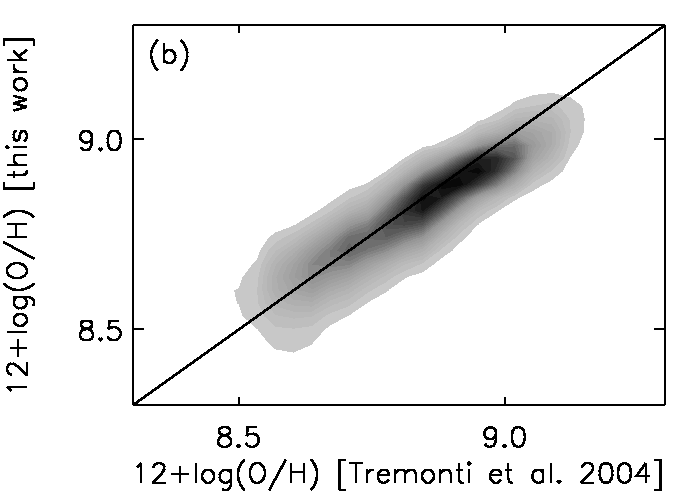
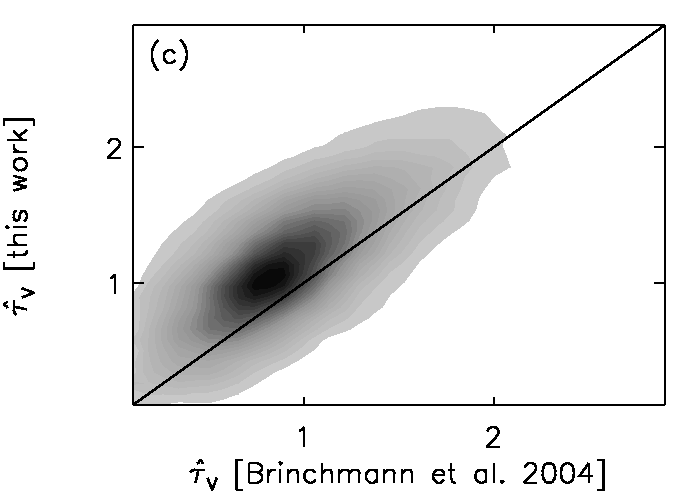
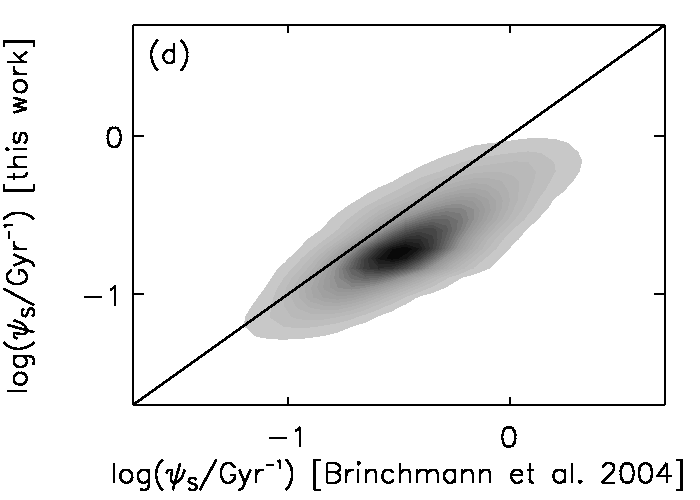
In Fig. 19, we show the analog of Fig. 16 obtained when using the prior distributions in Fig 18, instead of those in Fig. 4, to retrieve the probability density functions of , , and for the 12,660 SDSS star-forming galaxies in our sample. The upward bias in the prior distribution of relative to the observed sample (Fig. 18a) causes the estimates of in Fig. 19a to be systematically larger than those derived by Gallazzi et al. (2005). In Fig. 19d, the retrieved is about 60 percent smaller than that estimated by Brinchmann et al. (2004), as in Fig. 16d. The offset in this case results from the downward bias in the prior distribution of (Fig. 18c) rather than from differences in the dust attenuation curve, which is assumed to be the same by De Lucia & Blaizot (2007) and Brinchmann et al. (2004). Meanwhile, the upward bias in the prior distribution of (Fig. 18e) causes estimates of this parameter in Fig. 19c to be systematically larger than those derived by Brinchmann et al. (2004). In Fig. 19b, the estimates of retrieved using the prior distribution of Fig. 18d agree well with those derived by Tremonti et al. (2004).
The results of Figs 16 and 19 illustrate the importance of the choice of appropriate prior distributions when applying the Bayesian approach described in Section 2.4 to retrieve physical parameters from observed spectral energy distributions of galaxies. While the prior distributions of Fig. 18 are expected to be representative of the SDSS sample as a whole, adopting these distributions to analyze subsamples of galaxies with properties different from the bulk can induce unwanted offsets in the retrieved physical parameters. In cases where some specific physical property of the observed galaxies can be known in advance (e.g., actively star-forming, early-type, metal-poor), the use of appropriate restrictive prior distributions can help reduce the uncertainties in the retrieved parameters. When no advance information is available, it is preferable to appeal to flat (maximum-ignorance) prior distributions encompassing wide ranges of galaxy physical properties.
5 Summary and conclusion
| Parameter | Constraint | Photometrya | Net emission-line EWsb | Spectroscopyb | ||||
|---|---|---|---|---|---|---|---|---|
| rest-frame | ||||||||
| Allc | SFd | SFe | Allc | SFf | Allc | SFg | ||
| Uncertainty | 0.19 | … | … | 0.13 | 0.14 | 0.10 | 0.11 | |
| Accuracy | 0.04 | … | … | 0.01 | 0.01 | 0.00 | 0.00 | |
| Uncertainty | 0.36 | … | … | 0.23 | 0.23 | 0.17 | 0.19 | |
| Accuracy | 0.17 | … | … | 0.05 | 0.05 | 0.02 | 0.03 | |
| Uncertainty | 0.67 | 0.23 | 0.18 | 0.24 | 0.22 | 0.12 | 0.12 | |
| Accuracy | 0.15 | 0.12 | 0.05 | 0.01 | 0.00 | 0.00 | 0.00 | |
| Uncertainty | 0.50 | 0.23 | 0.05 | 0.28 | 0.21 | 0.13 | 0.08 | |
| Accuracy | 0.33 | 0.11 | 0.03 | 0.04 | 0.03 | 0.00 | 0.00 | |
| Uncertainty | 0.91 | 0.48h | 0.41h | 0.64 | 0.52 | 0.35 | 0.30 | |
| Accuracy | 0.21 | 0.57h | 0.14h | 0.05 | 0.00 | 0.00 | 0.00 | |
| Uncertainty | 0.20 | … | … | 0.16 | 0.15 | 0.10 | 0.10 | |
| Accuracy | 0.10 | … | … | 0.04 | 0.02 | 0.00 | 0.00 | |
a For fixed signal-to-noise ratio in all bands.
b For median signal-to-noise ratio per pixel across the wavelength range =3600–7400 Å.
c Averaged over all galaxy types.
d For greater-than-3 detections of ; H; ; ; and .
e For greater-than-3 detections of ; H; ; ; ; H; ; and .
f For galaxies with net H+[N ii] emission equivalent width greater than 5 Å.
g For galaxies with net H emission equivalent width greater than 5 Å.
h Constraint on the birth-cloud component of the attenuation only (i.e. and not ).
We have developed a new approach to constrain galaxy physical parameters from the combined interpretation of stellar and nebular emission in wide ranges of photometric and spectroscopic observations. Our approach relies on the simulation of a comprehensive library of 5 million galaxy spectral energy distributions using a set of state-of-the-art models of star formation and chemical enrichment histories, stellar population synthesis, nebular emission and attenuation by dust. This library can be used to retrieve probability density functions of physical parameters from the Bayesian analysis of any type of multi-wavelength galaxy observation. We focus in this paper on the retrievability of the observer-frame absolute -band stellar mass-to-light ratio (), the fraction of a current galaxy stellar mass formed during the last 2.5 Gyr (), the specific star formation rate (), the gas-phase oxygen abundance [], the total effective -band absorption optical depth of the dust () and the fraction of this arising from dust in the ambient ISM () from different types of observations at optical wavelengths: 5-band photometry; equivalent-width measurements of strong emission lines; low-resolution spectroscopy (50 Å FWHM over the wavelength range =3600–7400 Å); and medium-resolution spectroscopy (5 Å FWHM over the same wavelength range).
Since we cannot know the true properties of any sample of observed galaxies, assessing the retrievability of galaxy physical parameters from these different types of observations requires the simulation of pseudo-observations. We therefore simulate pseudo-observations by convolving the spectral energy distributions of models with known parameters with appropriate instrument responses and then applying artificial noise to mimic true observations. For each type of photometric or spectroscopic observation, we simulate 10,000 pseudo-observations in this way and use the other million models in the library to retrieve likelihood distributions of , , , , and for each pseudo-galaxy (using equations 2.10–2.11). Table 2 summarizes the main conclusions of our study. For each parameter and each type of observation, we list the median retrieved uncertainty (defined as half the 16th–84th percentile range of the retrieved likelihood distribution) and accuracy (defined as the absolute difference between the retrieved best estimate and true parameter value) determined from the analysis of the 10,000 pseudo-observations in Section 3.
Several interesting conclusions can be drawn from Table 2. We find that, for example, rest-frame photometry can provide roughly 50-percent uncertainty on measurements, i.e. almost as tight as the 25- to 35-percent uncertainty provided by medium- and low-resolution optical spectroscopy (photometric constraints worsen somewhat if the galaxy redshift is not known; see Fig. 11). Meanwhile, optical spectroscopy is required to constrain through the strong absorption-line signatures of intermediate-age stars. Table 2 also shows that observations of the net emission equivalent widths of prominent optical lines are sufficient to constrain to within 50–70 percent (depending on the spectral resolution) and to within 0.05–0.23 in star-forming galaxies. Optical spectroscopy can help reduce these uncertainties and the potential small offsets in the retrieved best estimates of and . In addition, spectroscopy is required to constrain both parameters in quiescent star-forming galaxies with weak emission lines (; see Fig. 12). Medium-resolution spectroscopy provides the best constraints on dust parameters in Table 2, with uncertainties of typically 0.35 in and 0.10 in (these include uncertainties in the optical properties and spatial distribution of the dust as well as in the orientation of the galaxy; see Section 2.2.3). At lower spectral resolution, the less distinct signatures of emission lines make the uncertainty in rise by about 80 percent, while the equivalent widths of optical emission lines at any spectral resolution constrain only the part of the attenuation arising from stellar birth clouds.
We stress that the constraints in Table 2 rely critically on the ability with our approach to interpret simultaneously the stellar and nebular emission from galaxies. In the case of low-resolution spectroscopy, no reliable constraint can be obtained on any of the physical parameters in Table 2 (except for the mass-to-light ratio of early-type galaxies) when nebular emission is not included in the analysis (Fig. 14). The same is true at medium spectral resolution, although if the resolution is high enough, prominent nebular emission lines can be excised from the spectra and analyzed separately from the stellar continuum and absorption-line signatures. We find that the likelihood distributions of , , and retrieved from the combined analysis of stellar and nebular emission in the spectra of 12,660 SDSS star-forming galaxies (degraded to a resolution of 5 Å FWHM) using our approach agree well (modulo some recent model improvements) with those obtained in previous separate analyses of the stellar and nebular emission of these galaxies at twice higher spectral resolution (Brinchmann et al. 2004; Tremonti et al. 2004; Gallazzi et al. 2005, see Fig. 16). Accounting for nebular emission is less crucial when deriving constraints on from photometry (Fig. 8, bottom row).
Another important factor we can investigate in a straightforward way using our approach is the influence of signal-to-noise ratio on the retrieval of galaxy physical parameters from different types of observations. For multiband photometry, we find that lowering the signal-to-noise ratio from to 10 makes the uncertainty in the retrieved in Table 2 larger by about 15 percent (Fig. 8). For spectroscopy, adopting a median signal-to-noise ratio per pixel instead of 20 makes the median uncertainties in the different retrieved parameters increase by about 30 to 90 percent and introduces substantial biases in the retrieved likelihood distributions (Fig. 14). The ability to make such assessments is valuable as it can help decide between different strategies when designing an observational campaign. For example, as noted in Section 3.2.2, low-resolution spectroscopy with over the wavelength range from to 7400 Å provides hardly better constraints on the different parameters in Table 2 than high-quality photometry (Figs 6 and 14). In contrast, the constraints from low-resolution spectroscopy with over the same wavelength range are generally far superior to those obtained from multiband photometry (Table 2).
It is important to keep in mind that the results reported in Table 2 about the retrievability of galaxy physical parameters from different types of observations correspond to the optimistic case in which the models we rely on are good approximations of true galaxies (Section 2.4). We have ensured this in the best possible way by appealing to state-of-the-art models including the most recent progress in galaxy spectral modeling to generate the library of spectral energy distributions on which our approach is based. With this in mind, the tool we have developed should be useful not only to interpret existing galaxy datasets, but also to design future observations. In principle, such observations can be of any photometric or spectroscopic type (or a combination thereof ) across the wavelength range covered by spectral evolution models. We have focused in this paper on a few examples of photometric and spectroscopic observations at rest-frame optical wavelengths. In future work, we will present applications of our approach to the interpretation of the ultraviolet and infrared emission from galaxies at various redshifts. The tool we have developed is intended to be made available to the general astronomical community. In the meantime, we encourage colleagues interested in the application of our approach to the interpretation of specific galaxy observations to contact us.
acknowledgements
We thank Maryam Shirazi for her help in the assembly of the SDSS galaxy sample. We also thank Marijn Franx, Brent Groves and Vivienne Wild for helpful discussions. This work was funded in part by the Marie Curie Initial Training Network ELIXIR of the European Commission under contract PITN-GA-2008-214227.
Funding for the SDSS has been provided by the Alfred P. Sloan Foundation, the Participating Institutions, the National Science Foundation, the US Department of Energy, the National Aeronautics and Space Administration, the Japanese Monbukagakusho, the Max Planck Society, and the Higher Education Funding Council for England. The SDSS Web site is http://www.sdss.org. The SDSS is managed by the Astrophysical Research Consortium for the Participating Institutions. The Participating Institutions are the American Museum of Natural History, the Astrophysical Institute Potsdam, the University of Basel, Cambridge University, Case Western Reserve University, the University of Chicago, Drexel University, Fermilab, the Institute for Advanced Study, the Japan Participation Group, Johns Hopkins University, the Joint Institute for Nuclear Astrophysics, the Kavli Institute for Particle Astrophysics and Cosmology, the Korean Scientist Group, the Chinese Academy of Sciences, Los Alamos National Laboratory, the Max Planck Institute for Astronomy, the Max Planck Institute for Astrophysics, New Mexico State University, Ohio State University, the University of Pittsburgh, the University of Portsmouth, Princeton University, the US Naval Observatory, and the University of Washington.
References
- Abazajian et al. (2009) Abazajian K. N., Adelman-McCarthy J. K., Agüeros M. A., Allam S. S., Allende Prieto C., An D., Anderson K. S. J., Anderson S. F., Annis J., Bahcall N. A., et al. 2009, ApJS, 182, 543
- Baldwin et al. (1981) Baldwin J. A., Phillips M. M., Terlevich R., 1981, PASP, 93, 5
- Bell & de Jong (2001) Bell E. F., de Jong R. S., 2001, ApJ, 550, 212
- Bertelli et al. (2008) Bertelli G., Girardi L., Marigo P., Nasi E., 2008, A&A, 484, 815
- Bertelli et al. (2009) Bertelli G., Nasi E., Girardi L., Marigo P., 2009, A&A, 508, 355
- Blaizot et al. (2004) Blaizot J., Guiderdoni B., Devriendt J. E. G., Bouchet F. R., Hatton S. J., Stoehr F., 2004, MNRAS, 352, 571
- Blitz & Shu (1980) Blitz L., Shu F. H., 1980, ApJ, 238, 148
- Brinchmann et al. (2004) Brinchmann J., Charlot S., White S. D. M., Tremonti C., Kauffmann G., Heckman T., Brinkmann J., 2004, MNRAS, 351, 1151
- Bruzual & Charlot (2003) Bruzual G., Charlot S., 2003, MNRAS, 344, 1000
- Chabrier (2003) Chabrier G., 2003, PASP, 115, 763
- Charlot & Fall (2000) Charlot S., Fall S. M., 2000, ApJ, 539, 718
- Charlot & Longhetti (2001) Charlot S., Longhetti M., 2001, MNRAS, 323, 887
- Cid Fernandes et al. (2005) Cid Fernandes R., Mateus A., Sodré L., Stasińska G., Gomes J. M., 2005, MNRAS, 358, 363
- Coelho et al. (2007) Coelho P., Bruzual G., Charlot S., Weiss A., Barbuy B., Ferguson J. W., 2007, MNRAS, 382, 498
- Colless et al. (2001) Colless M., Dalton G., Maddox S., Sutherland W., Norberg P., Cole S., Bland-Hawthorn J., Bridges T., Cannon R., Collins C., Couch W., Cross N., Deeley K., De Propris R., Driver S. P., Efstathiou G., Ellis R. S., et al. 2001, MNRAS, 328, 1039
- Conroy et al. (2010) Conroy C., White M., Gunn J. E., 2010, ApJ, 708, 58
- Croton et al. (2006) Croton D. J., Springel V., White S. D. M., De Lucia G., Frenk C. S., Gao L., Jenkins A., Kauffmann G., Navarro J. F., Yoshida N., 2006, MNRAS, 367, 864
- da Cunha et al. (2008) da Cunha E., Charlot S., Elbaz D., 2008, MNRAS, 388, 1595
- Davis et al. (2003) Davis M., Faber S. M., Newman J., Phillips A. C., Ellis R. S., Steidel C. C., Conselice C., Coil A. L., Finkbeiner D. P., Koo D. C., Guhathakurta P., Weiner B., Schiavon R., Willmer C., Kaiser N., Luppino G. A., Wirth G., et al. 2003, in P. Guhathakurta ed., Society of Photo-Optical Instrumentation Engineers (SPIE) Conference Series Vol. 4834 of Presented at the Society of Photo-Optical Instrumentation Engineers (SPIE) Conference, Science Objectives and Early Results of the DEEP2 Redshift Survey. pp 161–172
- De Lucia & Blaizot (2007) De Lucia G., Blaizot J., 2007, MNRAS, 375, 2
- Ferland (1996) Ferland G. J., 1996, Hazy, A Brief Introduction to Cloudy 90
- Gallazzi et al. (2005) Gallazzi A., Charlot S., Brinchmann J., White S. D. M., Tremonti C. A., 2005, MNRAS, 362, 41
- González Delgado et al. (2005) González Delgado R. M., Cerviño M., Martins L. P., Leitherer C., Hauschildt P. H., 2005, MNRAS, 357, 945
- González-Lópezlira et al. (2010) González-Lópezlira R. A., Bruzual-A. G., Charlot S., Ballesteros-Paredes J., Loinard L., 2010, MNRAS, 403, 1213
- Goranova et al. (2009) Goranova Y., Hudelot P., Magnard F., McCracken H., Mellier Y., Monnerville M., Schultheis M., Sémah J.-C., Cuillandre J.-C., Aussel H., 2009, http://terapix.iap.fr/cplt/T0006-doc.pdf
- Heckman et al. (2004) Heckman T. M., Kauffmann G., Brinchmann J., Charlot S., Tremonti C., White S. D. M., 2004, ApJ, 613, 109
- Ilbert et al. (2006) Ilbert O., Arnouts S., McCracken H. J., Bolzonella M., Bertin E., Le Fèvre O., Mellier Y., Zamorani G., Pellò R., 2006, A&A, 457, 841
- Ilbert et al. (2009) Ilbert O., Capak P., Salvato M., Aussel H., McCracken H. J., Sanders D. B., Scoville N., Kartaltepe J., Arnouts S., Le Floc’h E., Mobasher B., Taniguchi Y., 2009, ApJ, 690, 1236
- Kauffmann et al. (2003a) Kauffmann G., et al. 2003a, MNRAS, 341, 33
- Kauffmann et al. (2003b) Kauffmann G., et al. 2003b, MNRAS, 346, 1055
- Kawamura et al. (2009) Kawamura A., et al. 2009, ApJS, 184, 1
- Kewley & Dopita (2002) Kewley L. J., Dopita M. A., 2002, ApJS, 142, 35
- Kong et al. (2004) Kong X., Charlot S., Brinchmann J., Fall S. M., 2004, MNRAS, 349, 769
- Lamareille et al. (2006) Lamareille F., Contini T., Le Borgne J.-F., Brinchmann J., Charlot S., Richard J., 2006, A&A, 448, 893
- Le Fèvre et al. (2005) Le Fèvre O., Vettolani G., Garilli B., Tresse L., Bottini D., Le Brun V., Maccagni D., Picat J. P., Scaramella R., Scodeggio M., Zanichelli A., Adami C., Arnaboldi M., Arnouts S., Bardelli S., et al. 2005, A&A, 439, 845
- Maraston (2005) Maraston C., 2005, MNRAS, 362, 799
- Marigo et al. (2008) Marigo P., Girardi L., Bressan A., Groenewegen M. A. T., Silva L., Granato G. L., 2008, A&A, 482, 883
- Panter et al. (2007) Panter B., Jimenez R., Heavens A. F., Charlot S., 2007, MNRAS, 378, 1550
- Pierini et al. (2004) Pierini D., Gordon K. D., Witt A. N., Madsen G. J., 2004, ApJ, 617, 1022
- Rocha et al. (2008) Rocha M., Jonsson P., Primack J. R., Cox T. J., 2008, MNRAS, 383, 1281
- Salim et al. (2005) Salim S., Charlot S., Rich R. M., Kauffmann G., Heckman T. M., Barlow T. A., Bianchi L., Byun Y., Donas J., Forster K., Friedman P. G., Jelinsky P. N., Lee Y., Madore B. F., Malina R. F., Martin D. C., Milliard B., Morrissey P., et al. 2005, ApJ, 619, L39
- Salim et al. (2007) Salim S., Rich R. M., Charlot S., Brinchmann J., Johnson B. D., Schiminovich D., Seibert M., Mallery R., Heckman T. M., Forster K., Friedman P. G., Martin D. C., Morrissey P., Neff S. G., Small T., Wyder T. K., Bianchi L., et al. 2007, ApJS, 173, 267
- Sánchez-Blázquez et al. (2006) Sánchez-Blázquez P., Peletier R. F., Jiménez-Vicente J., Cardiel N., Cenarro A. J., Falcón-Barroso J., Gorgas J., Selam S., Vazdekis A., 2006, MNRAS, 371, 703
- Schaerer & de Barros (2010) Schaerer D., de Barros S., 2010, A&A, 515, A73+
- Scoville et al. (2007) Scoville N., Aussel H., Brusa M., Capak P., Carollo C. M., Elvis M., Giavalisco M., Guzzo L., Hasinger G., Impey C., Kneib J., LeFevre O., Lilly S. J., Mobasher B., Renzini A., Rich R. M., Sanders D. B., et al. 2007, ApJS, 172, 1
- Springel et al. (2005) Springel V., White S. D. M., Jenkins A., Frenk C. S., Yoshida N., Gao L., Navarro J., Thacker R., Croton D., Helly J., Peacock J. A., Cole S., Thomas P., Couchman H., Evrard A., Colberg J., Pearce F., 2005, Nature, 435, 629
- Thomas et al. (2011) Thomas D., Maraston C., Johansson J., 2011, MNRAS, pp 49–+
- Tremonti et al. (2004) Tremonti C. A., Heckman T. M., Kauffmann G., Brinchmann J., Charlot S., White S. D. M., Seibert M., Peng E. W., Schlegel D. J., Uomoto A., Fukugita M., Brinkmann J., 2004, ApJ, 613, 898
- Tuffs et al. (2004) Tuffs R. J., Popescu C. C., Völk H. J., Kylafis N. D., Dopita M. A., 2004, A&A, 419, 821
- Vazdekis et al. (2010) Vazdekis A., Sánchez-Blázquez P., Falcón-Barroso J., Cenarro A. J., Beasley M. A., Cardiel N., Gorgas J., Peletier R. F., 2010, MNRAS, 404, 1639
- Walcher et al. (2009) Walcher C. J., Coelho P., Gallazzi A., Charlot S., 2009, MNRAS, 398, L44
- Weinmann et al. (2006) Weinmann S. M., van den Bosch F. C., Yang X., Mo H. J., Croton D. J., Moore B., 2006, MNRAS, 372, 1161
- Wild et al. (2008) Wild V., Budavári T., Blaizot J., Walcher C. J., Johansson P. H., Lemson G., De Lucia G., Charlot S., 2008, in C. A. L. Bailer-Jones ed., American Institute of Physics Conference Series Vol. 1082 of American Institute of Physics Conference Series, Quenching of Star Formation. pp 119–125
- Wild et al. (011b) Wild V., Charlot S., Brinchmann J., Heckman T., Vince O., Pacifici C., Chevallard J., 2011b, MNRAS, in press
- Wild et al. (011a) Wild V., Groves B., Heckman T., Sonnentrucker P., Armus L., Schiminovich D., Johnson B., Martins L., Lamassa S., 2011a, MNRAS, 410, 1593
- Wild et al. (2007) Wild V., Kauffmann G., Heckman T., Charlot S., Lemson G., Brinchmann J., Reichard T., Pasquali A., 2007, MNRAS, 381, 543
- Wuyts et al. (2009) Wuyts S., Franx M., Cox T. J., Hernquist L., Hopkins P. F., Robertson B. E., van Dokkum P. G., 2009, ApJ, 696, 348
- York et al. (2000) York D. G., Adelman J., Anderson Jr. J. E., Anderson S. F., Annis J., Bahcall N. A., Bakken J. A., Barkhouser R., Bastian S., Berman E., Boroski W. N., Bracker S., Briegel C., Briggs J. W., Brinkmann J., Brunner R., Burles S., et al. 2000, AJ, 120, 1579