High speed photometry of faint cataclysmic variables - VII. Targets selected from the Sloan Digital Sky Survey and the Catalina Real-time Transient Survey
Abstract
We present high speed photometric observations of 20 faint cataclysmic variables, selected from the Sloan Digital Sky Survey and Catalina catalogues. Measurements are given of 15 new directly measured orbital periods, including four eclipsing dwarf novae (SDSS0904+03, CSS0826-00, CSS1404-10 and CSS1626-12), two new polars (CSS0810+00 and CSS1503-22) and two dwarf novae with superhumps in quiescence (CSS0322+02 and CSS0826-00). Whilst most of the dwarf novae presented here have periods below 2 h, SDSS0805+07 and SSS0617-36 have relatively long orbital periods of 5.489 and 3.440 h, respectively. The double humped orbital modulations observed in SSS0221-26, CSS0345-01, CSS1300+11 and CSS1443-17 are typical of low mass transfer rate dwarf novae. The white dwarf primary of SDSS0919+08 is confirmed to have non-radial oscillations and quasi-periodic oscillations were observed in the short-period dwarf nova CSS1028-08 during outburst. We further report the detection of a new nova-like variable (SDSS1519+06). The frequency distribution of orbital periods of CVs in the Catalina survey has a high peak near min orbital period, independently confirming that found by Gänsicke et al (2009) from SDSS sources. We also observe a marked correlation between the median in the orbital period distribution and the outburst class, in the sense that dwarf novae with a single observed outburst (over the 5-year baseline of the CRTS coverage) occur predominantly at shortest orbital period.
keywords:
techniques: photometric – binaries: close – eclipsing – novae, cataclysmic variables – stars: dwarf novae1 Introduction
In six previous papers (references given in Woudt & Warner 2010) we presented results from high speed photometry of faint cataclysmic variables (CVs: see Warner 1995a for a review) that had previously only been poorly studied. We have now observed a further 20 stars, drawn from the Sloan Digital Sky Survey (SDSS: e.g., Abazajian et al. 2009) and the Catalina Real-Time Transient Survey (CRTS: Drake et al. 2009).
The CRTS has detected CVs to date (2011 October) using a network of three telescopes: the
0.7-m Catalina Sky Survey (CSS) Schmidt telescope, the Mt. Lemmon Survey (MLS) 1.5-m Cassegrain
and the Siding Springs Survey (SSS) 0.5-m Schmidt telescope.
The CRTS keeps variable objects under surveillance for 21 nights of each lunation,
giving good coverage of long-term light curves, and publishes results as they are
obtained111http://nessi.cacr.caltech.edu/catalina/AllCV.html
http://nessi.cacr.caltech.edu/MLS/AllCV.html
http://nessi.cacr.caltech.edu/SSS/AllCV.html.
The CVs detected by the CRTS are largely dwarf novae found from their outbursts - their detection
is triggered by outburst amplitudes in excess of 2 mag - and some magnetic CVs (polars) varying between
low and high states.
Given the depth of the CRTS survey ( mag), CRTS is able to sample a population
of intrinsically faint dwarf novae.
In our high-speed photometric survey we generally sample CRTS CVs accessible to the Southern African Large Telescope (SALT) in case spectroscopic follow-up is required. This implies that we primarily select CRTS CVs south of declination +10∘. Within this declination range there are 357 CVs in the CRTS (at 2011 October), of which 241 have been discovered by the CSS telescope, 7 by the MLS telescope (unique identifications, not duplicated in CSS) and 109 have been discovered solely by the SSS telescope.
All of our observations were made with the University of Cape Town (UCT) CCD photometer, as described by O’Donoghue (1995), in frame transfer mode and with white light, on the 1.9-m (74-in) and 1.0-m (40-in) reflectors at the Sutherland site of the South African Astronomical Observatory (SAAO).
In our previous papers, an approximate magnitude scale was derived with the use of hot white dwarf standards (Landolt 1992), but because of the non-standard spectral distributions of CVs and the use of white light, our magnitudes approximate a scale only to 0.1 mag. Given that our targets in this paper are largely drawn from the SDSS and CRTS surveys, we explored the reliability of using SDSS photometry to calibrate our white light observations. On clear nights when hot white dwarf standards were observed, SDSS stars in the field of view of target CVs revealed a stable zero point offset between and SDSS r of 0.12 0.05 over a broad range of SDSS colour from . This is consistent with the SDSS r to photometric transformation described by Jester et al. (2005). The UCT CCD magnitudes quoted in this paper correspond to r photometric system, calibrated by SDSS photometry of stars in the field of view of our targets with colours in the range 0.2 – 1.0.
Our work is an ongoing survey – many of the stars reported here will require more intensive and extended study. In Section 2 we give the results of our observations. Section 3 gives brief conclusions.
2 Observations
| Object | Type | Run No. | Date of obs. | HJD of first obs. | Length | Tel. | r | |
| (start of night) | (+2450000.0) | (h) | (s) | (mag) | ||||
| SDSS0805+07 | CV | S7767 | 2007 Dec 29 | 4464.42448 | 4.10 | 60 | 40-in | 17.9 |
| S7771 | 2007 Dec 31 | 4466.52235 | 1.77 | 60 | 40-in | 17.9 | ||
| S7773 | 2008 Jan 01 | 4467.38970 | 4.92 | 60 | 40-in | 17.9 | ||
| SDSS0904+03 | CV | S7190 | 2003 Dec 23 | 2997.53850 | 1.53 | 80 | 74-in | 19.3∗ |
| eclipsing | S7200 | 2003 Dec 27 | 3001.49672 | 2.65 | 90 | 74-in | 19.4∗ | |
| S7216 | 2003 Dec 31 | 3005.41754 | 2.91 | 45 | 74-in | 19.2∗ | ||
| S7541 | 2004 Dec 14 | 3354.50212 | 2.29 | 80 | 40-in | 19.0∗ | ||
| S7545 | 2004 Dec 16 | 3356.50347 | 2.40 | 80 | 40-in | 19.0∗ | ||
| S7600 | 2005 Mar 08 | 3438.26907 | 3.52 | 100 | 40-in | 19.2∗ | ||
| S7602 | 2005 Mar 09 | 3439.26052 | 2.53 | 100 | 40-in | 19.2∗ | ||
| S7603 | 2005 Mar 10 | 3440.26381 | 2.36 | 100 | 40-in | 19.2∗ | ||
| S7604 | 2005 Mar 11 | 3441.26385 | 2.83 | 100 | 40-in | 19.2∗ | ||
| S7612 | 2005 Mar 29 | 3459.23798 | 2.12 | 60 | 40-in | 19.2∗ | ||
| SDSS0919+08 | CV | S7212 | 2003 Dec 30 | 3004.47499 | 2.15 | 30 | 74-in | 18.2: |
| S7219 | 2004 Jan 01 | 3006.43116 | 2.29 | 25 | 74-in | 18.3 | ||
| S7235 | 2004 Feb 09 | 3045.34260 | 1.83 | 100 | 40-in | 18.2 | ||
| S7236 | 2004 Feb 13 | 3049.36907 | 0.48 | 100 | 40-in | 18.1 | ||
| S7238 | 2004 Feb 14 | 3050.32530 | 2.80 | 90 | 40-in | 18.2 | ||
| S7243 | 2004 Feb 15 | 3051.33939 | 2.24 | 100 | 40-in | 18.2 | ||
| S7561 | 2005 Feb 01 | 3403.44323 | 2.95 | 90 | 40-in | 18.3 | ||
| S7564 | 2005 Feb 03 | 3405.40375 | 2.55 | 90 | 40-in | 18.1: | ||
| S7566 | 2005 Feb 04 | 3406.39126 | 4.05 | 90 | 40-in | 18.3 | ||
| S7569 | 2005 Feb 05 | 3407.39868 | 3.47 | 90 | 40-in | 18.2 | ||
| S7572 | 2005 Feb 06 | 3408.41099 | 2.73 | 90 | 40-in | 18.2 | ||
| S7575 | 2005 Feb 07 | 3409.40965 | 1.60 | 90 | 40-in | 18.2 | ||
| S7685 | 2007 Jan 14 | 4115.42552 | 3.83 | 30 | 40-in | 18.3 | ||
| S7687 | 2007 Jan 15 | 4116.42147 | 4.11 | 30 | 40-in | 18.3 | ||
| S7689 | 2007 Jan 16 | 4117.43745 | 2.91 | 30 | 40-in | 18.2 | ||
| S7692 | 2007 Jan 17 | 4118.40030 | 4.93 | 30 | 40-in | 18.2 | ||
| S7695 | 2007 Jan 18 | 4119.41123 | 4.33 | 30 | 40-in | 18.2 | ||
| S7698 | 2007 Jan 19 | 4120.42478 | 4.14 | 30 | 40-in | 18.2 | ||
| S7702 | 2007 Jan 21 | 4122.42529 | 4.27 | 30 | 40-in | 18.2 | ||
| S7705 | 2007 Jan 22 | 4123.44064 | 3.66 | 30 | 40-in | 18.2 | ||
| S7707 | 2007 Jan 23 | 4124.40915 | 3.83 | 30 | 40-in | 18.2 | ||
| SDSS1519+06 | CV | S7759 | 2007 Mar 24 | 4184.54459 | 2.77 | 40 | 40-in | 17.1b |
| S7762 | 2007 Mar 26 | 4186.48546 | 4.14 | 40 | 40-in | 17.2b | ||
| S7765 | 2007 Mar 27 | 4187.47591 | 4.11 | 40 | 40-in | 17.0b | ||
| SSS0221-26 | DN | S8001 | 2010 Oct 28 | 5498.41592 | 2.34 | 45 | 74-in | 19.3: |
| S8004 | 2010 Oct 30 | 5500.33806 | 4.85 | 60 | 74-in | 19.3: | ||
| S8006 | 2010 Oct 31 | 5501.42365 | 2.42 | 60 | 74-in | 19.3: | ||
| CSS0332+02 | DN | S7881 | 2009 Dec 16 | 5182.29440 | 3.98 | 90 | 74-in | 20.1 |
| S7883 | 2009 Dec 17 | 5183.28893 | 3.30 | 90 | 74-in | 20.1 | ||
| S7885 | 2009 Dec 18 | 5184.29130 | 3.13 | 90 | 74-in | 20.3 | ||
| S7889 | 2009 Dec 20 | 5186.29202 | 3.07 | 90 | 74-in | 20.3 | ||
| S7894 | 2009 Dec 22 | 5188.35299 | 1.48 | 90 | 74-in | 20.0 | ||
| S7896 | 2009 Dec 23 | 5189.29053 | 2.85 | 90 | 74-in | 19.9 | ||
| CSS0334-07 | DN | S7680 | 2007 Jan 12 | 4113.28517 | 1.92 | 10 | 40-in | 17.8 |
| S7887 | 2009 Dec 19 | 5185.29124 | 3.18 | 30 | 74-in | 18.3 | ||
| S7996 | 2010 Sep 19 | 5458.52966 | 2.88 | 95 | 40-in | 18.4 | ||
| S8009 | 2010 Nov 01 | 5502.42705 | 4.63 | 45 | 74-in | 18.6 | ||
| S8043 | 2010 Dec 12 | 5543.29738 | 3.80 | 60 | 74-in | 18.6 | ||
| CSS0345-01 | DN | S8016 | 2010 Nov 26 | 5527.29721 | 4.32 | 90,100 | 40-in | 18.6: |
| S8019 | 2010 Nov 27 | 5528.39225 | 1.70 | 90 | 40-in | 18.6: | ||
| S8026 | 2010 Nov 30 | 5531.34710 | 5.18 | 90 | 40-in | 18.7: |
Notes: DN = Dwarf Nova; is the integration time; ∗ mean magnitude out of eclipse; ‘:’ denotes an uncertain value; b observations taken with the SAAO CCD.
| Object | Type | Run No. | Date of obs. | HJD of first obs. | Length | Tel. | r | |
| (start of night) | (+2450000.0) | (h) | (s) | (mag) | ||||
| SSS0617-36 | CV | S8013 | 2010 Nov 24 | 5525.39167 | 2.23 | 30 | 40-in | 17.6 |
| S8015 | 2010 Nov 25 | 5526.39259 | 3.45 | 40,45 | 40-in | 17.7 | ||
| S8017 | 2010 Nov 26 | 5527.48668 | 2.52 | 40 | 40-in | 17.7 | ||
| S8020 | 2010 Nov 27 | 5528.48484 | 2.91 | 30 | 40-in | 17.7 | ||
| S8029 | 2010 Dec 03 | 5534.35377 | 5.66 | 20 | 40-in | 17.9 | ||
| CSS0810+00 | Polar | S7915 | 2010 Mar 18 | 5274.25067 | 4.21 | 20 | 74-in | 18.1 |
| S7917 | 2010 Mar 19 | 5275.24505 | 2.81 | 20 | 74-in | 18.3 | ||
| S7923 | 2010 Mar 21 | 5277.24549 | 3.15 | 20 | 74-in | 18.3 | ||
| S7937 | 2010 Apr 02 | 5289.25213 | 2.03 | 60 | 40-in | 18.2 | ||
| CSS0826-00 | DN | S7892 | 2009 Dec 21 | 5187.44515 | 3.60 | 90 | 74-in | 20.1∗ |
| eclipsing | S7943 | 2010 Apr 06 | 5293.23279 | 3.49 | 90 | 40-in | 19.7∗ | |
| S7946 | 2010 Apr 07 | 5294.22280 | 3.42 | 90 | 40-in | 19.9∗ | ||
| S7957 | 2010 Apr 11 | 5298.21867 | 2.13 | 90 | 40-in | 19.9∗ | ||
| CSS1028-08 | DN | S7918 | 2010 Mar 19 | 5275.40553 | 2.41 | 6 | 74-in | 16.1 |
| S7921 | 2010 Mar 20 | 5276.38365 | 3.87 | 10,15 | 74-in | 17.5 | ||
| S7924 | 2010 Mar 21 | 5277.39139 | 4.25 | 20 | 74-in | 19.0 | ||
| CSS1300+11 | DN | S7971 | 2010 May 21 | 5338.31041 | 3.15 | 55 | 74-in | 19.9 |
| S7987 | 2010 Jun 05 | 5353.21030 | 4.14 | 65 | 74-in | 19.7 | ||
| S7989 | 2010 Jun 06 | 5354.22694 | 2.41 | 65 | 74-in | 19.8 | ||
| S7991 | 2010 Jun 07 | 5355.21884 | 2.22 | 65 | 74-in | 19.6 | ||
| CSS1321+01 | DN | S7935 | 2010 Apr 01 | 5288.43811 | 3.39 | 100 | 40-in | 19.4 |
| = HV Vir | S7939 | 2010 Apr 02 | 5289.48174 | 3.45 | 100 | 40-in | 19.5 | |
| S7944 | 2010 Apr 06 | 5293.38817 | 4.17 | 100 | 40-in | 19.5 | ||
| S7947 | 2010 Apr 07 | 5294.37465 | 4.47 | 100 | 40-in | 19.4 | ||
| S7950 | 2010 Apr 08 | 5295.37400 | 1.61 | 100 | 40-in | 19.5 | ||
| CSS1404-10 | DN | S7833 | 2009 Feb 27 | 4890.58682 | 1.00 | 60 | 74-in | 19.6∗ |
| eclipsing | S7848 | 2009 Mar 20 | 4911.45607 | 3.75 | 15 | 74-in | 16.6∗ | |
| S7851 | 2009 Mar 21 | 4912.46066 | 4.76 | 15 | 74-in | 17.3∗ | ||
| S7853 | 2009 Mar 22 | 4913.43818 | 2.15 | 30 | 74-in | 18.4∗ | ||
| S7858 | 2009 Mar 23 | 4914.48481 | 4.16 | 30 | 74-in | 18.8∗ | ||
| S7862 | 2009 Jun 12 | 4995.21939 | 2.63 | 45 | 74-in | 19.4∗ | ||
| CSS1443-17 | DN | S7865 | 2009 Jun 17 | 5000.19997 | 4.28 | 60 | 74-in | 19.1 |
| S7869 | 2009 Jun 18 | 5001.20840 | 3.50 | 60 | 74-in | 19.1 | ||
| CSS1503-22 | Polar | S7925 | 2010 Mar 21 | 5277.58370 | 1.78 | 90 | 74-in | 17.2 |
| S7929 | 2010 Mar 22 | 5278.60089 | 1.57 | 55 | 74-in | 17.2 | ||
| S7931 | 2010 Mar 23 | 5279.52952 | 3.01 | 20 | 74-in | 17.5 | ||
| S7962 | 2010 Apr 12 | 5299.48901 | 4.05 | 30 | 40-in | 17.2 | ||
| S7965 | 2010 Apr 13 | 5300.45963 | 4.50 | 30 | 40-in | 17.3 | ||
| CSS1528+03 | DN | S7940 | 2010 Apr 02 | 5289.63048 | 0.60 | 20 | 40-in | 17.0 |
| S7956 | 2010 Apr 10 | 5297.45581 | 4.40 | 90 | 40-in | 19.5 | ||
| S7959 | 2010 Apr 11 | 5298.41794 | 5.73 | 90 | 40-in | 19.3 | ||
| S7961 | 2010 Apr 12 | 5299.41131 | 1.70 | 90 | 40-in | 19.9 | ||
| CSS1626-12 | DN | S7985 | 2010 Jun 04 | 5352.40913 | 4.43 | 90 | 74-in | 20.4∗ |
| eclipsing | S7988 | 2010 Jun 05 | 5353.40403 | 3.95 | 90 | 74-in | 20.3∗ | |
| S7990 | 2010 Jun 06 | 5354.41289 | 3.05 | 90 | 74-in | 20.4∗ | ||
| CSS2325-08 | DN | S7814 | 2008 Oct 15 | 4755.26078 | 1.90 | 60 | 74-in | 19.3: |
| = EG Aqr | S7815 | 2008 Oct 16 | 4756.25083 | 4.58 | 30 | 74-in | 19.3: | |
| S7817 | 2008 Oct 17 | 4757.24637 | 5.50 | 60 | 74-in | 19.3: | ||
| S7819 | 2008 Oct 18 | 4758.24330 | 6.31 | 60 | 74-in | 19.2: | ||
| S7821 | 2008 Oct 19 | 4759.25972 | 4.02 | 60 | 74-in | 19.3: | ||
| S7824 | 2008 Oct 20 | 4760.38167 | 1.22 | 60 | 74-in | 19.4: |
Notes: DN = Dwarf Nova; is the integration time; ∗ mean magnitude out of eclipse; ‘:’ denotes an uncertain value.
2.1 SDSS0805+07 (SDSS J080534.49+072029.1)
SDSS0805+07 was announced as a CV in paper VI of the Sloan Digital Sky Survey series (Szkody et al. 2007) where it is listed at magnitude and = 0.73. The SDSS spectrum contained signs of an early type K absorption spectrum, suggesting that the orbital period would be quite long. The later paper by Gänsicke et al. (2009) on orbital periods of SDSS CVs does not include any further observations of this star.
Our photometric observations of SDSS0805+07 are listed in Tab. 1 and the light curves are shown in Fig. 1. The Fourier transform of the data is shown in Fig. 2 where we have identified the highest peak as twice the orbital frequency (, where ). We chose this because of the presence of the significant signal and a weak signal which shows in the light curve as a slightly larger amplitude for alternate maxima. This choice of orbital period is also driven by the K absorption spectrum mentioned above; the light curve is evidently substantially affected by the ellipsoidal variation of the secondary. The ephemeris for minimum light is
| (1) |


2.2 SDSS0904+03 (SDSS J090403.49+035501.2)
SDSS0904+03 was listed as a CV in paper III of the SDSS series (Szkody et al. 2004) where it was shown to be a shallow eclipsing system with min and prominent white dwarf absorption lines evident in the spectrum. Later photometry by Woudt et al. (2005) showed possible low amplitude (24 mmag) variations with a period s, classifying it as a candidate CV/ZZ star - i.e. a CV containing a nonradially pulsating white dwarf (a ZZ Cet star). Our observations are listed in Tab. 1, the individual light curves are shown in Fig. 3 and an average light curve for the March 2005 runs is shown in Fig. 4, which is typical of a low mass transfer dwarf nova. An FT of the whole data set provides min and the eclipse ephemeris
| (2) |


There are no significant peaks in the FTs at higher frequencies in our larger data set, so SDSS0904+03 appears not to be a pulsating system. We now think that the earlier tentative detection of power at 740 s was caused by a high harmonic of the eclipse profile.
2.3 SDSS0919+08 (SDSS J091945.11+085710.0)
SDSS0919+08 was recognised as a CV in paper IV of the SDSS series (Szkody et al. 2005), where it is given as magnitude . The spectrum shows Balmer emission with underlying absorption spectrum of a white dwarf. From a small number of spectra an orbital period of min was deduced. Mukadum et al. (2007) detected a periodic signal in the light curve which gave min for and found a further low amplitude (%) brightness modulation near 260 s in 5 out of 6 light curves, which might be a doublet with splitting s. They estimated an effective temperature of 13 000 K for the white dwarf. The nature of the 260 s periodicity was not ascertained - it could be a rotationally or magnetically split nonradial oscillation, or directly related to a spin period.
Dillon et al. (2008) found an orbital period of min from a 3 h high speed photometry run on one night with the Calar Alto 2.2-m reflector, and Szkody et al. (2010) found a possible harmonic at 40.75 min with the Hubble Space Telescope but no high frequency modulation at all with various ground based telescopes in 2007/2008. Their conclusion was that SDSS0919+08 had at least temporarily stopped pulsating.
Our photometric runs on SDSS0919+08 are listed in Tab. 1; they were made mostly in 2004 February, 2005 February and 2007 January. The FTs are shown in Fig. 5. We saw no modulation above 5% in 2004 and none above 3% in 2007 (in agreement with Szkody et al. observations described above) but in 2005 February there was not only a % modulation at 260 s but also a 6% amplitude at 214 s. The first of these is a spike and is at the period often seen before, so there is no doubt about its reality. For the shorter period oscillation we show in Fig. 6 an amplitude () - phase () diagram for runs S7561, S7564 and S7572, respectively, obtained in 2005 February. These illustrate the high coherence of the 214-s oscillation () with a drift in frequency that is commonly seen in oscillation white dwarfs with unresolved multiplets.
The presence of two simultaneous frequencies excludes a simple white dwarf rotation model for SDSS J0919+08, but is indicative of nonradial oscillations in the white dwarf.


2.4 SDSS1519+06 (SDSS J151915.86+064529.1)
SDSS1519+06 is another object in the Sloan data base, listed at and , which has colours similar to that of CVs. We observed it on three nights in 2007 March (see Tab. 1) using the SAAO CCD; the light curves are displayed in Fig. 7 and show very active flickering characteristic of a CV but no periodic modulations.
Since making these observations an SDSS spectrum is available on the SDSS Skyserver which shows a strong blue continuum, narrow Balmer emission lines and a strong He II emission which are characteristic of a low inclination nova-like variable.

2.5 SSS0221-26 (SSS100511:022138-261952)
SSS0221-26 is a Catalina source (100511:022138-261952) discovered at the Siding Spring Observatory in Australia. We observed it on three nights as listed in Tab. 1 and the light curves are shown in Fig. 8.
The FT shows maximum power at the fundamental and first harmonic of a 101.5-min periodicity, but the 1-d alias at 109.1 min cannot be excluded. The mean light curve at 101.5 min is shown in Fig. 9 which is again characteristic of a low mass transfer dwarf nova in quiescence. The ephemeris for maximum light is:
| (3) |


2.6 CSS0332+02 (CSS091121:033232+020439)
CSS0332+02 is a Catalina source (091121:033232+020439) that has had three known outbursts, reaching , in 2006 October, 2007 October and 2009 November. At quiescence it is fainter than in the Catalina light curve. Our observations are listed in Tab. 1 and were obtained less than a month after the last recorded outburst, when CSS0332+02 was at . The light curves are shown in Fig. 10 and exhibit profiles typical of orbital or superhump modulations. They turn out be a combination of both. The FT of the full data set is shown in the upper left panel of Fig. 11 - with the window pattern next to it. The highest peak in the alias pattern in the FT is marked and its first harmonic is marked 2; these are the only two components of the two patterns that have a 2:1 frequency ratio within the small errors involved (Hz). Pre-whitening with these two frequencies leaves the FT shown in the lower panel of Fig. 11 - revealing a further alias pattern (which was easily seen in the original total FT), where we have marked the maximum component . In addition there is a very low amplitude residual alias pattern labelled . The frequencies are given in Tab. 2.


With this choice the implied value of the orbital frequency Hz is roughly midway between the frequencies and , which we claim are positive and negative superhumps. Note that the positive superhump excess and the negative superhump deficiency are close to values for an SU UMa type dwarf nova with min (Patterson et al. 2005). Note also that the largest modulation is the positive superhump, and its strong first harmonic is typical of the non-sinusoidality of such superhumps.
| ID | Frequency | Period | Ampl. |
|---|---|---|---|
| (Hz) | (h) | (mag) | |
| 184.81 0.03 | 1.503 | 0.119 0.006 | |
| 369.27 0.04 | 0.752 | 0.104 0.006 | |
| 193.08 0.05 | 1.439 | 0.067 0.005 | |
| 378.23 0.11 | 0.734 | 0.036 0.005 |
Our interpretation of this data set is that CSS0332+02 is a dwarf nova showing both positive and negative superhumps (and the first harmonic of ) in quiescence. We arrived at this surprising conclusion partly with the help of the work of Olech, Rutkowski & Schwarzenberg-Czerny (2009) who found that SDSS2100+00 has persistent negative superhumps in quiesence, and moreover was the third such dwarf nova “bihumper” to be found, the others being V503 Cyg (Harvey et al. 1995) and BF Ara (Olech, Rutkowski & Schwarzenberg-Czerny 2007). But in SDSS2100+00, V503 Cyg and BF Ara the positive superhumps are only seen during superoutbursts. The uniqueness of this interpretation encourages further extensive observations.
2.7 CSS0334-07 (CSS091027:033450-071048)
CSS0334-07 is CSS091027:033450-071048 with a quiescent magnitude ; the Catalina light curve shows outbursts to on a time scale of 200 d. This star is also listed in the Sloan Survey as SDSS J033449.87-071047.8 (Szkody et al. 2007), identified as a dwarf nova with (caught by SDSS in outburst) with a candidate orbital period of somewhat less than 2 hours derived from spectroscopy. Kato (2009) reported a superhump period of 107.8 min.
Our observations are listed in Tab. 1; the light curves seen in Fig. 12 possess typical flickering with a range of mag, but no modulation on time scales of the proposed orbital period.

2.8 CSS0345-01 (CSS090219:034515-015216)
CSS0345-01 was first reported in the CSS survey in 2009 February as CSS090219:034515-015216. It has a quiescent magnitude around and has had seven recorded outbursts since 2005, reaching up to .
We observed CSS0345-01 during quiescence in 2010 November (see Tab. 1) when it was around . The light curves are shown in Fig. 13 and resemble those of SSS0221-26, characteristic of a low mass transfer dwarf nova. The FT of the combined observing runs (Fig. 14) reveals two distinct peaks at Hz and Hz, which we assign as the fundamental and first harmonic, respectively, of the orbital frequency. The average light curve of CSS0345-01, folded on the orbital period of 101.1 min, is shown in Fig. 15. The emphemeris for maximum light is:
| (4) |


2.9 SSS0617-36 (SSS100511:061754-362655)
SSS100511:061754-362655 (SSS0617-36 hereafter) was first reported by the SSS survey in 2010 May. It has regular outbursts reaching outburst amplitudes of up to 4 magnitude, varying from to 14.2.
We observed SSS0617-36 during quiescence in 2010 November when the system averaged around . The light curves are shown in Fig. 16. The light curves are characterised by a large-amplitude orbital modulation (by about a factor of 2 in brightness) and low-amplitude flickering. The orbital modulation, clearly shown in the average light curve (Fig. 17), is non-sinusoidal with power in the Fourier transform at the fundamental frequency (80.72 Hz) and the first two harmonics (161.53 Hz and 242.20 Hz, respectively). The light curve is unusual for a CV and at this stage we cannot provide a specific class. The orbital emphemeris for maximum light is
| (5) |


2.10 CSS0810+00 (CSS100108:081031+002429)
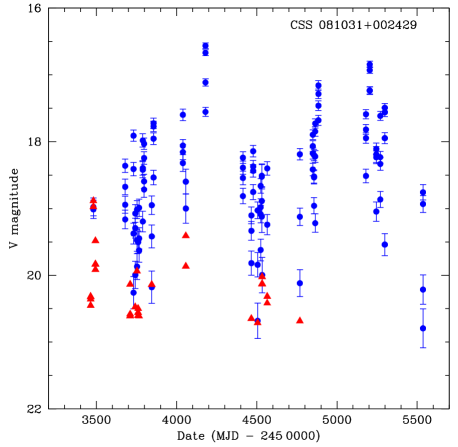
CSS0810+00 is CSS100108:081031+002429; its long-term light curve shows brightness variations from to on a range of time scales (Fig. 18, data kindly provided by Dr. Andrew Drake). From that light curve alone it would be difficult to state what kind of CV this is. Our observations are listed in Tab. 1 and the light curves are given in Fig. 19 and were obtained during a high state of CSS0810+00. There are deep minima with depths 1.5 mag and irregular profiles recurring with period 116.15 min. The light curve is very similar to that of the polar V834 Cen in the V band which also has mag range around the orbit (Sambruno et al. 1991). This is compatible with the long term light curve shown in Fig. 18. The ephemeris for minimum light is
| (6) |

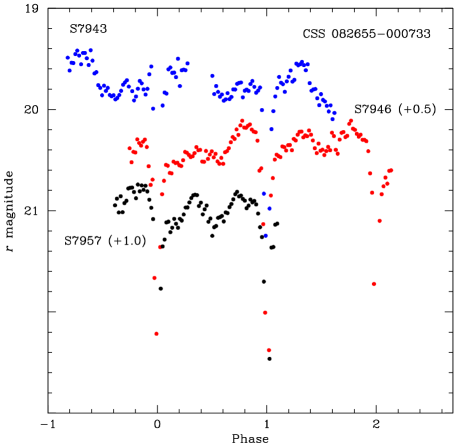
2.11 CSS0826-00 (CSS080306:082655-000733)
CSS0826-00 is CSS080306:082655-000733 and has had two observed outbursts raising it from quiescent magnitude to 16.3 and 17.7 respectively. Our observations were made at quiescence with and are listed in Tab. 1. The light curves, displayed in Fig. 20, show that CSS0826-00 is an eclipsing system, descending to at mid-eclipse with min. The eclipse ephemeris is
| (7) |
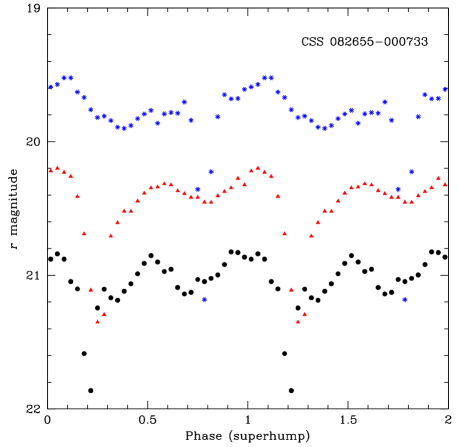
Signs of a superhump drifting through the light curve can be seen in Fig. 20, and the FT confirms this, giving a negative superhump period of 83.63 min; the superhump ephemeris is
| (8) |
The nightly-averaged light curves folded on the superhump ephemeris are shown in Fig. 21. Thus CSS 0826-00 is another SU UMa type dwarf nova with negative superhumps persisting in quiescence, with a negative superhump deficiency of .
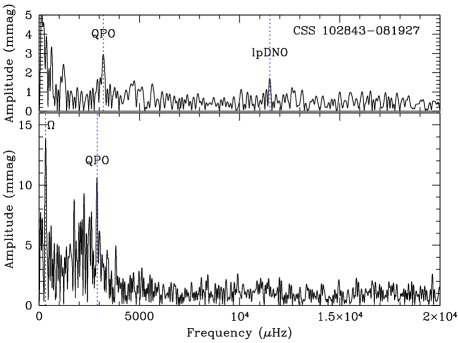
2.12 CSS1028-08 (CSS090331:102843-081927)
CSS1028-08 is CSS 090331:102843-081927 which in the CSS light curve has outbursts at intervals as short as 300 d, but with frequent short-lived dips to . Our observations are listed in Tab. 1 and the light curves are shown in Fig. 22. CSS1028-08 was descending to quiesence from an outburst (which was missed in the Catalina survey). We do not see any excursions to faint magnitudes in quiescence, and are unable to ascertain the cause of the ones in the CSS light curve and suspect that because the star has a close companion the CSS photometry has difficulty in resolving the two. In our photometry the two stars are completely resolved.
CSS1028-08 was observed during superoutburst by Kato et al (2009), who named it OT J1028 and found a superhump period of 54.85 min, which puts it in the rare class of ultra-short period CVs, similar to V485 Cen and EI Psc, probably with a lowered H/He abundance ratios. The absence of superhumps in run S7918 suggests we observed CSS1028-08 during a normal outburst.
The FTs of runs S7918 and S7921 are shown in Fig. 23. The highest peak in the FT of run S7921 is at 52.1 0.6 min, which we identify as the orbital period; this gives a positive superhump excess of . The FT of run S7918 shows two short-period modulations which are at 312 s and 86.9 s, which we interpret respectively as a quasi-periodic oscillation (QPO) and a longer-period dwarf nova oscillation of the kinds frequently seen in outbursting dwarf novae (Warner 2004). A similar peak at 345 s is seen in the FT of run S7921, with a lot of additional power at nearby frequencies. The reason for the complexity of the FT is seen in the phase - amplitude diagram shown in Fig. 24; it is clear that there is a persistent oscillation which both drifts and jumps in frequency, again typical of such rapid oscillations. Of particular interest is the phase change seen in Fig. 24 between HJD 245 5276.45 and 245 5276.50 where the QPO period changed from 387 s to 345 s; their frequency difference is approximately equal to the orbital frequency and suggests a temporary change from a sidereal to a synodic (reprocessed) QPO signal.


2.13 CSS1300+11 (CSS080702:130030+115101)
CSS1300+11, is CSS080702:130030+115101 and shows a superoutburst in the CSS long-term light curve, reaching in 2008 July from a quiescent level of . It was observed by Kato et al (2009) who measured a superhump period of 92.72 min. We observed it in 2010 June to find the orbital period. Our observations are listed in Tab. 1 and the average light curve is shown in Fig. 25. The orbital period is 90.24 min, which gives a fractional superhump period excess of ; this is in agreement with the general correlation between and (Patterson et al. 2003). The orbital ephemeris for the time of maximum brightness is
| (9) |

2.14 HV Vir (CSS080227:132103+015329)
CSS1321+01 = HV Vir, is CSS 080227:132103+015329, had a superoutburst in 2002 January after a decade of quiescence, reaching in the CSS light curve, from a general quiescent level of . This star has been well observed during supermaxima, so its superhump period is well determined at 83.82 min, but the observations at quiesence by Patterson et al. (2003) showed two periodicities in the FT: a double humped definite one at min which is and another, less certain at 128.6 min or its alias at 117.9 min.
We observed HV Vir in quiescence in 2010 April; our observations are listed in Tab. 1 and the light curves are shown in Fig. 26. The FT of these light curves, shown in Fig. 27, contains a strong signal at the first harmonic of the orbital frequency (i.e. at ) and a detectable signal at itself; but in addition there is a window pattern at lower frequency, stronger than the modulation, with period 126.0 min or 117.4 min. Within the uncertainties these are identical to the signal and its alias observed by Pattersion et al. These independent data sets confirm the existence of a luminosity modulation at min or its alias at 117 min, the origin of which is not known.


2.15 CSS1404-10 (CSS080623:140454-102702)
CSS1404-10, CSS080623:140454-102702) has a quiescent brightness level of in the CSS light curve, with an outburst to and others to at intervals of d. Our observations were made at quiescence in 2009 February and June, and during the decline of a superoutburst in 2009 March: they are listed in Tab. 1. The light curves are displayed in Fig. 28 and show narrow eclipses more than one magnitude deep in quiescence. The orbital period is 85.794 min and the eclipse ephemeris is
| (10) |
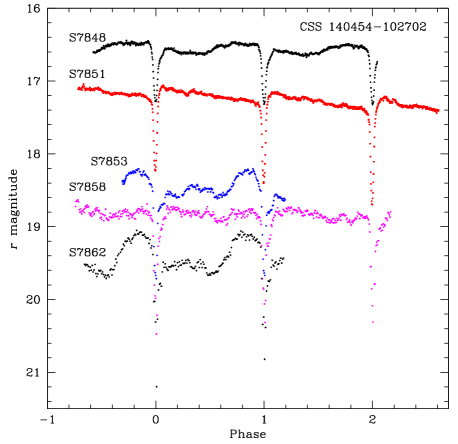
Superhumps were evident during the superoutburst. Their period is 87.81 min, with a resultant superhump period excess of . The average superhump light curve, folded on the superhump period and with the orbital eclipses excised, showing the typical saw-tooth shape, is given in Fig. 29.

2.16 CSS1443-17 (CSS090418:144342-175550)
CSS1443-17, or CSS 090418:144342-175550, has one superoutburst in the CSS light curve, in 2009 April, which was observed by Kato et al (2009), where it is listed as OT J1443, and who found superhumps with a period of 103.77 min. We observed it at quiescence in 2009 June - the observations are listed in Tab. 1 - and found it to have a strong orbital modulation with a range of 0.3 mag, as seen in the average light curve in Fig. 30. The orbital period is 101.1 min and the ephemeris for maximum light is
| (11) |
The superhump excess is .

2.17 CSS1503-22 (CSS100216:150354-220711)

CSS1503-22, known as CSS100216:150354-220711, has a CSS light curve in which the star was at an average brightness for about 5.5 years and then went into a high state with large excursions at an average . Our observations were made during the high state and are listed in Tab. 1. The light curves are shown in Fig. 31, phased on the 133.38 min period that we found in the FT. The existence of distinct window patterns at the first and third harmonics enables a unique choice among the aliases of the fundamental frequency. From its general optical behaviour we suspected this star to be a polar. We communicated the discovery to Julian Osborne at Leicester University and he confirmed from Swift X-Ray observations that it is indeed a magnetically accreting CV. Our ephemeris for the times of minimum light is
| (12) |
2.18 CSS1528+03 (CSS090419:152858+034912)
CSS1528+03, or CSS 090419:152858+034912 in the CSS catalogue, is also in the Sloan survey second release (Szkody et al. 2003) as SDSS J1528+0349, where its spectrum shows it be a dwarf nova. Its CSS light curve shows variations from = 18.7 to with rare outbursts to 17th magnitude. Our photometric observations, the first of which was taken during outburst, are listed in Tab. 1, and the two longest runs (both at quiescence) are shown as light curves in Fig. 32. There is strong flickering but no obvious modulation within our longest ( h) run. Either this CV has a very long orbital period or it is of low inclination.

2.19 CSS1626-12 (CSS090419:162620-125557)
CSS1626-12 is CSS090419:162620-125557 and has a CSS light curve which is undersampled but shows outbursts to on time scales d. It is not detectable by CSS at quiesence, reaching . Our observations are listed in Tab. 1 and show that its un-eclipsed magnitude is in fact at . The average light curve is given in Fig. 33, where narrow eclipses to are seen, recurring on the period min, with an ephemeris
| (13) |
The light curve has a low amplitude orbital hump peaking at orbital phase 0.8 before being cut into by the eclipse.

2.20 EG Aqr (CSS080101:232519-081819)
CSS2325-08, or CSS 080101:232519-081819, is one of the first CVs to be found in the CSS survey and was a rediscovery of the known dwarf nova EG Aqr. Imada et al (2008) observed a superoutburst in EG Aqr in 2006 November and found a superhump period of 113.51 min. We observed EG Aqr at a quiescence brightness of in 2008 October; the details are given in Tab. 1 and the light curves in Fig. 34. The FT of the combination of the best runs, S7817, S7819 and S7821, from consecutive nights is shown in Fig. 35.
In the FT there is only one pair of frequencies that are at a 2:1 ratio, which gives a period of 109.4 min and its first harmonic, which are indicated in Fig. 35 by the dashed vertical lines. We identify this with which gives a . The ephemeris for maximum light is:
| (14) |


3 Discussion
Our observations have assessed the properties of a further 20 faint CVs, resulting in the direct measurement of 15 orbital periods; the measurement of 2 further positive superhump periods with consequent determination of 3 fractional superhump excesses; and the measurement of two negative superhump periods. Among these are CSS 0322+02 which has both positive and negative superhumps in quiescence, and CSS 0826-00, an eclipsing system with negative superhumps in quiescence, which potentially gives the possibility of deducing the brightness distribution of the negative superhump source.
CSS 0810+00 and CSS 1503-22 are new polars. SDSS 0919+08 has a known 260 s brightness modulation that could be interpreted either as non-radial pulsation or rotation; our discovery of an occasional additional 214 s periodicity points to the former explanation. CSS 0802+01 (HV Vir) had a previously suspected periodic signal near 120 min; we have observed a similar modulation, the origin of which is not known. A summary of the newly measured periods is included in Tab. 3.
| Object | Type | r | Remarks | |||
|---|---|---|---|---|---|---|
| (h) | (h) | (h) | ||||
| SDSS0805+07 | CV | 5.489 (12) | 17.9 | |||
| SDSS0904+03 | CV | 1.433358 (1) | 19.2 | Eclipsing | ||
| SSS0221-26 | DN | 1.692 (2) | 19.3: | Possible alias at 1.818 h. | ||
| CSS0332+02 | DN SU | 1.469 (1) | 1.5030 (2) | 1.4387 (4) | 20.2 | Superhumps in quiescence |
| CSS0345-01 | DN | 1.684 (1) | 18.6: | |||
| SSS0617-36 | CV | 3.4404 (12) | 17.7 | |||
| CSS0810+00 | Polar | 1.9358 (1) | 18.2 | High state | ||
| CSS0826-00 | DN SU | 1.4342 (2) | 1.394 (1) | 20.0 | Eclipsing, superhumps in quiescence | |
| CSS1028-08 | DN | 0.868 (10) | [0.914] | 16.1-19.0 | from Kato et al. (2009) | |
| CSS1300+11 | DN SU | 1.5041 (2) | [1.545] | 19.8: | from Kato et al. (2009) | |
| CSS1404-10 | DN SU | 1.42990 (1) | 1.464 (1) | 16.6-19.6 | Eclipsing, superhumps in outburst | |
| CSS1443-17 | DN | 1.685 (4) | [1.7295] | 19.1 | from Kato et al. (2009) | |
| CSS1503-22 | Polar | 2.2229 (4) | 17.2 | High state | ||
| CSS1626-12 | DN | 1.811 (1) | 20.4 | Eclipsing | ||
| CSS2325-08 | DN SU | 1.823 (2) | [1.892] | 19.3 | from Imada et al. (2008) |
∗ Uncertainties are given between brackets for the last significant decimal(s). † Literature values are shown between square brackets.
Population syntheses combined with evolutionary computations of binary stars passing through the common envelope stage have long predicted that there should be a maximum space density of CVs near the minimum orbital period at min, which is where = 0 (e.g. Kolb & Baraffe 1999). But until recently this “period spike” had not been confirmed observationally. However, Gänsicke et al. (2009), from large numbers of faint CVs newly discovered in the SDSS survey, at last found evidence for the spike – because it occurs at small where the mass transfer rate is low the CVs have low accretion luminosity (typically ), it is necessary to reach fainter than before the predicted population can be sampled. This was verified in another way by Wils et al. (2009) who cross-correlated a number of photometric and astrometric catalogues, finding 64 new CV candidates which, from the outburst amplitudes and frequencies of these and CRTS objects, imply that the CVs of faint apparent magnitudes are not simply more distant – there must also be a population of intrinsically faint systems. In affirmation, the CVs found in the Hamburg Quasar Survey, which have , fail to reveal the latter population (Aungwerojwit & Gänsicke 2009). Similarly, the CVs in the Calán-Tololo survey, which reaches down only to , have orbital periods that resemble those found in early surveys (Augusteijn et al. 2010).
The CRTS provides an independent source of faint CVs. Its requirement for a brightness range mag, together with its lower magnitude limit of , and the normal dwarf nova ranges of 2 – 5 mag and the rare SU UMa which range up to 8 mag, means that effectively quiescent magnitudes are sampled from to 26, but they are probably biased towards the upper end of the luminosities as that is where the outburst frequency should be largest.
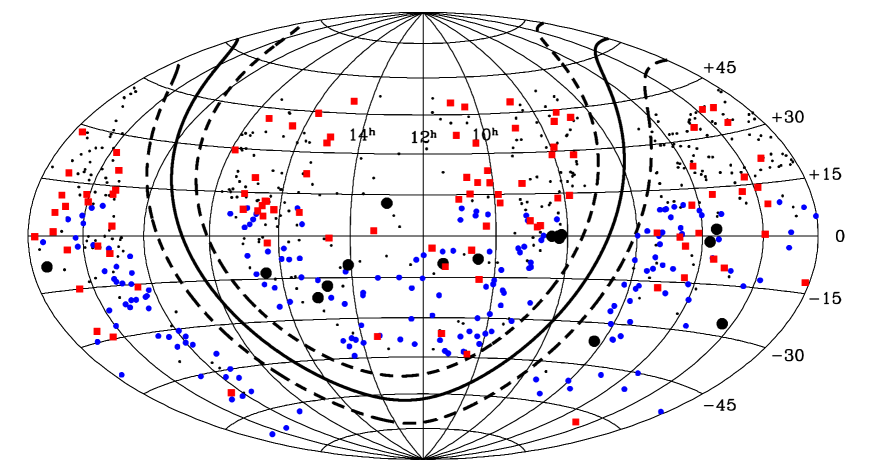
In Fig. 36 we show the on-sky distribution of all the CVs identified in the CRTS in an equatorial aitoff projection; the CRTS avoids a zone of around the Galactic Plane and generally finds CVs between declinations of and . All CVs are shown as small (black) dots in this figure, with additional symbols for the 100 CVs that have measured superhump or orbital periods in the literature (red filled squares), those that are observable with the 40-in and 74-in reflectors from the Sutherland station of the SAAO (blue filled circles; declinations south of ) and the 15 CVs with new periods determined in the course of the UCT CCD CV survey (black large filled circles).
We have generated a histogram using the CRTS source catalogue
and all previous determinations (or values, converted to
with the Gänsicke et al. (2009) formula) supplemented with the
new measurements from Tab. 3. Orbital periods are available
for 115 of the known CRTS CVs, with 100 systems recorded in the literature
(either in the Ritter & Kolb (2003) catalogue, or in
vsnet-alerts222http://ooruri.kusastro.kyoto-u.ac.jp/pipermail/
vsnet-alert/, where the
latter predominantly report superhump periods) and an additional 15 orbital periods
derived from the UCT CCD CV survey.
Although the sample contains a small number of SDSS CVs that were already known
before the CRTS survey began, it is almost independent and represents CVs found
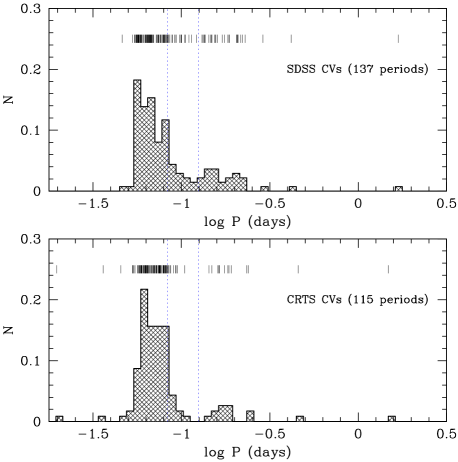
purely by the CRTS search technique. The result is shown in the lower panel of
Fig. 37, where the SDSS distribution as found by Gänsicke et al. (2009)
from 137 systems is also displayed (top panel). The CRTS histogram is similarly peaked
but narrower than the SDSS histogram below the orbital period gap; overall both distributions
reveal similar percentages of CVs in the 1.29 – 1.55 h period bins, namely 30% (CRTS)
versus 32% (SDSS).
According to current understanding of the evolution of CVs those with between the minimum (‘bounce’) period and h should be a mixture of pre- and post- bounce systems, the latter having degenerate secondaries and very low . Evidence for this is slowly increasing: Littlefair et al. (2008) have found three CVs where the secondaries are brown dwarfs, Patterson (2011) has given an extensive discussion and a list of possible candidates. This prediction is based on gravitational radiation (GR) being the driving mechanism for orbital evolution at short periods. Although that may be the only way that orbital angular momentum is lost on long time scales, it is clear that there is at least one other parameter that determines the present in CVs: the spread in absolute magnitudes of CVs below the orbital period gap (see, e.g., figure 12 of Warner 1987) shows that ranges over more than an order of magnitude, and the mean rate is several times that given by GR (Gänsicke et al. 2009). With the rapidly increasing number of known short period CVs it may become possible to investigate this more fully. We point out two relevant observational points:
The ER UMa stars lie at the high end of the range, they have superoutburst intervals, , in the range 20 – 50 d and normal outburst intervals, , d; only five members are currently known. They have the short orbital periods typical of SU UMa stars but appear isolated from the normal SU UMa stars by their short outburst intervals (Kato et al. 2003). They almost certainly must have exceptionally large (though additional parameters seem to be required - see discussion in Kato et al.); an analogy to the Z Cam stars at longer has been made (Warner 1995b). The few known ER UMa stars are probably only a small fraction of the true population - they are so variable that low cadence observations can fail to characterise them; indeed, the available CRTS light curves do not show their unusual outburst properties. The situation is similar to that of the earliest of them to be discovered, V1159 Ori, which was known as an irregular blue variable since 1906 but could not be appreciated fully until the 1990s. We expect that higher cadence and accepted amplitude range lowered to mag will provide many more examples, and perhaps fill the gap between the ER UMa stars and the standard SU UMa stars.
More generally, we can use the CRTS light curves to segregate the dwarf novae into outburst classes. The light curves cover more than 5 years in a consistent way for all objects - they use all clear weather for 21 nights of each lunation and reach a cut-off magnitude . Although outbursts will be missed, the same fraction will be lost independent of frequency. We have simply assigned class 1 to light curves showing only one outburst, class 2 to two outbursts, and class 3 to outbursts. In the simplest interpretation these would correspond respectively to very low, low, and medium values.
The histograms of the three classes are shown in Fig. 38, excluding nine confirmed polars in the sample of 115 CRTS CVs with observed periods. There is a marked correlation between distribution and outburst class - in the sense that lower outburst frequencies are shifted towards shorter . But this trend should not arise from the simplest expected behaviour - if GR is operating alone then nearly constant is predicted (see equation 9.20 and figure 9.2 of Warner (1995a)) and the time taken to fill dwarf nova accretion discs between outbursts would be independent of . Other factors need to be taken into account, however - the space density of CVs per unit interval of is inversely proportional to the long term mean of (which would cancel with outburst frequency being directly proportional to to leave no dependence on average), but outburst frequency is determined for each system by its current - and as mentioned above this can be very different from the GR value and may depend on the past history of each system (e.g. when last it was a nova, in the hibernation scheme of things - see section 9.4.3 of Warner (1995a)).
A final conclusion is that the predictions of CV population studies are now beginning to be confirmed by observation - it required surveys reaching fainter than magnitude to detect the large population of highly evolved systems. Therefore the predicted end points of CV evolution should also be taken seriously - large numbers of cool Earth-sized white dwarfs with Jupiter-sized secondaries in h orbits, about 20% of which should show total eclipses.

Acknowledgments
PAW and BW acknowledge support from the University of Cape Town (UCT) and from the National Research Foundation of South Africa. PAW furthermore acknowledges financial support from the World University Network. DdB thanks the South African Square Kilometer Array project and UCT for financial support. SM received support from the National Astrophysics and Space Science Programme. We kindly thank Denise Dale for observations of SDSS0919+08. This paper uses observations made at the South African Astronomical Observatory (SAAO).
References
- [1] Abazajian K.N., Adelman-McCarthy J.K., Agüeros M.A., et al., 2009, ApJS, 182, 543
- [2] Augusteijn T., Tappert C., Dall T., Maza J., 2010, MNRAS, 405, 621
- [3] Aungwerojwit A., Gänsicke B.T., 2009, ASP Conf. Ser. 404, 276
- [4] Dillon M., Gänsicke B.T., Aungwerojwit A., et al., 2008, MNRAS, 386, 1568
- [5] Drake A.J., Djorgovski S.G., Mahabal, A., et al., 2009, ApJ, 696, 870
- [6] Gänsicke B.T., Dillon M., Southworth J., et al., 2009, MNRAS, 397, 2170
- [7] Harvey D., Skillman D.R., Patterson J., Ringwald F.A., 1995, PASP, 107, 551
- [8] Imada A., Stubbings R., Kato T., et al., 2008, PASJ, 60, 1151
- [9] Jester S., Schneider D.P., Richards, G.T., et al., 2005, AJ, 130, 873
-
[10]
Kato T., 2009, http://ooruri.kusastro.kyoto-u.ac.jp/
mailarchive/vsnet-alert/11028 - [11] Kato T., Bolt G., Nelson P., Monard B., Stubbings R., Pearce A., Yamaoka H., Richards T., 2003, MNRAS, 341, 901
- [12] Kato T., Imada A., Uemura M., et al., 2009, PASJ, 61, S395
- [13] Kolb U., Baraffe I., 1999, MNRAS, 309, 1034
- [14] Landolt A., 1992, AJ, 104, 340
- [15] Littlefair S.P., Dhillon V.S., Marsh T.R., Gänsicke B.T., Southworth J., Baraffe I., Watson C.A., Copperwheat C., 2008, MNRAS, 388, 1582
- [16] Mukadam A.S., Gänsicke B.T., Szkody P., Aungwerojwit A., Howell S.B., Fraser O.J., Silvestri N.M., 2007, ApJ, 667, 433
- [17] O’Donoghue D., 1995, Baltic Ast, 4, 517
- [18] Olech A., Rutkowski A., Schwarzenberg-Czerny, A., 2007, AcA, 57, 331
- [19] Olech A., Rutkowski A., Schwarzenberg-Czerny, A., 2009, MNRAS, 399, 465
- [20] Patterson J., 2011, MNRAS, 411, 2695
- [21] Patterson J., Thorstensen J.R., Kemp J., et al., 2003, PASP, 115, 1308
- [22] Patterson J., Kemp J., Harvey D.A., et al., 2005, PASP, 117, 1204
- [23] Ritter H., Kolb U., 2003, A&A, 404, 301 (update RKcat7.16, 2011)
- [24] Sambruno R.M., Chiapetti L., Treves A., et al., 1991, ApJ, 374, 744
- [25] Szkody P., Fraser O., Silvestri N., et al., 2003, AJ, 126, 1499
- [26] Szkody P., Henden A., Fraser O.J., et al., 2004, AJ, 128, 1882
- [27] Szkody P., Henden A., Fraser O.J., et al., 2005, AJ, 129, 2386
- [28] Szkody P., Henden A., Mannikko L., et al., 2007, AJ, 134, 185
- [29] Szkody P., Mukadam A., Gänsicke B.T., et al., 2010, ApJ, 710, 64
- [30] Warner B., 1987, MNRAS, 227, 23
- [31] Warner B., 1995a, Cataclysmic Variable Stars, Cambridge Univ. Press, Cambridge
- [32] Warner B., 1995b, Ap&SS, 226, 187
- [33] Warner B., 2004, PASP, 116, 115
- [34] Wils P., Gänsicke B.T., Drake A.J., Southworth J., 2009, MNRAS, 402, 436
- [35] Woudt P.A., Warner B., 2010, MNRAS, 403, 398
- [36] Woudt P.A., Warner B., Pretorius M.L., Dale, D., 2005, ASP Conf Ser 330, 325