Dynamically evolving Mg ii broad absorption line flow in SDSS J133356.02+001229.1
Abstract
We report a dynamically evolving low ionization broad absorption line flow in the QSO SDSS J133356.02+001229.1 (at 0.9197). These observations are part of our ongoing monitoring of low ionization broad absorption line (BAL) QSOs with the 2m telescope at IUCAA Girawali observatory (IGO). The broad Mg ii absorption with an ejection velocity of 1.7 km s-1, found in the Sloan Digital Sky Survey (SDSS) spectra, has disappeared completely in our IGO spectra. We found an emerging new component at an ejection velocity of 2.8 km s-1. During our monitoring period this component has shown strong evolution both in its velocity width and optical depth and nearly disappeared in our latest observations. Acceleration of a low velocity component seen in SDSS spectrum to a higher velocity is unlikely as the Mg ii column densities are always observed to be higher for the new component. We argue that the observed variations may not be related to ionization changes and are consistent with absorption produced by multi-streaming flow transiting across our line of sight. We find a possible connection between flux variation of the QSO and (Mg ii) of the newly emerged component. This could mean the ejection being triggered by changes in the accretion disk or dust reddening due to the outflowing gas.
keywords:
galaxies: active – quasars: general – quasar: absorption lines – quasars: individual: J133356.02+001229.11 Introduction
It is widely believed that the kinetic energy output from quasars through the outflows are as important as their radiative output. They are believed to play an important role in regulating the growth of supermassive blackholes (Silk & Rees, 1998; King, 2003) and star formation in the host galaxies (e.g., Bower et al., 2006). In addition, outflows influence the enrichment of the surrounding intergalactic medium. Therefore, it is important to understand the origin and evolution of QSO outflows. Large scale outflows manifest itself in the form of broad absorption lines (BALs) in QSO spectra. BAL QSOs comprise of up to 40% of the total QSO population (Dai et al., 2008, and references therein). The correct explanation for the observed incidence of BAL QSOs is still a subject of debate between the orientational (see for example, Hines & Wills, 1995; Goodrich & Miller, 1995; Murray et al., 1995; Elvis, 2000) and evolutionary models (see for example, Hazard et al., 1984; Becker et al., 2000).
Line variability studies of BAL QSOs are useful for understanding the physical conditions and dynamics of the gas close to the central engine. The time variability of C iv and Si iv absorption is reported in several cases (for example, Srianand & Petitjean, 2001; Lundgren et al., 2007; Gibson et al., 2008). Such a variability could be related either to variations in the ionization state or to the covering factor of the absorbing gas. However, the most interesting cases are the ones where the flow emerges afresh or shows strong dynamical evolution (i.e variation in the absorption profile and signatures of acceleration). There are five previous reports of emerging C iv BAL discovery in the literature [TEX 1726+344 (Ma, 2002), SDSS J105400.40034801.2 (Hamann et al., 2008), WPVS 007 (Leighly et al., 2009), Ton 34 (Krongold et al., 2010) and PG0935+417 (Rodríguez Hidalgo et al., 2011)]. These studies attribute the observed dynamical evolution to multiple streaming wind moving across the line of sight. Detecting an emerging Mg ii flow will be very interesting as Mg ii BALs are considered to be a possible manifestation of a QSO’s efforts to expel a thick shroud of gas and dust (Voit et al., 1993).
| Source | Instrument | Date | MJD | Exposure Time | Coverage | Resolution | S/Na |
|---|---|---|---|---|---|---|---|
| (min) | () | (kms-1) | |||||
| SDSS | 28-04-2000 | 51662 | 45x1 | 3800-9200 | 150 | 27 | |
| SDSS | 15-02-2001 | 51955 | 105x1 | 3800-9200 | 150 | 40 | |
| IGO/IFOSC 7 | 03-04-2008 | 54559 | 40x2 | 3800-6840 | 300 | 11 | |
| IGO/IFORS 1 | 26-02-2009 | 54888 | 45x3 | 3270-6160 | 360 | 21 | |
| IGO/IFOSC 7 | 26-03-2009 | 54916 | 45x3 | 3800-6840 | 300 | 12 | |
| J1333+0012 | IGO/IFOSC 7 | 19-04-2009 | 54940 | 45x2 | 3800-6840 | 300 | 5 |
| IGO/IFORS 1 | 22-01-2010 | 55218 | 45x1 | 3270-6160 | 360 | 19 | |
| IGO/IFORS 1 | 25-01-2010 | 55221 | 45x1 | 3270-6160 | 360 | 16 | |
| IGO/IFORS 1 | 14-03-2010 | 55269 | 45x3 | 3270-6160 | 360 | 16 | |
| IGO/IFOSC 7 | 06-04-2011 | 55657 | 45x3 | 3800-6840 | 300 | 19 |
a calculated over the wavelength range 5800-6200
Here, we report the first discovery of an emerging Mg ii outflow in a QSO SDSS J133356.02+001229.1(hereafter J1333+0012) at a redshift 0.9197 (Hewett et al., 2001; Trump et al., 2006). This source is part of our sample of low ionization BAL QSOs that are being spectroscopically monitored at IUCAA Girawali observatory (IGO). Our spectra revealed the emergence of a new Mg ii broad absorption component that was not present in the Sloan Digital Sky Survey(SDSS) spectra obtained 7 years earlier. We have been monitoring this new Mg ii absorption component for the past 4 years. In section 2, we provide details of the observations and data reduction. Results and discussions are presented in Sections 3 and 4 respectively.
2 Observation and Data Reduction
Our spectroscopic observations were carried out with IUCAA Faint Object Spectrograph (IFOSC) mounted on a 2m telescope at IUCAA Girawali observatory (IGO). The details of these observations together with that of the archival SDSS spectra are given in Table 1. We have used Grism #1 and Grism #7 of IFOSC in combination with a long slit having a width of 1.5 arcsec. This combinations have the wavelength coverage of 32706160 and 38006840 respectively. Typically the observations were splitted in to exposures of 45 minutes. Spectra obtained on closely separated dates were combined for better signal to noise. Cleaning of the raw frames and 1D spectral extraction were carried out using the standards procedures in IRAF111IRAF is distributed by the National Optical Astronomy Observatories, which are operated by the Association of Universities for Research in Astronomy, Inc., under cooperative agreement with the National Science Foundation.. We opted for the variance-weighted extraction with “doslit” procedure. Wavelength calibrations were done using standard helium neon lamp spectra and flux calibrations were done using a standard star spectra observed on the same night. Air-to-vacuum conversion was applied before adding the spectra. Individual spectra were combined using 1/ weighting in each pixel after scaling the overall individual spectra within a sliding window. The error spectrum was computed taking into account proper error propagation during the combining process.
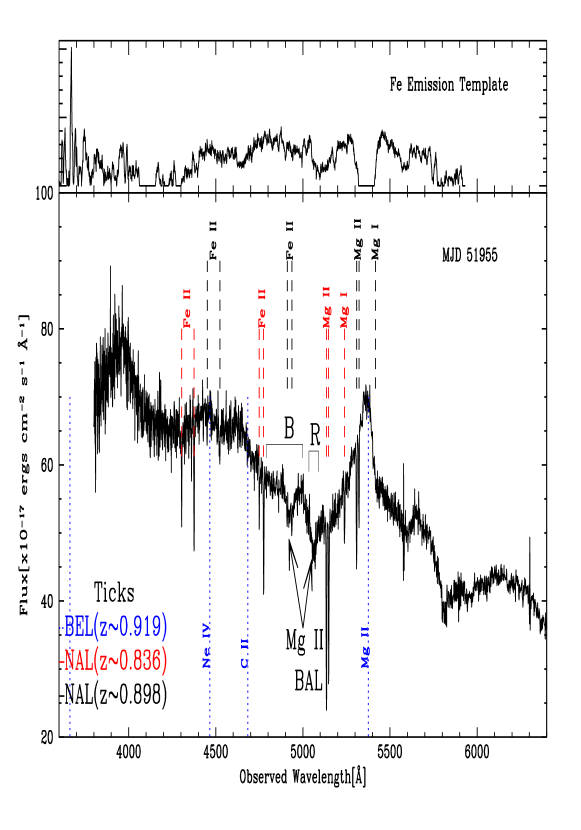 |
Fig. 1 shows the SDSS spectrum taken on 15-02-2001. The expected positions of broad emission lines (at =0.9197) are marked with blue dotted vertical lines. Narrow Mg ii, Mg i and Fe ii absorption lines associated with the intervening absorbers at 0.898 and 0.836 are distinctly detected. In addition, two broad Mg ii absorption components (marked in Fig. 1 as ’B’ and ’R’ to denote the blue and red components respectively) are clearly detected. We do not detect any associated Fe ii lines and the Al iii lines are redshifted out of the coverage. A visual comparison of this spectrum with the Fe template of Vestergaard & Wilkes (2001) suggests that the continuum of J1333+0012 may have considerable contribution from broad Fe emission lines.
 |
 |
 |
 |
 |
 |
3 Results
Trump et al. (2006) have fitted the spectrum of J1333+0012, observed on 15-02-2001, using a template spectrum. Their best fitted template resulted in a spectral index () of and E(B-V) = 0.295 for a SMC type dust. They have identified only one distinct BAL component at = 0.811 (corresponding to R component defined above). They assigned a Balnicity index and Absorption index of 360.42 and 4590.75 respectively to this source.
| MJD | R Component | B Component | ||||
| log (Mg ii )1 | z | log (Mg ii)1 | z | |||
| (cm-2) | (kms-1) | (cm-2) | (kms-1) | |||
| 51662 | 13.62 0.20 | 2829 | 0.811 | 13.42∗ | 7000 | - |
| 51955 | 13.75 0.13 | 3934 | 0.812 | 13.360.25 | 6143 | 0.764 |
| 54559 | 13.57∗ | 3000 | - | 14.260.39 | 12303 | 0.747 |
| 54888 | 13.20∗ | 3000 | - | 14.500.10 | 12909 | 0.746 |
| 54916 | 13.42∗ | 3000 | - | 14.460.20 | 11900 | 0.745 |
| 55218 | 13.09∗ | 3000 | - | 14.280.13 | 11474 | 0.754 |
| 55657 | 13.35∗ | 3000 | - | 13.760.36 | 10016 | 0.760 |
1 The error in (Mg ii ) does not include the contribution from continuum placement uncertainties; a velocity range that contains 90% of the integrated optical depth (see Ledoux et al., 2006); b optical depth weighted redshift; ∗ 3 Upper Limit of (Mg ii ).
Apart from this R component (that has consistent profile between two SDSS spectra and the KECK spectra of Hewett et al. (2001) observed on 30-04-2000) we find a new component at = 0.764 (defined above as B) in the 2001 SDSS data (not clearly detected in the previous epoch SDSS spectrum) having a velocity width of 6000 km s-1.
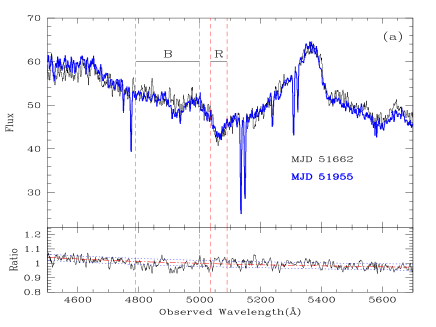
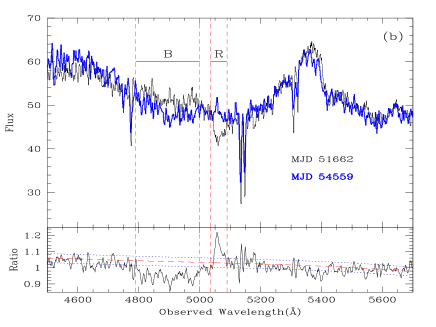
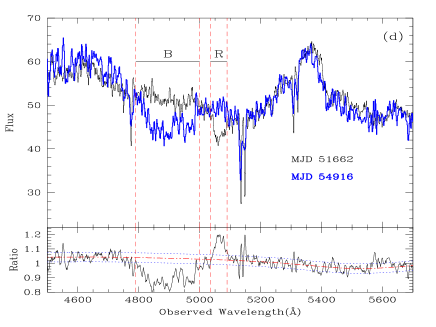
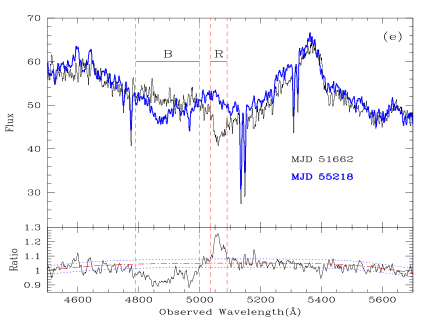
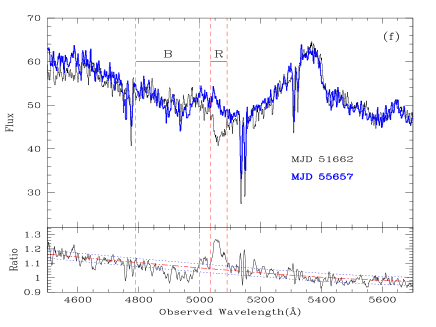
In Fig. 2, the IGO spectra obtained at different epochs are compared with a reference SDSS spectrum obtained in year 2000 (i.e MJD 51662). For displaying purpose we have scaled the fluxes to match the flux of the reference spectrum. In the bottom half of each panel we show the ratio of spectrum obtained at a given epoch to that of the reference spectrum. This curve is smooth apart from the wavelength range of R and B components. We normalise this curve with a smooth lower order polynomial (shown as red dotted curve in Fig. 2) to remove any large wavelength scale continuum flux differences between the two spectra.
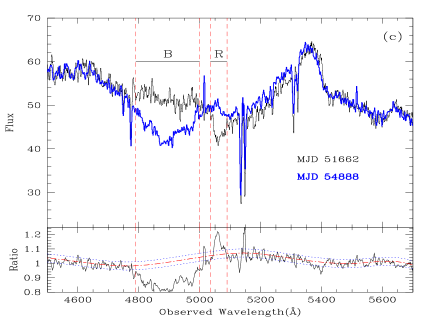
In our IGO 2008 (MJD 54559) spectrum (see panel b in Fig 2), the R component ( that was seen with near identical optical depth in two SDSS spectra) has completely disappeared. The R component has never reappeared again in any of our subsequent IGO spectra (see Fig 2). At the same time, the B component is seen to have varied in depth and widened in velocity in the 2008 (MJD 54559) data. In 2009 (MJD 54888), the B component further deepened in the absorption troughs. But, no changes in the velocity structure are seen (see panels c and d in Fig. 2). It diminished in strength in 2010 and has almost vanished in 2011 (see panels e and f in Fig. 2).
We calculated the Mg ii column density for both R and B components using apparent optical depth method (Savage & Sembach, 1991) assuming the gas to be optically thin and covering the background source completely. In case of the component B, we have used the normalised ratio spectra discussed in Fig. 2 to estimate (Mg ii ). For the component R that is relatively narrow we use the observed flux in the neighborhood of the absorption line for continuum normalization. The measured Mg ii column densities (or 3 upper limits), velocity width () and for both the components are summarized in Table 2.
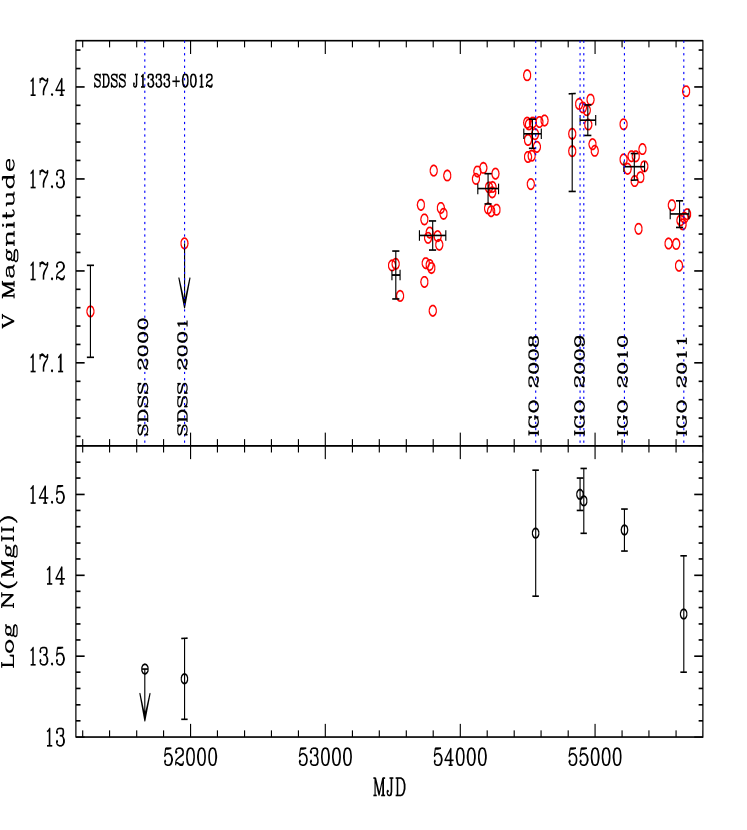
In Fig. 3 we plot the photometric light curves of J1333+0012 obtained in the Catalina Real-Time Transient Survey (CRTS, Drake et al., 2009). These observations were carried out with an unfiltered set up and were converted to V magnitude using 10 to 100 well selected G-type dwarf calibration stars found in each frame and the method described in Henden (2000). The zero point uncertainty is found to be 0.08 mag. The two left most points in the light curve corresponds to the transformed SDSS photometric and fiber magnitudes respectively. We use the transformation equation given in (Jester et al., 2005) for QSOs for this. Fiber magnitude should be considered as an upper limit on the actual magnitude. The QSO has dimmed between the early epoch CRTS observations and IGO 2008 observations, reached a minimum in 2009 and then brightened thereafter. The maximum seen amplitude of the variation is 0.2 mag. Very interestingly, a similar but opposite variation is seen in the (Mg ii ) of the B component during this period. i.e., when the quasar flux was minimum, the measured (Mg ii) is maximum.
4 Discussion
The main result of our monitoring of J1333+0012 is that the R component of Mg ii absorption has disappeared completely after the year 2001 and the B component emerged, became stronger and wider and subsequently disappeared between the years 2001 and 2011. There is also tentative evidence for a possible connection between the QSO flux and (Mg ii) measured for the B component. Now we discuss various scenarios to explain these observations.
It is very tempting to say that the R component got accelerated to the B component and later vanished from our line of sight. From Table 2, it is clear that the value of (Mg ii) and of component B in later epochs are much higher than what is seen in the R component in earlier epochs. If we use thin shell approximation, then mass conservation suggests that (H) should be conserved, where and (H) are the distance of the shell from the QSO and total hydrogen column density respectively. We expect to increase with time so (H) (and hence (Mg ii) should decrease with time). The observed (Mg ii) values do not not support this scenario.
One could argue that there were always two fluid components and what we see is due to the variations in the ionization parameter. Above we have seen that the QSO has varied by mag. However the required change in (Mg ii) is 0.6 to 1 dex. It is clear from Fig. 2 of Hamann (1997) that required change in (Mg ii) can not be produced by 0.2 dex change in ionization parameter. In addition the change in the Mg ii optical depth of R and B components are in the opposite directions. This scenario can be consistent if the variation in UV continuum is much larger than the 0.2 mag seen in the V band and the initial ionization parameters of the two components are very different. We do not favor this scenario based on the lack of large colour variations between our IFOSC spectra and the near consistency of Mg ii emission line.
In all the previous cases of emerging flows (Ma, 2002; Hamann et al., 2008; Krongold et al., 2010; Rodríguez Hidalgo et al., 2011; Hall et al., 2011) the most favoured explanation is the transverse motion of the absorbing gas. In particular the evolution of the B component can be explained as the absorbing gas transiting through our line of sight as the component has emerged, evolved and disappeared. To consider this possibility we derive some basic parameters for J1333+0012.
We obtained the B band magnitude of this QSO using the measured u and g magnitudes Jester et al. (see 2005). We use this and the prescription of Marconi et al. (2004), to get the bolometric luminosity, Lbol = 9.39 1046 ergs s-1. The corresponding mass accretion rate, is,
| (1) |
where , the mass to energy conversion efficiency is taken as 0.1. The blackhole mass derived from Eddington accretion is 8 M⊙. Following Hall et al. (2011), we find the diameter of the disc within which 90% of the 2700-Å continuum is emitted D cm.
The variability of the R component has occurred over a period 3994 days in the observers frame or 2081 days in the rest frame of the QSO. We can use this as an upper limit on the transit time of the absorbing gas across the continuum emitting region. If we assume the projected transverse size of the absorbing gas is much smaller than the emitting region (assumed to be a face-on disk), then we can estimate the transverse velocity km s-1. We find the radial velocity up to = 2.8 km s-1and the radial displacement of the gas during the transit is . Even if the projected transverse size of the gas is 10 times the continuum emitting region, the expected transverse velocity will be much lower than the measured radial velocity.
The main question is, is the emergence of new component in any way related to the structural changes in the accretion disk?. The possible connection between QSO dimming and (Mg ii) is interesting. It could either mean that the ejection being triggered by some events in the accretion disk that caused reduction in the accretion efficiency or extinction by dust in the transiting gas.
Trump et al. (2006) identified this system as BAL based on the presence of Mg ii absorption in the R component. The latest spectrum of J1333+0012 taken with IGO is nearly devoid of any broad Mg ii absorption. We do not detect Mg i, Fe ii and Ca ii absorption associated with either of the broad Mg ii components. It will be interesting to study the properties of other strong high ionization lines using UV spectroscopy. Continuous optical monitoring of this source to see recurrence of new outflow episode will be useful for modeling this interesting source.
5 Conclusions
In this paper, we report a dynamically evolving Mg ii broad absorption line outflow in SDSS J133356.02+001229.1. The R component detected in the SDSS spectra taken in 2000 and 2001 was never seen in the IGO spectra taken in the latter epochs. The blue component B emerged in 2001. It continued to increase its optical depth till 2009 and started to diminish thereafter. This component has almost vanished in the most recent spectra in 2011.
We provide arguments for not favoring the acceleration of a single cloud to a higher velocity and changes in the ionization conditions causing the observed spectral variability. The observed variability can be best explained by multiple streaming gas moving across our line of sight. An outflowing gas component with transverse velocity one tenth of the observed radial velocity and flow extent up to 10 times the size of the accretion disk can easily explain these observations.
We find the QSO has dimmed by about 0.2 mag (in V-band) during the monitoring period. This may be the manifestation of the emerged outflow being triggered by the structural changes in the accretion disk or due to reddening by dust in the absorbing gas.
6 acknowledgements
We wish to acknowledge the IUCAA/IGO staff for their support during our observations. In particular we thank Dr. Vijay Mohan for continued support. MV gratefully acknowledges University Grants Commission, India, for support through RFSMS Scheme and IUCAA for hospitality, where most of this work was done. RS gratefully acknowledge the support from the Indo-French Center for the Promotion of Advanced Research (Centre Franco-Indien pour la promition de la recherche avancée) under project N. 4304-2.
References
- Becker et al. (2000) Becker R. H., White R. L., Gregg M. D., Brotherton M. S., Laurent-Muehleisen S. A., Arav N., 2000, ApJ, 538, 72
- Bower et al. (2006) Bower R. G., Benson A. J., Malbon R., Helly J. C., Frenk C. S., Baugh C. M., Cole S., Lacey C. G., 2006, MNRAS, 370, 645
- Dai et al. (2008) Dai X., Shankar F., Sivakoff G. R., 2008, ApJ, 672, 108
- Drake et al. (2009) Drake A. J., Djorgovski S. G., Mahabal A., Beshore E., Larson S., Graham M. J., Williams R., Christensen E., Catelan M., Boattini A., Gibbs A., Hill R., Kowalski R., 2009, ApJ, 696, 870
- Elvis (2000) Elvis M., 2000, ApJ, 545, 63
- Gibson et al. (2008) Gibson R. R., Brandt W. N., Schneider D. P., Gallagher S. C., 2008, ApJ, 675, 985
- Goodrich & Miller (1995) Goodrich R. W., Miller J. S., 1995, ApJ, 448, L73+
- Hall et al. (2011) Hall P. B., Anosov K., White R. L., Brandt W. N., Gregg M. D., Gibson R. R., Becker R. H., Schneider D. P., 2011, MNRAS, 411, 2653
- Hamann (1997) Hamann F., 1997, ApJS, 109, 279
- Hamann et al. (2008) Hamann F., Kaplan K. F., Rodríguez Hidalgo P., Prochaska J. X., Herbert-Fort S., 2008, MNRAS, 391, L39
- Hazard et al. (1984) Hazard C., Morton D. C., Terlevich R., McMahon R., 1984, ApJ, 282, 33
- Henden (2000) Henden A. A., 2000, Journal of the American Association of Variable Star Observers (JAAVSO), 29, 35
- Hewett et al. (2001) Hewett P. C., Foltz C. B., Chaffee F. H., 2001, AJ, 122, 518
- Hines & Wills (1995) Hines D. C., Wills B. J., 1995, ApJ, 448, L69+
- Jester et al. (2005) Jester S., Schneider D. P., Richards G. T., Green R. F., Schmidt M., Hall P. B., Strauss M. A., Vanden Berk D. E., Stoughton C., Gunn J. E., Brinkmann J., Kent S. M., Smith J. A., Tucker D. L., Yanny B., 2005, AJ, 130, 873
- King (2003) King A., 2003, ApJ, 596, L27
- Krongold et al. (2010) Krongold Y., Binette L., Hernández-Ibarra F., 2010, ApJ, 724, L203
- Ledoux et al. (2006) Ledoux C., Petitjean P., Fynbo J. P. U., Møller P., Srianand R., 2006, A&A, 457, 71
- Leighly et al. (2009) Leighly K. M., Hamann F., Casebeer D. A., Grupe D., 2009, ApJ, 701, 176
- Lundgren et al. (2007) Lundgren B. F., Wilhite B. C., Brunner R. J., Hall P. B., Schneider D. P., York D. G., Vanden Berk D. E., Brinkmann J., 2007, ApJ, 656, 73
- Ma (2002) Ma F., 2002, MNRAS, 335, L99
- Marconi et al. (2004) Marconi A., Risaliti G., Gilli R., Hunt L. K., Maiolino R., Salvati M., 2004, MNRAS, 351, 169
- Murray et al. (1995) Murray N., Chiang J., Grossman S. A., Voit G. M., 1995, ApJ, 451, 498
- Rodríguez Hidalgo et al. (2011) Rodríguez Hidalgo P., Hamann F., Hall P., 2011, MNRAS, 411, 247
- Savage & Sembach (1991) Savage B. D., Sembach K. R., 1991, ApJ, 379, 245
- Silk & Rees (1998) Silk J., Rees M. J., 1998, A&A, 331, L1
- Srianand & Petitjean (2001) Srianand R., Petitjean P., 2001, A&A, 373, 816
- Trump et al. (2006) Trump J. R., Hall P. B., Reichard T. A., Richards G. T., Schneider D. P., Vanden Berk D. E., Knapp G. R., Anderson S. F., Fan X., Brinkman J., Kleinman S. J., Nitta A., 2006, ApJS, 165, 1
- Vestergaard & Wilkes (2001) Vestergaard M., Wilkes B. J., 2001, ApJS, 134, 1
- Voit et al. (1993) Voit G. M., Weymann R. J., Korista K. T., 1993, ApJ, 413, 95