Alpha Backgrounds for HPGe Detectors in
Neutrinoless Double-Beta
Decay Experiments
Abstract
The Majorana Experiment will use arrays of enriched HPGe detectors to search for the neutrinoless double-beta decay of 76Ge. Such a decay, if found, would show lepton-number violation and confirm the Majorana nature of the neutrino. Searches for such rare events are hindered by obscuring backgrounds which must be understood and mitigated as much as possible. A potentially important background contribution to this and other double-beta decay experiments could come from decays of alpha-emitting isotopes in the 232Th and 238U decay chains on or near the surfaces of the detectors. An alpha particle emitted external to an HPGe crystal can lose energy before entering the active region of the detector, either in some external-bulk material or within the dead region of the crystal. The measured energy of the event will only correspond to a partial amount of the total kinetic energy of the alpha and might obscure the signal from neutrinoless double-beta decay. A test stand was built and measurements were performed to quantitatively assess this background. We present results from these measurements and compare them to simulations using Geant4. These results are then used to measure the alpha backgrounds in an underground detector in situ. We also make estimates of surface contamination tolerances for double-beta decay experiments using solid-state detectors.
1 Introduction
Observation of neutrinoless double-beta decay represents the best chance for discovering the nature of the neutrino (Majorana or Dirac) [1, 2, 3, 4]. Experimental searches using high-purity germanium (HPGe) detectors—enriched to 86% 76Ge—have demonstrated the most stringent half-life limits for this decay ( y [5]) to date. Future experiments with tonne-years of exposure should be able to reach half-life limits greater than y, but only through concerted efforts in understanding and reducing backgrounds. Current experiments using 76Ge, such as Majorana[6, 7, 8] and GERDA Phase II[9, 10], will attempt to reach background levels of 4 background events/tonne-year in the region-of-interest around 2039 keV to demonstrate the viability of future tonne-scale experiments333A background of 4 events/tonne-year in the Majorana and GERDA experiments will scale to 1 event/tonne-year in a tonne-sized experiment.. Achieving these background goals will require ultra-clean materials, sufficient shielding, sophisticated background-rejection techniques, and a deep-underground setting.
The signature of is a peak at the Q-value of the decay, corresponding to the sum of the kinetic energies of the two emitted electrons. Alpha particles, emitted from decays in the 232Th and 238U natural decay chains with energies of 3.9–8.8 MeV, can lose kinetic energy before entering the active region of an HPGe crystal. These degraded alphas can result in a continuum of events, obscuring a possible signal from .
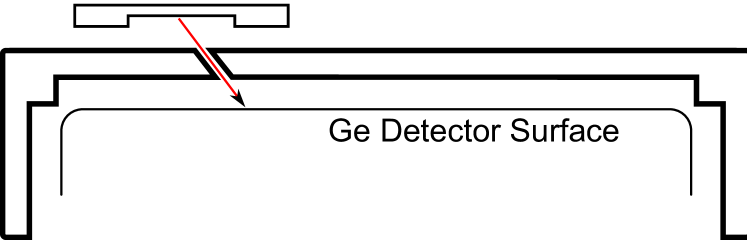
HPGe diode detectors have and ohmic contacts for bias and signal connection. The layer, created with diffused lithium ions, is typically mm in depth. The layer is created by implanting boron ions, resulting in a dead layer on the order of m. These form regions within the detector that are insensitive to ionizing radiation, where energy lost by a particle will not be registered. Because alphas cannot traverse the thick layer, a detector’s susceptibility to alphas is dependent upon the amount of surface with a contact. HPGe detectors are characterized by their dopants, being either n-type or p-type. The dopants then determine the type of ohmic contacts for the crystal; n-type detectors have central contacts while p-types have . The outer surface contacts are reversed for each detector type. The diagram in Fig. 1 shows a depiction of these detector types with exaggerated thicknesses. The thin outer contact means that n-type detectors have more alpha-susceptible surface area than p-types. A p-type with a point contact (p-pc, [11]) will be used in the Majorana Demonstrator[7] and Phase II of GERDA [12]. The region between the and layers is typically passivated and is characterized by incomplete and hard to predict charge collection (shown as dashed in the figure). The response of a detector to alphas incident on this surface is still an unknown. The p-pc detectors used in the Majorana Demonstrator will have a minimal amount of this type of surface.

Broadly speaking, alpha backgrounds for experiments with HPGe detectors fall into two categories, depending on where the degradation in kinetic energy occurs: surface alphas and external-bulk alphas.
Surface-type alpha events are characterized by decays at the surface of the crystal, with the alpha losing kinetic energy within the dead region of the crystal. Only alphas that enter the crystal at extremely shallow incidence angles (with respect to the normal of the crystal surface) will lose an appreciable amount of energy within this thin dead region; alphas entering the crystal at or near normal to the surface will lose a negligible amount of energy before entering the active region of the crystal, resulting in minimal energy loss and a peak structure when measured by the detector. The classic example of this background arises from exposure to 222Rn. The decay of 222Rn (3.8 days) and its subsequent daughters 218Po, 214Pb, 214Bi, 214Po eventually lead to 210Pb. Along the way, these daughters of 222Rn can implant onto surfaces[13]. 210Pb decays to 210Bi, and then 210Po, which emits a 5.3 MeV alpha upon its decay. The relatively-long half-life of 210Pb (22 years) means that even a brief exposure of a detector or its surroundings can lead to a steady supply of 5.3 MeV alpha backgrounds[14, 13].
The other category of alpha backgrounds, external-bulk alphas, originate in bulk materials external to the crystal, e.g. a contact pin or detector mount. Energy loss of the alpha occurs in this bulk material before it hits the detector surface and depends on the amount of external material the alpha travels through. The result is a broad continuum of events with no peak structure.
This paper presents work to quantify the role of alpha backgrounds on experiments using HPGe detectors. in Sec. 2 a test stand that was designed and built to study alpha backgrounds is described. Also in this section a model of the response of an HPGe detector to alpha decays is discussed and applied to the test stand data. In Sec. 3 this model is applied to data taken with an in situ detector located underground. These results are discussed in the context of backgrounds to experiments using HPGe detectors in Sec. 4.
2 Background Test Stand
An n-type, semi-coax HPGe detector manufactured by ORTEC[15] was modified to facilitate measurement of an alpha source on the surface of an HPGe crystal. The original detector was enclosed within an aluminum outer vacuum cryostat that sealed against the base of the detector canister. The base is mounted securely to the cold finger and contains all electrical feedthroughs. The inside of the canister contains the upper cold finger and cold plate, front-end electronics for the preamplifier, and the crystal. The crystal mount consists of a smaller aluminum cup attached to the cold finger with the HPGe crystal affixed inside this mounting cup. A thin sheet of aluminized mylar that originally covered the crystal’s front face was replaced with a crystal cap fabricated from aluminum. The external vacuum enclosure—sealed against the detector base with an O-ring—was replaced with a larger, custom cryostat enclosure for ease of source transfer and for external-source manipulation. The test stand was operated in two separate modes to study both surface-type and bulk-type alpha backgrounds.


2.1 Surface Background Model
| Peak | Centroid (keV) | B.R.(%) | ||
|---|---|---|---|---|
| a | 5388. | 0 | 1. | 66 |
| b | 5442. | 8 | 13. | 1 |
| c | 5485. | 56 | 84. | 8 |
| d | 5511. | 5 | 0. | 225 |
| e | 5544. | 5 | 0. | 37 |
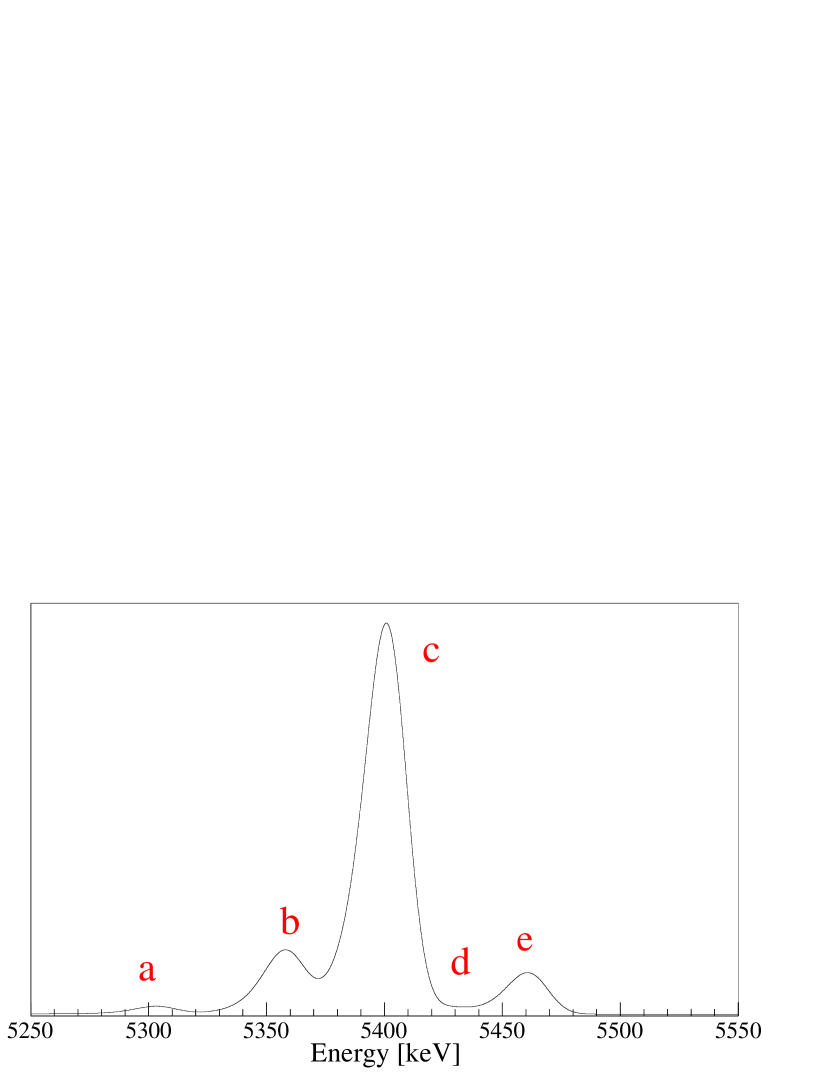
For studying surface-type backgrounds, the test stand (see schematic, Fig. 2) employed a rotational feedthrough (a) at the top of the modified cryostat enclosure (b). The feedthrough connects to an arm and source holder (c) in which a windowless-alpha source is placed. The source can be rotated in a circle above the aluminum cap (d), through which holes were drilled at different angles (Fig. 3). These angled holes allowed alphas of different incidence angles (0∘, 30∘, 45∘, and 60∘ with respect to the normal of the surface) to reach the crystal’s (e) face. The source used was a windowless 241Am alpha source from Isotope Products with an activity of 161.9 Bq [17]. The decay of 241Am237Np (Q-value: 5637.82 keV) results in the emission of an alpha particle 100% of the time. The five alpha branches with probabilities greater than 0.1% are noted in Table 1. There are two gamma emissions with non-negligible branching ratios that occur with the 5485.56 keV alpha. Given the proximity of the source to the detector, a large fraction of these decays will deposit both an alpha and a gamma in coincidence, and the energy spectrum as measured by the HPGe detector will reflect this with some of the events from the 5485 keV alpha going into a higher energy peak. This structure can be seen in Fig. 4.
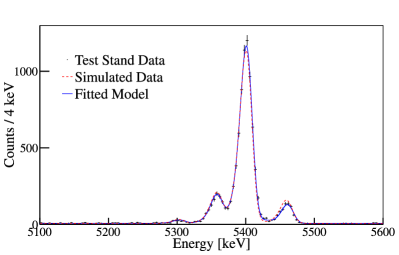
Data were collected using four different collimation holes, corresponding to alphas striking the surface of the detector at incidence angles as described above. Figure 5 shows calibrated energy spectra for all four data sets.
A charged-ion interaction model was constructed to characterize the detector’s response to surface alphas. An alpha traversing a non-active region of length will undergo a mean energy loss of
| (1) |
where the stopping power (itself a function of the alpha’s energy) is integrated over . A Bohr model of non-relativistic heavy particles on thick absorbers [18, 19] was used to relate the energy straggling to the expected width of a mono-energetic alpha beam incident on an absorber (i.e. a non-active region). An idealized energy spectrum (as measured by an HPGe detector) of alphas of initial kinetic energy traveling through an absorber of thickness would then be described by a gaussian with mean and width :
| (2) |
Here, is Avogadro’s number, is the classical radius of the electron, the mass of the electron, and , , and the density, atomic number, and atomic mass of the absorber material. In practice there are two further required modifications. Nuclear quenching within the HPGe detector results in energy losses that do not register with the ionization detector. This results in a further energy offset, , that must be included. Furthermore, HPGe detectors do not have 100% efficiency for charge collection, resulting in a low-energy tail. For this reason, an exponentialy-modified Gaussian (a Gaussian convolved with an exponential) is used in the model to account for this asymmetry in the peak signal. Incorporating these two additions, the model-predicted energy spectrum from a mono-energetic alpha source traversing an absorber becomes
| (3) | ||||
where , is the exponential parameter, and is defined as in Eq. 2.
Tailoring Eq. 3 to the 241Am source in the test stand requires summing 5 such peaks and also taking into account the background from cosmic ray-induced events. The cosmic background is well-described by a linear polynomial () in the region around the peak structure (5100-5600 keV). The energy loss and straggling parameters, and , depend on the path length through the dead layer (depth ) via , where is the incidence angle of the alpha. The probability density function describing surface alphas from 241Am impinging on an HPGe crystal surface at incident angle in the test stand is then
| (4) |
where the coefficients represent the weights of the alpha peaks in Table 1 and sum to 1.
2.2 Test Stand Operation
The test stand was operated at Los Alamos National Laboratory at 2200 meters above sea level. The high cosmic-event rate, coupled with the relatively weak source (161.9 Bq), forced the size of the collimation holes to be larger than ideal. The poorer collimation power resulted in a larger range of incidence angles for a particular hole than desired, and required a modified probability density function composed of a weighted sum of single-angle p.d.f.s. The final p.d.f., taking into account the spread of angles around the nominal collimation angle , then becomes
| (5) |
The weights for a given single incidence angle are determined via a line-of-sight simulation that takes into account the collimation angle, size, and the position of the source. It is important to note that the peaks in Fig. 5 are wider than they would be with a perfect collimator.
The analytical model was fit to the test stand data using a maximum-likelihood fit. All four data sets (with nominal incidence angles of 0∘, 30∘, 45∘, 60∘) were fit simultaneously with the goal of extracting the dead layer parameter . The combined model for the data sets with the data are shown in Fig. 5. The value of the dead layer, as extracted from the fits, is determined to be . This is in agreement with the dead layer thickness as given by the data sheet from ORTEC (0.3 m, no stated uncertainty).
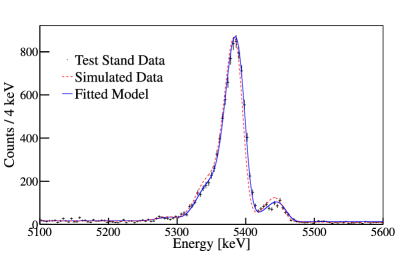
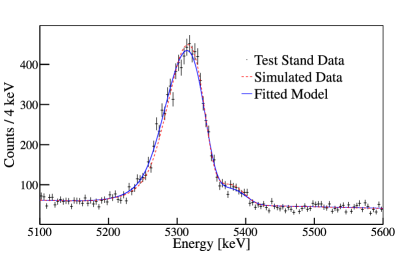
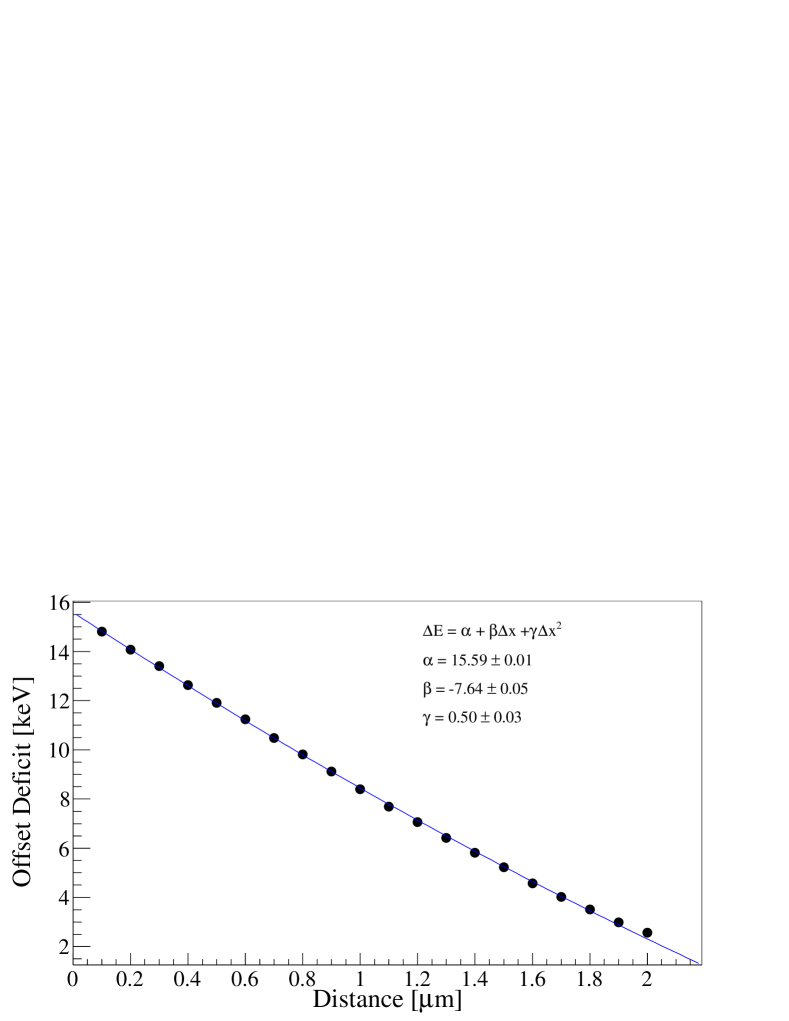
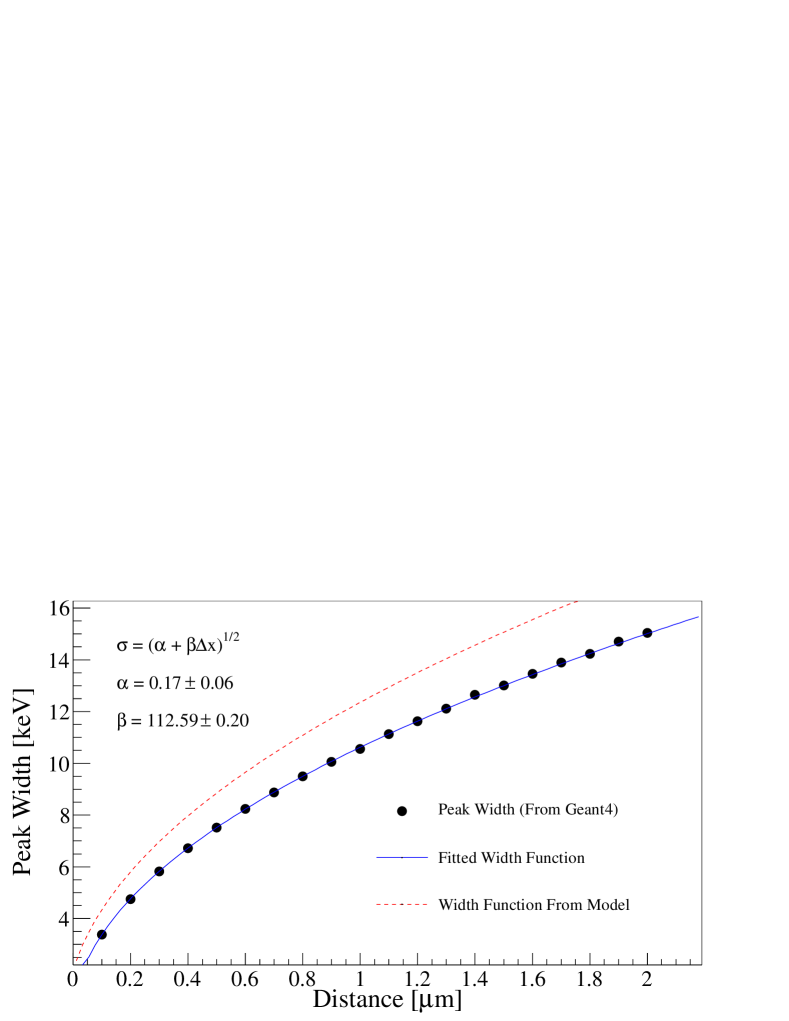
Simulations of the test stand were also performed using the Geant4- and ROOT-based software package MaGe, with the test stand incorporated into the package’s geometry. A dead layer was simulated in the crystal surface as a step function, ignoring any energy deposits within the dead region (this assumption is the same as our analytic treatment). The simulated output spectra were convolved with a detector-response function, i.e. a modified gaussian incorporating the same skew parameter from the model fit. The width of the response function was determined by measuring the detector resolution from fits to gamma peaks in the detector (between 100 and 2600 keV), fitting the resolution values to a parametrized resolution function [20], and extrapolating the resolution at 5.4 MeV from that function with the fitted values of and . Comparing the simulations to the data (Fig. 6) revealed discrepancies in both the width and offset of the peak structure. The simulated offset and width do not match with the data or the analytic model. A simplified simulation of a mono-energetic alpha incident on the surface of a detector was performed for a range of incidence angles (corresponding to a range of dead layer thicknesses) to determine the difference in alpha peak offsets and widths between simulation and the model (Fig. 6). These discrepancies were then used to create a second convolution function that was applied to the simulated data (as a function of incidence angle). As shown in Fig. 5, the corrected simulated spectrum is in good agreement with the data and the analytic fit. It should be pointed out that this particular simulation was performed using Geant4 version 9.0, and simulations run with newer versions resulted in different discrepancies.

2.3 External-Bulk Backgrounds
The rotational feedthrough was replaced with a blank-off for the bulk-type background study. A 4 cm length of thorium wire (99% 232Th)[21] was looped 5 mm above the crystal face, allowing direct shine from the wire to the face of the crystal. The energy spectrum from this data set is shown in Fig. 7. The close proximity of the wire to the detector surface means that the detector is inundated with gammas from the 232Th chain in addition to the alphas. Double and triple coincidence gammas from 208Tl are evident in the energy spectrum up to 3710 keV (511 keV + 583 keV + 2615 keV). The step structure above 3700 keV is evidence of thorium alphas with the high-energy end of each step corresponding to the initial kinetic energy of a given alpha.
A model, similar to that of the surface-type detector response, was constructed to describe bulk-type data on the detector. The typical range of an alpha in solid materials of interest (thorium, copper, lead, gold, germanium) is on the order 10’s of m. Thus only the outer portion of material facing the crystal will contribute alpha backgrounds. An alpha of original energy , emitted in an external-bulk material at a depth from the material surface at an angle with respect to the normal of that surface, will then lose an average energy similar to Eq. 1 where is a function of the alpha’s energy and distance traveled. Similarly, energy straggling will widen the resulting peak. The spectrum from an alpha of initial energy at a depth emitted at an angle would then be given as
| (6) | ||||
where we once again assume a Bohr model of energy straggling and is calculated using , , and of thorium. While could be described with an exponentially-modified gaussian as for the surface data, such details are washed out in practice because of the continuum nature of the energy spectrum as is integrated over and .
The model spectrum for a particular decay is then found by integrating Eq. 6 over and . Values for were taken from alpha stopping-power and range tables [22], and this integration was performed for all the alphas in the 232Th decay chain. The corresponding energy spectra were then summed, assuming the chain is in secular equilibrium. This assumption is valid in our comparison with our data because all alpha decays in the 232Th chain, except the first, happen within days of each other. The first alpha decay in the chain (232Th) emits a 4 MeV alpha which is not discernable below the beta/gamma continuum in the data set.
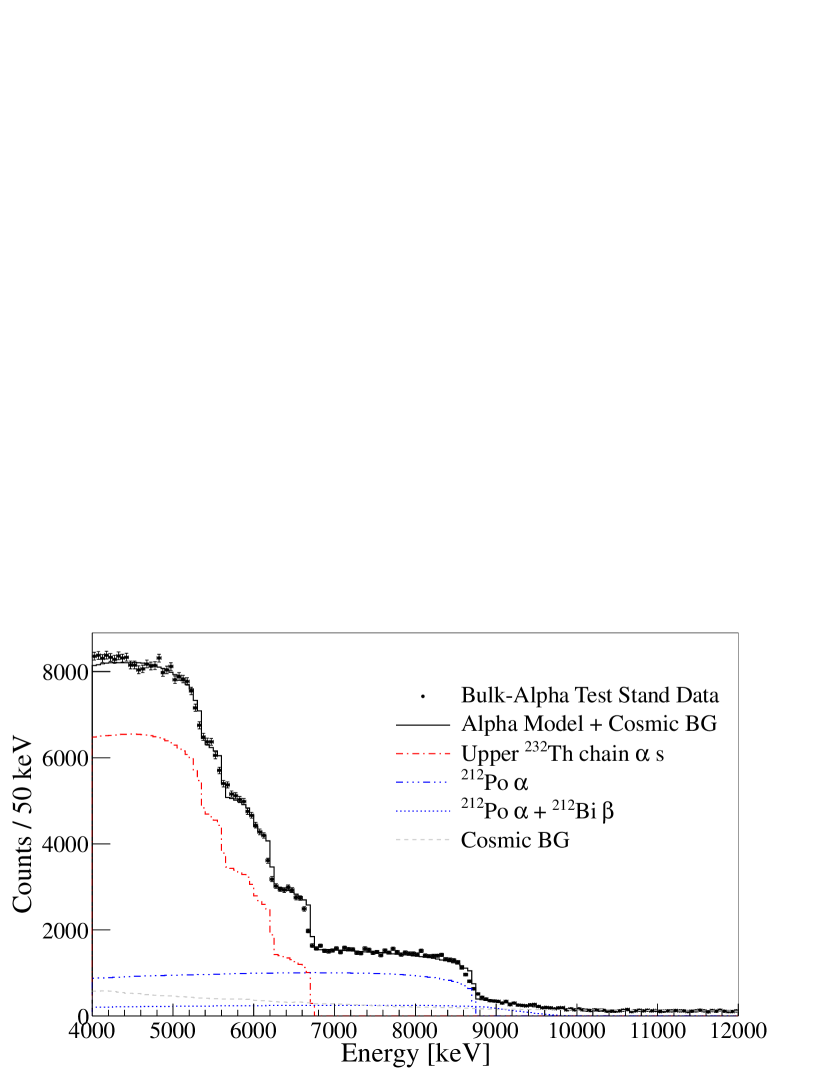
This model was compared with the data set (Fig. 8). The fast alpha decay (300 ns) of 212Po, coming after the beta decay of 212Bi, occasionally results in pileup in the detector of the alpha (8.8 MeV) and the beta (endpoint 2252 keV, intensity 55.4%). To treat this, the p.d.f. representing the 212Po alpha spectrum was convolved with the beta spectrum of 212Bi. A combined p.d.f. consisting of the unmodified 212Po p.d.f., the 212Po212Bi p.d.f., the upper 232Th chain p.d.f., and a cosmic-ray spectrum p.d.f. consisting of a constant plus exponential function was constructed. This combined p.d.f. was fit to the data set and the results are shown in Fig. 8.
[h]
3 In Situ Measurement
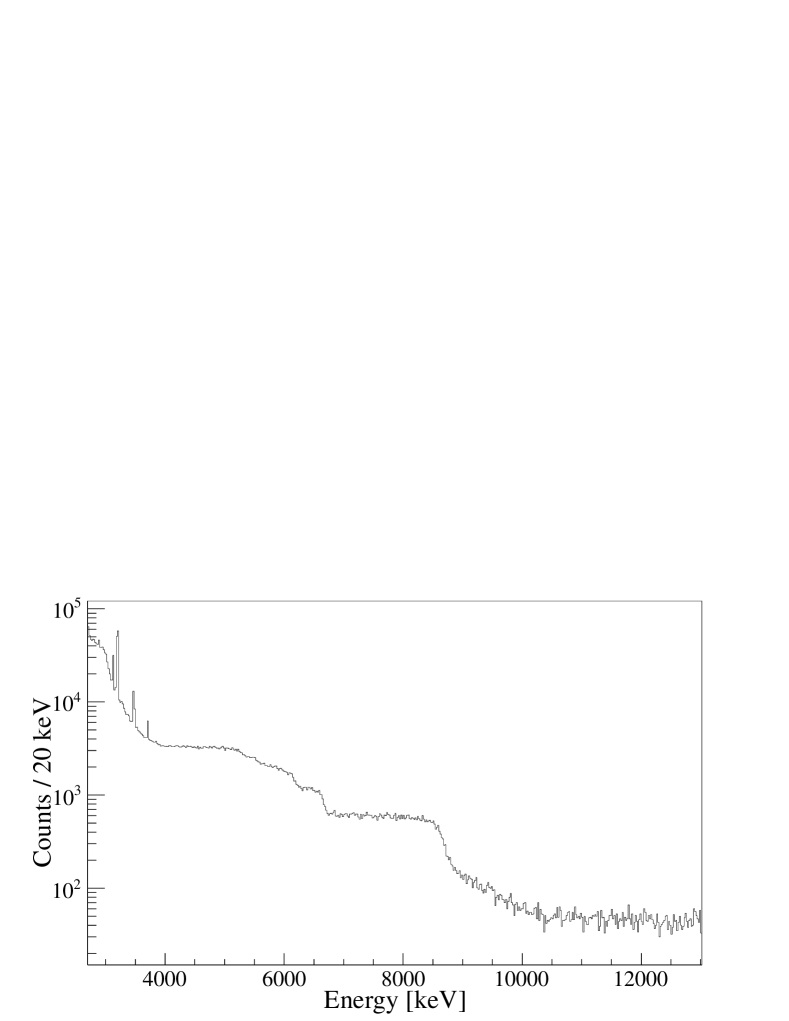
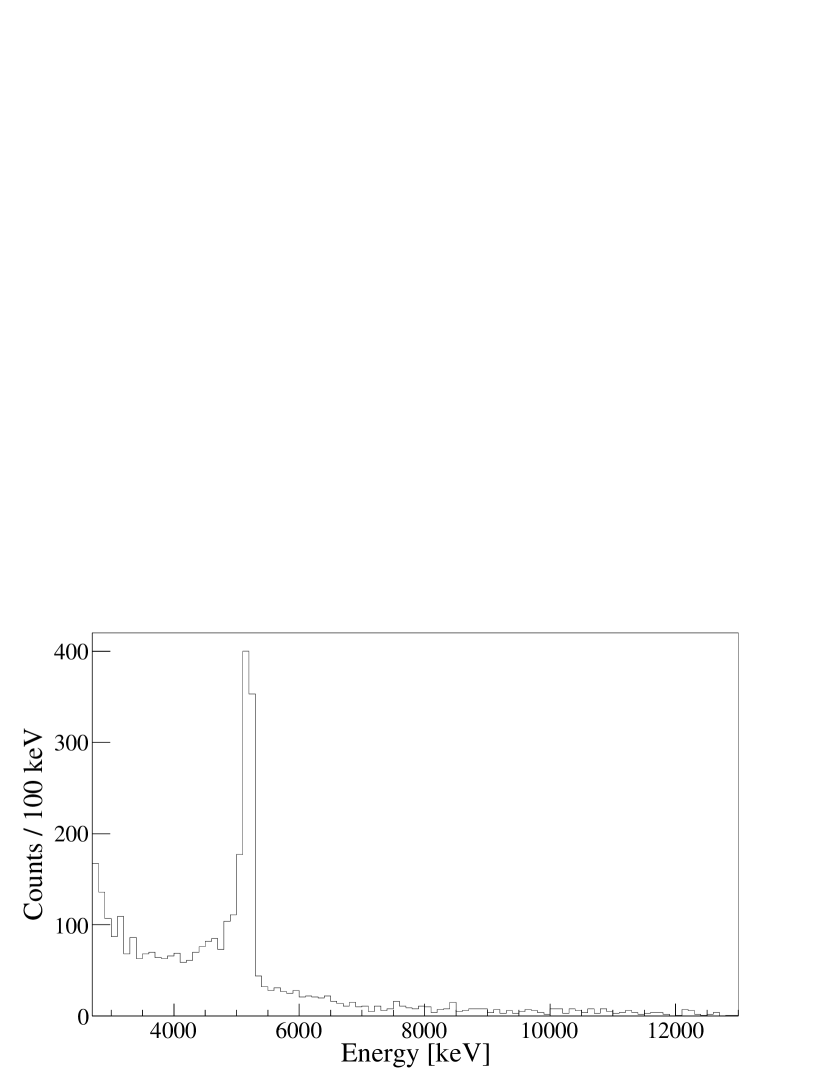
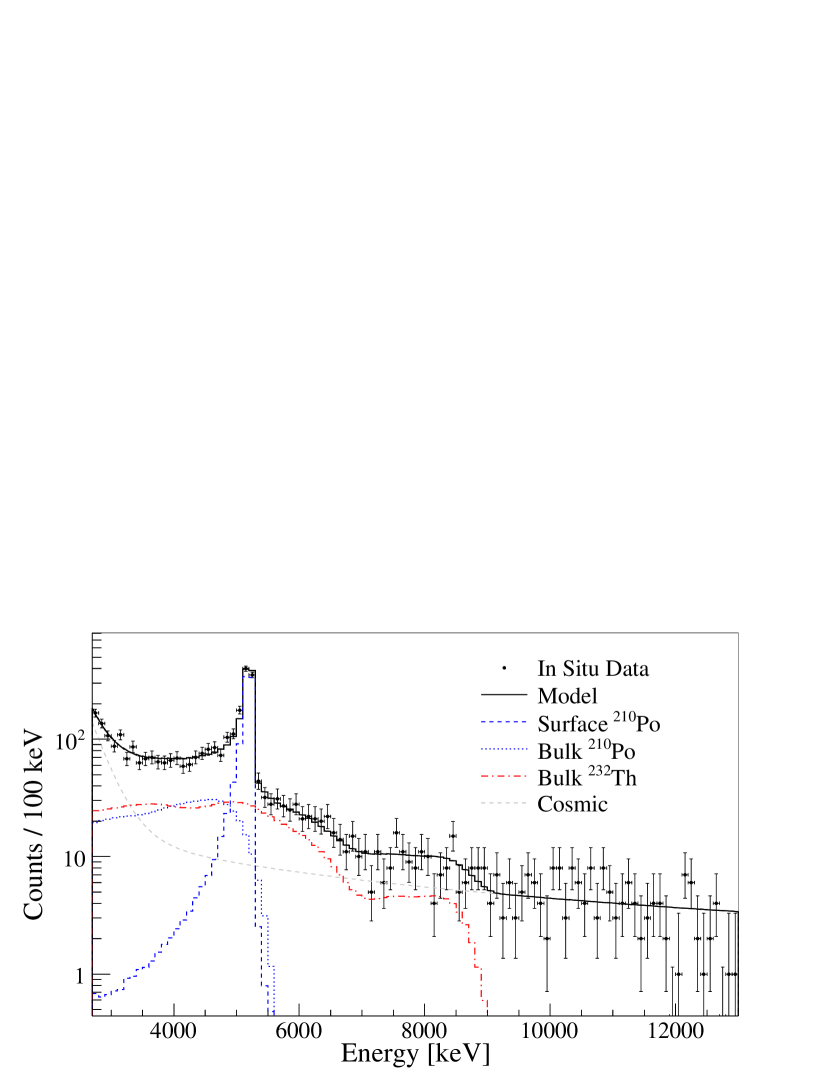
The model developed in the previous section was used to analyze the energy spectrum of in-situ backgrounds from an existing underground detector. An n-type HPGe detector, underground at the Waste Isolation Pilot Plant near Carlsbad, NM, was discovered to have a peak in its background energy spectrum at 5.3 MeV as seen in Fig. 9 . We model the spectrum assuming that all events above 2.7 MeV (i.e. above the 2615 keV gamma peak from the decay of 208Tl) must originate from either surface-alpha events, external-bulk alpha events, or cosmic events. A muon-veto scintillator panel was installed above the detector for a portion of the data taking, giving an energy spectrum of cosmic-ray muons from events that were tagged with the veto. The same constant plus exponential function that was used for the test stand data in Sec. 2 was fit to this cosmic-tagged data and subsequently used in the background fit. A p.d.f.—consisting of individual p.d.f.s of the surface- and external-bulk 232Th, 238U, and 210Po events and the cosmic p.d.f.—was used to fit to the spectrum. This fit is shown in Fig. 10 and the results are summarized in Table 2. Components from the 238U chain—save 210Po—were consistent with zero and so were excluded from the final fit. Alpha yields and rates are tabulated in Table 2. The only evidence of bulk events from the 238U chain were found to be 210Po. This could conceivably come from bulk material containing short half-life daughters lower in the 238U decay chain (anything below 226Ra). This would have decayed to the long-lived 210Pb (22 year half-life), allowing a lead-supported supply of 210Po alphas.
| Contribution | Yield | Counts / Day | ||
|---|---|---|---|---|
| Cosmic Events | 1033 | |||
| Surface 210Po | 907 | |||
| Bulk 210Po | 641 | |||
| Bulk 232Th | 1019 | |||
4 Alpha Backgrounds and
The efficiency for a surface alpha decay on a surface, e.g. the alpha from 210Po, to populate the region-of-interest in a double-beta decay experiment using HPGe detectors was calculated from simulations using MaGe. For a nominal dead layer value of 0.3 m, the probability that the energy detected from a 210Po decay on the surface falls within the region-of-interest (ROI) is . Assuming a possible variation in dead-layer of m adds a systematic uncertainty of . This includes the corrective convolution that was required in Section 2.1, although the difference in calculated efficiency with and without the convolution was only . The final, simulated efficiency is then . The same efficiency was also calculated using the surface alpha analytic model. The model was used to generate an energy spectrum from surface 210Po decays, and the efficiency for a decay to land in the 4 keV-wide ROI is calculated to be . Allowing for the same m variation in dead layer, the model efficiency becomes .
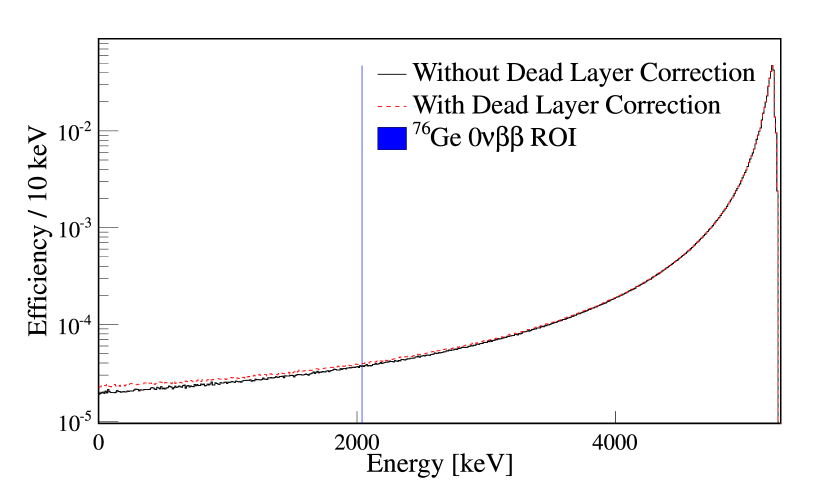
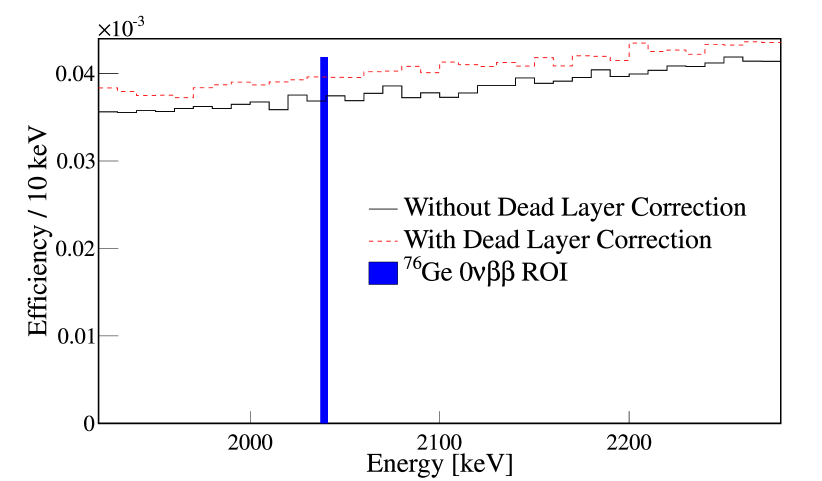
The two techniques differ by . The test-stand data was in better agreement with the analytic model—particularly the bulk comparison —and so this value is used as the final calculated efficiency. The discrepancy between simulation and model is added as a systematic lower uncertainty. Another possible systematic effect arises from uncertainty in the dead-layer profile. Both the simulation and the analytic model assume a step-like efficiency function for the dead layer. In this case, no charge collection happens at all within the dead region, but charge collection is 100% efficient within the active region. The stopping power, , is a non-linear function of alpha energy, and so the amount of energy lost in a dead region is dependent upon both energy of the alpha and the charge-collection efficiency within that region. A smoothly-varying dead-layer profile will result in less charge being collected than a step-like profile. Assuming a worst-case scenario (with the efficiency profile a linear function, representing the largest possible difference in the energy spectrum), the energy spectrum can be compared with the uncorrected (step-function efficiency profile) and this is shown in Fig. 11. When this correction is added to the simulated and model energy spectra, the efficiency for a decay of 210Po to land in the ROI increases by . A related effect would come from non-uniformity in the dead layer over the surface of a detector. If the dead layer varies from point to point on the detector, then the efficiency for an alpha decay would vary from point to point as well. Accounting for the different predictions of the simulation vs. the analytic model, and folding in the possibility of a dead-layer effect, the value for the efficiency of a 210Po alpha, emitted from the (thin) surface of an HPGe detector, is .
| Detector Type | Mass [kg] | Surface Area/Ratio [cm2/%] | [cm2/kg] | ||||||
| passivated | Total | ||||||||
| n-type | 1.1 | 30.4 / | 12.7 | 177.5 / | 74.1 | 31.8 / | 13.3 | 239.7 | 161.4 |
| p-type | 1.1 | 1.8 / | 0.8 | 35.4 / | 14.8 | 202.6 / | 84.5 | 239.8 | 32.2 |
| p-pc | 0.579 | 1.9 / | 1.8 | 0.2 / | 0.2 | 104.5 / | 98.0 | 106.6 | 0.35 |
The goals of the Majorana Demonstrator will be to test the claim by Klapdor et al. [23] and to demonstrate the background goals necessary for a future tonne-scale experiment. The alpha background rate of a detector (or array of detectors), in units of background counts within the ROI per tonne-year, is given as
| (7) |
where is the mass of germanium in the detector111The usual method is to use as the amount of active mass, but alpha backgrounds will not differ for enriched vs. unenriched detectors., the surface-alpha activity in Bq/cm2, and the efficiency for a decay at position to count as a background. The integral is over all relevant surfaces , and is the solid angle of area with which the area element has direct line-of-sight. The coefficient converts the subsequent background rate from counts per second-kilogram into counts per tonne-year. This formula can be significantly simplified for decays that occur on the surface of the detector itself:
| (8) |
with the total susceptible surface area, the average surface-activity rate, and the efficiency calculated in the previous section (a true “surface” event with solid angle ). The factor is the ratio of susceptible surface area to active mass (with units of area/mass). Because the Demonstrator will be composed of modified, p-type point contact (p-pc) detectors, it will have a particularly-low susceptibility to alpha backgrounds, especially in comparison to n-type detectors (Table 3). This is because the vast majority of surface area that is , or “thick”. The susceptibility for the modified p-pc detectors expected to be used in the Demonstrator is 0.34 cm2/kg, where the uncertainty comes from the quoted tolerances of the detector dimensions for the Canberra BEGe natGe detectors that will be installed in the first module of the Majorana Demonstrator. For comparison, the susceptibility for a typical n-type detector is over 400 times greater. Plugging in the susceptibility and the calculated efficiency, the rate then becomes
| (9) |
Table 4 displays expected background rates from 210Po alphas for several values of surface activity . The alpha rate from the Sudbury Neutrino Observatory’s 3He proportaional counter detectors represents the cleanest detector surface ever measured in terms of alpha contamination[24]. Also shown are the rates for a typical n-type detector, given the same activity rates.
If the alpha decays are not coming from the surface of the HPGe crystal, then the solid angle simplification no longer applies. For configurations involving complicated surfaces facing the area of a detector, the integral in Eq. 7 can be calculated using Monte Carlo methods. An upper limit on the activity can also be placed, assuming that the region of the crystal has a line-of-sight view of a contaminated surface with average surface activity . The limit is then
| (10) |
where the equality holds if all of the solid angle that the sensitive area “sees” is emitting alphas at the surface rate (and Eq. 8 is the limiting case for this). Equation 10 holds via a simple flux argument.
| Source | Activity | Background Rate | |
| [Bq/cm2] | [Counts in ROI / t-y] | ||
| p-pc | n-type | ||
| Clean Room | 0.16 | 70 | |
| In Situ Detector | 0.14 | 61 | |
| MJ BG Model | 0.08 | 35 | |
| SNO 3He Detector | 0.0008 | 0.35 | |
The susceptible surface of a modified p-pc detector, located right at the point contact, only has a direct line-of-sight with the detector mount. Alphas can only pose a background if they originate from surface plate-out (on the surface of the detector or the detector mount) or from the bulk material of the detector mount. Because of this compartmentalization, the rate of alpha backgrounds (in counts per tonne-year) should be the same regardless of the number of detectors. The rate formula for p-pcs (Eq. 9) would still be valid, then, for a one-tonne scale experiment made up of p-pc detectors with the same susceptibility factor . The usage of p-pc detectors is extremely beneficial to Majorana from a surface-alpha standpoint (to say nothing of their other important qualities). As Table 4 notes, the difference in surface-alpha background rates between p-pc detectors and n-types is large. Without further cuts from pulse-shape analysis, Table 4 makes it clear that n-type detectors are unsuitable for experiments without heroic measures to limit surface activity. A final comment should be made about the passivated surface–the annulus of material between the and surfaces. This area has 10 times the surface of the layer for the modified p-pc detectors, and so must be addressed. Our test stand was modified to allow the 241Am source to have a direct shine path on the passivated surface of the crystal. Not only were no alphas present visible in the resultant energy spectrum, but no 59 keV gammas were visible either. If the passivated surface were as susceptible to alphas as the surface, the background count rate from a given surface contamination would increase by a factor of 10, but still be far better than that from n-type detectors. We are continuing to study the issue.
5 Conclusion
We built a test stand for the purpose of studying surface-alpha decays of radioactive isotopes on surfaces of HPGe detectors. A simple detector response model was constructed and fit to test-stand data, and Geant4 simulations were compared with test stand data and the detector response model. The efficacy of simulations of surface-alpha decays for experiments was examined and we propose a correction factor to be used for such simulations. We calculate allowable contamination values for n-type and p-pc HPGe detectors used in double-beta decay searches given desired surface-alpha background assumptions.
Acknowledgements
We gratefully acknowledge support from the Office of Nuclear Physics in the U.S. Department of Energy (DOE) Office of Science under grant numbers DE-FG02-97ER4104, DE- FG02-97ER41033, and DE-FG02-97ER41020 as well as contract number 2011LANLE9BW. We also acknowledge the support of the DOE through the the LANL/LDRD program. Finally, we thank our friends and hosts at the Waste Isolation Pilot Plant (WIPP) for their continuing support of our activities underground at that facility.
References
- Elliott and Vogel [2002] S. R. Elliott, P. Vogel, Annu. Rev. Nucl. Part. Sci. 52 (2002) 115–151.
- Elliott and Engel [2004] S. R. Elliott, J. Engel, J.Phys.G G30 (2004) R183.
- Ejiri [2005] H. Ejiri, Journal of the Physical Society of Japan 74 (2005) 2101–2127.
- Frank T. Avignone, III, Steven R. Elliott, and Jonathan Engel [2008] Frank T. Avignone, III, Steven R. Elliott, and Jonathan Engel, Rev. Mod. Phys. 80 (2008) 481–516.
- Klapdor-Kleingrothaus et al. [2001] H. Klapdor-Kleingrothaus, et al., Eur. Phys. J. A 12 (2001) 147.
- Schubert et al. [2011] A. G. Schubert, et al., to be published in AIP Conference Proceedings, 19th Particles & Nuclei International Conference (PANIC 2011), Massachusetts Institute of Technology, Cambridge, MA, USA (2011). arXiv:1109.1567 [nucl-ex].
- Phillips et al. [2011] D. G. Phillips, et al., to be published in Rutherford Centennial Conference on Nuclear Physics Proceedings. University of Manchester, Manchester UK (2011). arXiv:1111.5578 [nucl-ex].
- Aguayo et al. [2011] E. Aguayo, et al., to be published in the Proceedings of the DPF-2011 Conference, Providence, RI, USA (2011). arXiv:1109.6913 [nucl-ex].
- Schonert et al. [2005] S. Schonert, et al., Nucl. Phys. B145 (2005) 242.
- Janicsko-Csathy [2009] J. Janicsko-Csathy, Nucl. Phys. Proc. Suppl. 188 (2009) 68–70.
- Barbeau et al. [2007] P. S. Barbeau, J. I. Collar, O. Tench, JCAP 09 (2007) 009.
- Agostini et al. [2011] M. Agostini, B. M., E. Brugnera, R. Cattadori, A. C.M., D’Andragora, A. di Vacri, A. Garfagnini, M. Laubenstein, L. Pandola, C. A. Ur, JINST 6 (2011) P04005.
- Leung [2006] M. Leung, The Borexino Solar Neutrino Experiment: Scintillator Purification and Surface Contamination, Ph.D. thesis, Princeton, 2006.
- Stonehill [2005] L. C. Stonehill, Deployment and Background Characterization of the Sudbury Neutrino Observatory Neutral Current Detectors, Ph.D. thesis, University of Washington, 2005.
- ORTEC [2010] ORTEC, 2010. Advanced Measurement Technology, Inc, http://ortec-online.com.
- Basunia [2006] M. Basunia, Nuclear Data Sheets 107 (2006) 3323.
- Isotope Products Laboratories [2008] Isotope Products Laboratories , 2008. http://isotopeproducts.com.
- Nakamura et al. [2010] K. Nakamura, et al., Journal of Physics G 37 (2010) 075021.
- Sigmund [2006] P. Sigmund, Particle Penetration and Radiation Effects, Springer, 2006.
- Knoll [2000] G. F. Knoll, Radiation Detection and Measurement, John Wiley & Sons, 2000.
- Goodfellow Corp. [2007] Goodfellow Corp., 2007. http://www.goodfellow.com.
- Berger et al. [2005] M. Berger, et al., Stopping-power and range tables for electrons, protons, and helium ions, 2005. http://www.nist.gov/physlab/data/star/index.cfm.
- Klapdor-Kleingrothaus and Krivosheina [2006] H. V. Klapdor-Kleingrothaus, I. Krivosheina, Mod. Phys. Lett. A21 (2006) 1547.
- Amsbaugh et al. [2007] J. F. Amsbaugh, et al., Nucl. Instrum. Meth. A579 (2007) 1054–1080.