1–12
Panchromatic properties of galaxies in wide-field optical
spectroscopic and photometric surveys
Abstract
The past 15 years have seen an explosion in the number of redshifts recovered via wide area spectroscopic surveys. At the current time there are approximately 2million spectroscopic galaxy redshifts known (and rising) which represents an extraordinary growth since the pioneering work of Marc Davis and John Huchra. Similarly there has been a parallel explosion in wavelength coverage with imaging surveys progressing from single band, to multi-band, to truly multiwavelength or pan-chromatic involving the coordination of multiple facilities. With these empirically motivated studies has come a wealth of new discoveries impacting almost all areas of astrophysics. Today individual surveys, as best demonstrated by the Sloan Digital Sky Survey, now rank shoulder-to-shoulder alongside major facilities. In the coming years this trend is set to continue as we being the process of designing and conducting the next generation of spectroscopic surveys supported by multi-facility wavelength coverage.
keywords:
galaxies: distances and redshifts galaxies: evolution galaxies: formation galaxies: fundamental parameters (classification, colors, luminosities, masses, radii, etc.)1 Introduction
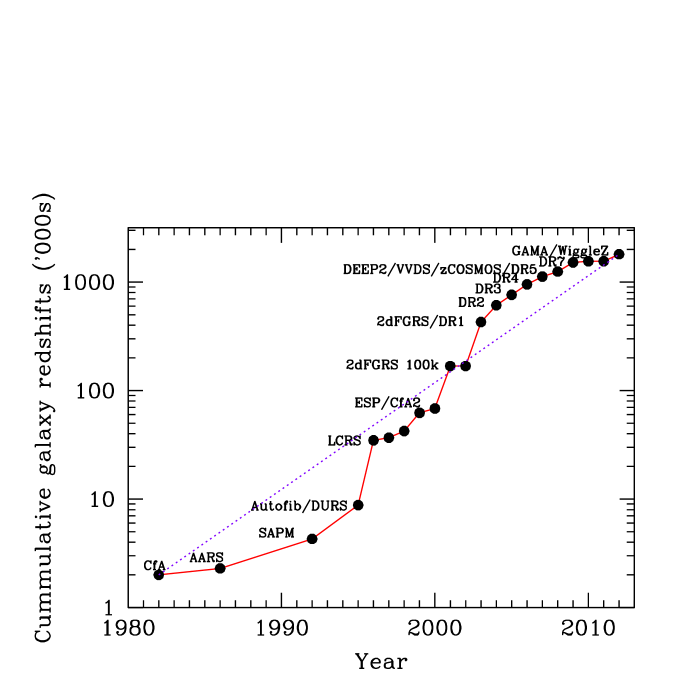
This article briefly summarises the development of wide field spectroscopic survey programs in extragalactic astronomy (see Fig. 1, Table. 1), and their impact as measured in publications and citations (see Table. 2). The statistics shown in Table. 2 are necessarily crude but indicative of the major revolution which is overtaking our subject — the rise of surveys over facilities. Whereas once the key question senior astronomers might ask of each other seemed to be “so what are you building?”, in this age of internationally funded mega-facilities, the more pertinent question might be “so what survey are you designing?”. The likely answer will be one which combines both spectroscopic information with panchromatic imaging. Traditionally imaging surveys, as pioneered by the various Schmidt surveys, were single bandpass () and then later double bandpass (). These were followed by a move to multi-band programs (e.g., , , ) which used multiple filters to fill in the wavelength gaps but still remain single facility imaging surveys. Truly multiwavelength surveys span more than one imaging facility, and panchromatic surveys span multiple facilities covering a significant fraction of the em-spectrum (e.g., GOODS; Giavalisco et al., 2004; GAMA; Driver et al., 2011). This trend, towards broader spectral coverage, is driven not only by technological advancement but also by an appreciation that galaxies in particular emit significant levels of radiation at almost all wavelengths and to truly understand their nature will require robust distances combined with total energy measurements.
2 Do we still need spectroscopic surveys?
Figure 1 shows the increase in the cumulative number of known galaxy redshifts (AGN are not included here) and the prominent surveys are listed in Table 1. The most notable are of course the Sloan Digital Sky Survey (SDSS; York et al., 2000), and the two-degree field galaxy redshift survey (2dFGRS; Colless et al., 2001). Between them these surveys account for over half the known redshifts and even more importantly both surveys have very clean selection criteria ( and respectively).
| Survey | Reference | Facility | Selection | Redshifts |
|---|---|---|---|---|
| CfA | Davis et al., (1982) | Mt Hopkins 1.5m/Z-machine | 2k | |
| AARS | Peterson et al., (1986) | AAT/RGO | 0.3k | |
| SARS | Loveday et al., (1992) | MSSSO 2.3m/DBS | 2k | |
| Autofib | Ellis et al., (1996) | AAT/Autofib | 1k | |
| DURS | Ratcliffe et al., (1996) | UKST/FLAIR | 2.5k | |
| LCRS | Schectman et al., (1996) | DuPont/MOS | 26k | |
| CFRS | Lilly et al., (1996) | CFHT/MOS | 1k | |
| CS | Geller et al., (1997) | Various | 2k | |
| ESP | Vettolani et al., (1997) | ESO 3.6m/OPTOPUS | 4k | |
| SSRS2 | da Costa et al., (1998) | Various | 5.5k | |
| CfA2 | Falco et al., (1999) | Various | 20k | |
| CNOC2 | Yee et al., (2000) | CFHT/MOS | 6k | |
| 2dFGRS | Colless et al., (2001) | AAT/2dF | 227k | |
| SDSS Main | Strauss et al., (2002) | SDSS 2.5m/Spectrographs | 930k | |
| SDSS LRG | Eisenstein et al., (2002) | SDSS 2.5m/Spectrographs | 120k | |
| DEEP1&2 | Davis et al., (2003) | Keck/Deimos | 51k | |
| H-AAO | Huang et al., (2003) | AAT/2dF | 1k | |
| MGC | Driver et al., (2005) | AAT/2dF | 10k | |
| SDSS Stripe82 | Baldry et al., (2005) | SDSS/Spectrographs | 70k | |
| 2SLAQ-LRG | Cannon et al., (2006) | AAT/2dF | 13k | |
| 6dfGRS | Jones et al.,(2009) | UKST/6dF | + | 110k |
| VVDS-wide | Garilli et al.,(2008) | VLT/VIMOS | 35k | |
| VVDS-deep | Le Fevre et al.,(2005) | VLT/VIMOS | 12k(150k) | |
| VVDS-ultradeep | Le Fevre et al.,(2005) | VLT/VIMOS | 0k(1k) | |
| zCOSMOS-bright | Lilly et al., (2007) | VLT/VIMOS | 10k(20k) | |
| zCOSMOS-deep | Lilly et al., (2007) | VLT/VIMOS | 1k(10k) | |
| WiggleZ | Drinkwater et al. (2010) | AAT/AAOmega | + | 250k |
| AGES | Kochaneck et al. (2011) | MMT/Hectospec | + | 19k |
| GAMA | Driver et al. (2011) | AAT/AAOmega | 180k(350k) | |
| Vipers | N/A | VLT/VIMOS | 20k(100k) | |
| BOSS | N/A | SDSS 2.5m/Spectrographs | 500k(1500k) |
The majority of the information shown in this table was kindly provided by Ivan Baldry (see http://www.astro.ljmu.ac.uk/ikb/research/galaxy-redshift-surveys.html) which was used to produce Fig. 1 in Baldry et al., (2010).
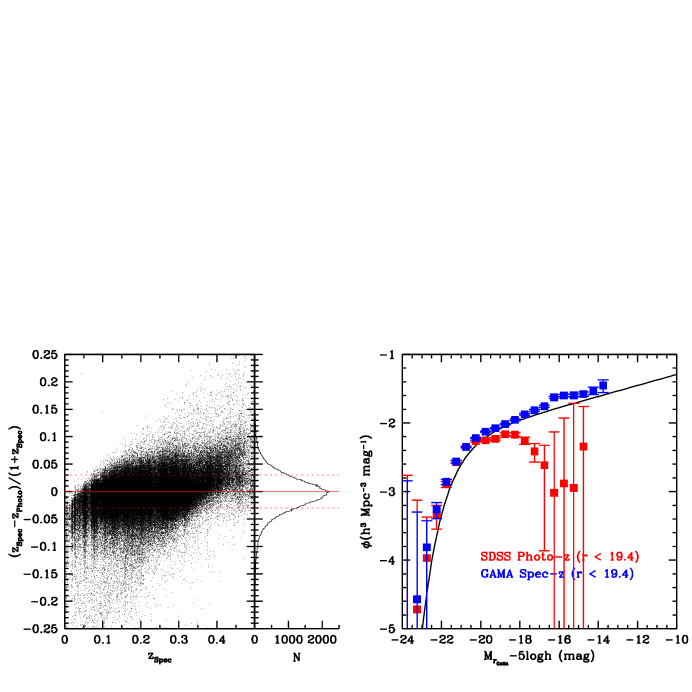
However this rise in spectroscopic surveys has been matched by an expansion in wavelength coverage which has led to the realisation of photometric redshifts (e.g., ANNz; Collister & Lahav 2004, see Fig. 2 (left)). Photometric redshifts allow one to bypass the laborious process of conducting a spectroscopic program by using the continuum shape (and in particular the 4000Å break and the Lyman-limit) to estimate distance. Comparisons between photometric and spectroscopic surveys are impressive with typical accuracies running at (Collister & Lahav 2004). Purpose built photo-z surveys such as COMBO-17 (Wolf et al 2003), which uses a 17 medium band filter set — essentially producing a very low dispersion spectrum — can improve upon this accuracy even further (; Wolfe et al., 2008). This rise in photometric redshifts begs the question as to whether we still actually need large scale spectroscopic programs rather than simply conducting spot test checks of photo-z cats. For large scale statistical studies this is probably true but the following three points argue for some caution:
1) At low redshift: At low redshift the typically photo-z error becomes significant. This is easily demonstrated by constructing a luminosity function using entirely photometric or spectroscopic redshifts via a simple estimator. Fig. 2 (left) shows the photo-z v spec-z comparison for 53k galaxies from the GAMA survey which generally appears well behaved. However Fig. 2 (right) shows the corresponding derived luminosity functions with somewhat disastrous implications for the faint-end slope. This is because photo-z’s are generally calibrated for the most numerous galaxy type within ones’ training set. Galaxies with divergent properties can have significant systematic errors leading to the kind of severe bias shown in Fig. 2 (right).
2) When fidelity is required: Fig. 3 shows a typical cone diagram for the GAMA 12hr region using photometric (upper) or spectroscopic (lower) redshifts. While statistically one can still recover some sense of the generic clustering properties (suitable for cosmology) it is clearly impractical to use photo-z’s to identify individual filaments, clusters, or groups and their associated masses. High fidelity studies are likely to be a key focus area in the coming years as we look to distinguish between the influence of environment and halo mass (Haas, Schaye & Jeeson-Daniel 2011).

3) When the test galaxies extend beyond the calibration data. Photometric redshifts make use of the 4000Å break and are typically calibrated to bright and local spectroscopic redshift samples which exhibit strong 4000Å breaks. However the break is less apparent in star-forming systems. As one progresses either to lower mass systems in the nearby Universe or to high redshift massive systems one moves to more star-forming populations which exhibit flatter spectra and the likelihood of confusion increases.
3 High impact photo-z and spectro-z surveys
Despite these concerns photo-z’s have proved invaluable in many areas and in particular for the interpretation of data seen in the very deep fields obtained by the Hubble Space Telescope. Table 2 attempts to provide some indication of the impact of many of the spectroscopic and photometric redshift surveys over the past few decades. The landscape is generally dominated by two nearby spectroscopic programmes (SDSS, 2dFGRS), coupled with deep HST studies (HDF, GOODS, COSMOS), and forays into new wavelengths (2MASS, GOODS, GALEX) all of which build upon the pioneering work on the CfA surveys.
| Survey | Papers | Citations |
|---|---|---|
| Sloan Digital Sky Survey (SDSS) | 3254 | 135330 |
| Hubble Deep Field (HDF) | 590 | 46360 |
| Two Micron All Sky Survey (2MASS) | 968 | 27253 |
| Two degree Field Galaxy Redshift Survey (2dFGRS) | 197 | 23219 |
| Great Observatories Origins Deep Survey (GOODS) | 498 | 24578 |
| Centre for Astrophysics (CfA) | 263 | 11989 |
| Galaxy Evolution Explorer GALEX) | 465 | 11560 |
| Canada France Redshift Survey (CFRS) | 90 | 8493 |
| Cosmic Evolution Survey (COSMOS) | 241 | 7354 |
| Ultra Deep Field (UDF) | 188 | 7237 |
| Classifying Objects by Medium-Band Observations (COMBO-17) | 86 | 6088 |
| Deep Evolutionary Exploratory Probe (DEEP) | 113 | 5118 |
| Las Campanas Redshift Survey (LCRS) | 96 | 4063 |
| APM Galaxy Survey (APMGS) | 57 | 4058 |
| VIMOS VLT Deep Survey (VVDS) | 75 | 3689 |
| UKIRT Infrared Deep Sky Survey (UKIDSS) | 105 | 3444 |
| Southern Sky Redshift Survey 2 (SSRS2) | 72 | 3421 |
| Point Source Catalogue Survey (PSCz) | 94 | 3270 |
| 2dF QSO redshift Survey (2QZ) | 53 | 2930 |
| Galaxy Evolution from Morphologies and SEDs (GEMs) | 62 | 2696 |
| NOAO Deep Wide Field Survey (NDFWS) | 77 | 2555 |
| CFHT Legacy Survey (CFHTLS) | 72 | 2442 |
| Millennium Galaxy Catalogue (MGC) | 32 | 1590 |
| zCOSMOS | 47 | 1567 |
| Stromlo-APM Redshift Survey (SARS) | 19 | 1389 |
| AGN and Galaxy Evolution Survey (AGES) | 31 | 1337 |
| Gemini Deep Deep Survey (GDDS) | 20 | 1304 |
| The 2dF-SDSS LRG And QSO Survey (2SLAQ) | 33 | 1280 |
| Canadian Network for Observational Cosmology Field Galaxy Redshift Survey (CNOC2) | 37 | 1249 |
| ESO Slice Project (ESP) | 24 | 939 |
| The 6dF Galaxy Survey (6dFGS) | 22 | 535 |
| Baryonic Acoustic Oscillations Survey (BOSS) | 20 | 370 |
| Galaxy And Mass Assembly (GAMA) | 19 | 213 |
| WiggleZ | 14 | 194 |
Note these numbers were determined on Dec 2011 using the SOA/NASA ADS Astronomy Query Form by searching for refereed papers which contained abstract keywords based on the following boolean logic: (galaxy or galaxies) and (long survey name or short survey name). The table is purely indicative and not weighted by survey age or effective cost. My apologies in advance for the many surveys not included.
4 Selected Highlights
It is obviously an impossible task to try and summarise all the papers covered by the surveys shown in Table 2 but below I provide some personal reflections on the areas which have most interested me (apologies in advance for the obvious bias):
4.1 Luminosity Functions
An original motivation for many surveys has been the measurement of the galaxy luminosity function which describes the space density of galaxies. Over the past 10 years this has now been measured in UV/optical and near-IR bands and from redshift zero to relatively high-redshifts (see for example: Cole et al., 2001; Bell et al., 2003; Blanton et al., 2003, 2005; Bouwens et al., 2006, 2007; Faber et al., 2007; Hill et al., 2010; Robotham & Driver 2011). Although the bright-end is generally well defined and well behaved the faint-end and the implied space-density of dwarf systems remains elusive. This is because of both the Eddington bias as well as the intrinsic low surface brightness nature of these systems which places their peak central surface brightnesses below the detection thresholds of the imaging surveys. However it is also becoming clear that while the Universe is not filled with giant low surface brightness galaxies a key issue is our ability to accurately recover the fluxes of even the most luminous systems. Two key questions are: how much light are we missing around luminous systems, and how many dwarfs lie below our thresholds. The upcoming deep optical surveys (VST, PanSTARRs, DES, LSST) should be able to clarify both issues.
4.2 Stellar Mass Measurements and the Galaxy Stellar Mass Function
The past ten years has also seen a movement away from luminosity functions to the more fundamental stellar mass functions. Motivated by credible stellar mass estimates (e.g., Bell & de Jong 2001; Kauffmann et al., 2003a; Bundy et al., 2006; Taylor et al.,2011). Typically alternative mass estimates agree to within a factor of 2 which has allowed the construction of relatively consistent, and therefore presumably robust, stellar mass functions (e.g., Bell et al., 2003; Baldry et al., 2008, 2011; Fontana et al., 2004; Ilbert et al., 2010). Our Universe appears to have a stellar mass density of order (4% of the baryonic mass density, Baldry et al., 2011) with the evolution of the mass functions implying a relatively linear build-up of log stellar mass with redshift (see Sawicki 2011). One key issue is that the current estimates of stellar mass appear to be a factor of two higher than what one expects from the cosmic star-formation history using a standard IMF (Wilkins, Trentham & Hopkins 2008). This issue had also been explored earlier by Baldry & Glazebrook (2003) who proposed a modified-IMF to resolve this issue which opens Pandora’s Box on the question of an evolving IMF (see for example Dave 2008).
4.3 Galaxy Bimodality - Bimodality or Duality?
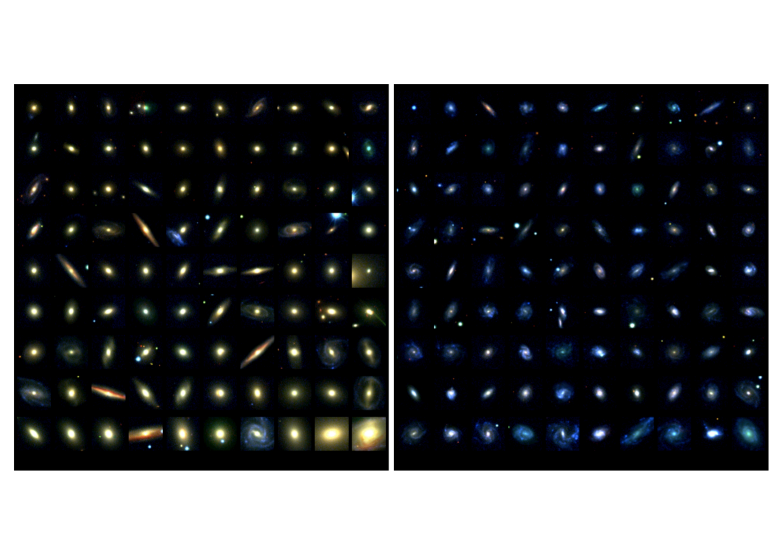
Perhaps one of the strongest themes has been the rediscovery (c.f. Baum 1959) of galaxy bimodality (e.g., Strateva et al., 2001; Baldry et al., 2004, 2006; Driver et al., 2006). Samples are now routinely divided into red and blue subsets. Like Christmas LEDs which spontaneously change colour as star-formation is quenched, unquenched and quenched again. Looking at the images in Fig. 4 I’m tempted to think the key point has been missed. On the whole the red and blue samples show not only a marked difference in colour but also in morphology. While quenching and unquenching may be a plausible explanation for the colour change it is significantly harder to identify a mechanism which readily modifies, compresses, and stretches the morphologies (defined by the energy in the stellar orbits). In my mind it seems the more elegant way forward is to recognise not the bimodality of galaxies but the duality, or dual nature, with galaxies typically comprising of a bulge and/or disc component. In looking at Fig. 4 it is also clear that the red sample is a mixed bag containing: spheroids, anemic spirals, and reddened spirals. This becomes more apparent when one divides the sample by Sérsic index rather than colour and finds an equally distinct bimodality but with less overlap with the colour-split sample than one would like.
Unfortunately considering the dual nature of galaxies is far harder than a simple global bimodality split as it requires bulge-disc decomposition which in turn requires high spatially resolved high signal-to-noise data. Numerous groups are now embarked on this endeavour both at low and high redshift (Kelvin et al., 2011; Simard et al., 2011). One surprise which did stem from early work in this direction (Allen et al., 2006; Driver et al., 2007a) is that while the red peak might well contain 60% of the stellar mass only half of this is in spheroid structures such that only 40% of the stellar mass in total resides in spheroids and the remaining 60% in discs. This is perhaps at odds with a CDM hierarchical merger picture but, confirmed by Gadotti (2009) and Tasca & White (2011), appears to be a result that is here to stay. So how then in a backdrop of hierarchical merging, in which discs are easily disrupted, can the majority of the stellar mass reside in dynamically thin fragile discs? It is also worth noting that this must be a lower limit as numerous discs must form which ultimately merge into spheroids such that some component of the spheroids stellar mass also formed via the disc formation process. In fact it begs the questions to whether merger-induced star-formation is an almost negligible phenomena and that the majority of stars are actually formed via direct gas infall – as now argued by some simulations (L’Huillier, Combes & Semelin 2011) and directly observed (e.g., Sancisi et al., 2008).
4.4 Dust Attenuation
As highlighted by the obvious very red edge-on spiral interlopers in Fig. 4 we see than dust attenuation is a significant factor typically contaminating red samples at the 5-10% level (simply from counting the obvious edge-on systems in Fig. 4). While we now have a good understanding of the dust attenuation law (e.g., Calzetti et al., 2000), and viable radiative transfer models (Popescu et al. 2011), what is not clear is how the dust properties vary with galaxy type, environment, or redshift. Although somewhat low profile work Choi, Park & Vogeley (2007), Shao et al., 2007, Driver et al (2007b; 2008) and Masters et al., (2010) have all highlighted the severe impact that dust attenuation can have with implied optical bandpass corrections measured in magnitudes. In Driver et al., (2008) we showed that in the band discs may be attenuated by as much as 1 magnitude while bulges by upto 2-3 magnitudes — depending on inclination. This is a result which is shocking to the optical astronomers who routinely ignore intrinsic dust attenuation, but well established to the far-IR community. Surveys such as GAMA (Driver et al., 2011) which aim to combine UV, optical, near-IR, mid-IR and far-IR with a high fidelity spectroscopic data will be vital to untangle this mess.
4.5 The mass-metalicity relation
A particularly elegant result of the past ten years has been the beautiful mass-metalicity relation identified in SDSS and other datasets (see in particular: Tremonti et al., 2004; Savaglio et al., 2005; Erb et al., 2006). Baldry, Glazebrook & Driver (2008) argue that this relation is an inevitable consequence of the variation in star-formation efficiency with stellar mass. It could also be a combination of star-formation efficiency (i.e., fraction of gas used, inflows/outflows and IMF variation). A possible complicating factor comes from consideration of the IGIMF (Wiedner & Kroupa 2006) in which more massive galaxies preferentially host more massive star-formation regions leading to more enriched gas because the upper end of the IMF is more likely to be populated
4.6 The growth of galaxy sizes
Slightly lower profile but entirely orthogonal is the work on mass-size relations (e.g., Shen et al., 2003; Blanton et al., 2005; Driver et al., 2005). This has the potential to connect observable galaxy sizes with the underlying halo spin parameter (i.e., the old Fall & Efstathiou 1988 connection, see also Dalcanton, Spergel & Summers 1998 and Mo, Mao and White 1998). More effort needs to be invested in the numerical and simulation side however very nice clean cut empirical results seem to be emerging the work of Trujillo et al. (2006; 2007) which finds significant evolution in galaxy sizes with redshift. The obvious implication is that galaxies are visibly growing from the inside out. In my world of duality this fits rather nicely with the idea that we’re witnessing the late formation and growth of discs around the old pre-formed bulges. However other ideas which involve a dynamical relaxation in which the galaxy core moves inward while the outer regions move outwards have also been proposed.
4.7 The cosmic star-formation rate
Finally one cannot not fail to mention the great advances in measuring star-formation rates starting from the seminal work of the CFRS and HDF studies (Lilly et al., 1996; Madau et al., 1996), coupled with the more local and exhaustive studies by Kauffmann et al., (2003b); Brinchmann et al., (2004); Juneau et al., (2005) Salim et al., (2007). The compilation of Hopkins & Beacom (2006) provides what appears to be a very firm and mature insight into the overall cosmic star-formation history history with subsequent studies now finding significant distinction by mass (e.g., Pozzetti et al. 2007) — i.e., cosmic downsizing.
5 Summary
The above is a very brief précis which tries in some way to acknowledge the efforts of those who have designed and led these surveys, to temper our appetite for photometric redshifts with some words of caution, and to mention in passing a small fraction of the high-note papers and results in this subject over the past decade. The next decade will see survey expansion continue as we push deeper at optical wavelengths (VST, VISTA, PanSTARRs, DES, LSST, Euclid), but perhaps more significant the expansion in wavelength with public releases imminent of the WISE mid-IR and Herschel Far-IR data. These in turn will be followed by major X-ray (XMM-XLL) and Radio programs (ASKAP, MeerKAT) which will enable the start of truly panchromatic surveys which will allow for the comprehensive and simultaneous study of the AGN, gas, dust, and stellar components as a function of environment, and distance. These mega-surveys will then feed Integral Field Unit (IFU) and multi-IFU follow-up which will provide spatial studies of the internal dynamics and chemistry of well defined sub-samples. Exciting times.
I’d like to thank the organisers for a very enjoyable meeting and conclude by dedicating this article to the memory of John Huchra who really started something.
-
Allen P.D., Driver S.P., Graham A.W., Cameron E., Liske J., De Propris R., 2006, MNRAS, 371, 2
-
Baldry I.K., Glazebrook K., 2003, ApJ, 593, 258
-
Baldry I.K., Glazebrook K., Brinkmann J., Ivezic Z., Lupton R.H., Nichol R.C., Szalay A.S., 2004, ApJ, 600, 681
-
Baldry I.K., et al., 2005, MNRAS, 358, 441
-
Baldry I.K., Balogh M.L., Bower R.G., Glazebrook K., Nichol R.C., Bamford S.P., Budavari T., 2006, MNRAS, 373, 469
-
Baldry I.K., GLazebrook K., Driver S.P., 2008, MNRAS, 388, 945
-
Baldry I.K., et al., 2010, MNRAS, 404, 86
-
Baldry I.K., et al., 2011, MNRAS, in press (arXiv:1111.5707)
-
Baum W.A., 1959, PASP, 71, 106
-
Bell E.F., de Jong R.S., 2001, ApJ, 550, 212
-
Bell E.F., McIntosh D.H., Katz N., Weinberg M.D., 2003, ApJS, 149, 289
-
Blanton M.R., et al., 2003, ApJ, 592, 819
-
Blanton M.R., et al., 2005, AJ, 129, 2562
-
Bouwens R.J., Illingworth G.D., Blakeslee J.P., Franx M., 2006, ApJ, 653, 53
-
Bouwens R.J., Illingworth G.D., Franx M., Ford H., 2007, ApJ, 670, 928
-
Brinchmann J., Charlot S., White S.D.M., Tremonti C., Kauffmann G., Heckman T., Brinkmann J., 2004, MNRAS, 351, 1151
-
Bundy K., et al., 2006, ApJ, 651, 120
-
Calzetti D., Armus L., Bohlin R.C., Kinney A.L., Koornneef J., Storchi-Bergmann T., 2000, ApJ, 533, 682
-
Choi Y-Y., Park C., Vogeley M.S., 2007, ApJ, 658, 884
-
Cole S., et al., 2001, MNRAS, 326, 255
-
Collister A., Lahav O., 2004, PASP, 116, 345
-
Canon R., et al., 2006, MNRAS, 372, 425
-
Colless M.M., et al., 2001, MNRAS, 328, 1039
-
da Costa L., et al., 1998, AJ, 116, 1
-
Dave R., 2008, 385, 147¡
-
Davis M., Huchra J., Latham D.W., Tonry J., 1982, ApJ, 253, 423
-
Davis M., et al., 2003, SPIE, 4843, 161
-
Dalcanton J., Spergel D.N., Summers F.J., 1997, ApJ, 482, 659
-
Drinkwater M.J., et al., 2010, MNRAS, 401, 1429
-
Driver S.P., Liske J., Cross N.J.G., De Propris R., Allen P.D., 2005, MNRAS, 360, 81
-
Driver S.P., Allen P.D., Graham A.W., Cameron E., Liske J., Ellis S.C., Cross N.J.G., De Propris R., Phillipps S., Couch W.J., 2006, MNRAS, 368, 414
-
Driver S.P., Allen P.D., Liske J., Graham A.W., 2007, ApJ, 657, 85
-
Driver S.P., Popescu C.C., Tuffs R.J., Liske J., Graham A.W., Allen P.D., De Propris R., 2007, MNRAS, 379, 1022
-
Driver S.P., Popescu C.C., Tuffs R.J., Graham A.W., Liske J., Baldry I.K., 2008, ApJ, 678, 101
-
Driver S.P., et al., 2011, MNRAS, 413, 971
-
Eisenstein D.J., et al., 2001, AJ, 122, 2267
-
Ellis R.S., Colless M., Broadhurst T., Heyl J., Glazebrook K., 1996, MNRAS, 280, 235
-
Erb D.S., Shapley A.E., Pettini M., Steidel C.C., Reddy N.A., Adelberger K.L., 2006, ApJ, 644, 813
-
Faber S., et al., 2007, ApJ, 665, 265
-
Falco E.E., et al., 1999, PASP, 758, 438
-
Fall S.M., Efstathiou G., 1980, MNRAS, 193, 189
-
Fontana A., et al., 2004, A&A, 424, 23
-
Gadotti D., 2009, MNRAS, 393, 1531
-
Garilli B., et al., 2008, A&A, 486, 683
-
Geller M., et al., 1997, AJ, 114, 2205
-
Giavalisco M., et al., 2004, ApJ, 600, L93
-
Gunawardhana M.L.P., et al., 2011, MNRAS, 415, 1647
-
Haas M.R., Schaye J., Jeeson-Daniel A., 2011, MNRAS, in press (arXiv: 1103.0547)
-
Hopkins A.M., Beacom J.F., 2006, ApJ, 651, 142
-
Hill D.T., Driver S.P., Cameron E., Cross N.J.G., Liske J., Robotham A., 2010, MNRAS, 404, 1215
-
Huang J.-S., Glazebrook K., Cowie L.L., Tinney C., 2003, ApJ, 584, 203
-
Ilbert O., et al., 2010, ApJ, 709, 644
-
Jones H., et al., 2009, MNRAS, 399, 683
-
Juneau S., et al., 2005, ApJ, 619, 135
-
Kauffmann G., et al., 2003a, MNRAS, 341, 33
-
Kauffmann G., et al., 2003b, MNRAS, 341, 54
-
Kelvin L.S., et al., 2012, MNRAS, in press (arXiv:1112.1956)
-
Kochaneck C.S., et al., 2011, ApJS, in press (arXiv:1110.4371)
-
L’Huillier B., Combes F., Semelin B., 2011, A&A, in press (arXiv:1108.4247)
-
Le Fèvre O., et al., 2005, A&A, 439, 845
-
Lilly S.J., Fevre O., Crampton D., Hammer F., Tresse L., 1995, ApJ, 455, 50
-
Lilly S.J., Le Fevre O., Hammer F., Crampton D., 1996, ApJ, 460, 1
-
Lilly S.J., et al., 2007, ApJS, 172, 70
-
Loveday J., Peterson B.A., Efstathiou G., Maddox S.J., 1992, ApJ, 390, 338
-
Madau P., Ferguson H.C., Dickinson M.E., Giavalisco M., Steidel C.C., Fruchter A., 1996, MNRAS, 283, 1388
-
Masters K., et al., 2010, MNRAS¡ 404, 792
-
Mo H.J., Mao S., White S.D.M., 1998, MNRAS, 295, 319
-
Peterson B.A., Ellis R.S., Efstathiou G., Shanks T., Bean A.J., Fong R., Zen-Long Z., 1986, MNRAS, 221, 233
-
Popescu C.C., Tuffs R.J., Dopita M.A., Fischera J., Kylafis N.D., Madore B.F., 2011, A&A, 527, 109
-
Pozzetti L., et al., 2007, A&A, 474, 443
-
Ratcliffe A., Shanks T., Broadbent A., Parker Q.A., Watson F.G., Oates A.P., Fong R., Collins C.A., 1996, MNRAS, 281, 47
-
Robotham A.S.G., Driver S.P., 2011, MNRAS, 413, 2570
-
Salim S., et al., 2007, ApJS, 173, 267
-
Sancisi R., Fraternall F., Oosterloo T., van der Hulst J.M., 2008, A&A Rv, 15, 189
-
Sawicki M., 2011, MNRAS, in press (arXiv:1108.5186)
-
Savaglio S., et al., 2005, ApJ, 635, 260
-
Schectman S.A., Landy S.D., Oemler A., Tucker D.L., Lin H., Kirschner R.P., Schechter P.L., 1996, ApJ, 470, 172
-
Shao Z., Xiao Q., Shen S., Mo H.J., Xia X., Deng Z., 2007, ApJ, 659, 1159
-
Shen S., et al., 2003, MNRAS, 343, 978
-
Simard L., Mendel J.T., Patton D.R., Ellison S.L., McConnachie Alan W., 2011, ApJS, 196, 11
-
Strateva I., et al., 2001, AJ, 112, 1861
-
Strauss M.A., et al., 2002, AJ, 124, 1810
-
Tasca L.A.M., White S.D.M., 2011, A&A, 530, 106
-
Taylor E., et al., 2011, MNRAS, 418, 1587
-
Tremonti C.A., et al., 2004, ApJ, 613, 898
-
Trujillo I., et al., 2006, ApJ, 650, 18
-
Trujillo I., et al., 2007, MNRAS, 382, 109
-
Vettolani G., et al., 1997, 325, 954
-
Wilkins S.M., Trentham N., Hopkins A., 2008, MNRAS, 385, 687
-
Wolf C., Meisenheimer K., Rix H.-W., Borch A., Dye S., Kleinheinrich M., 2003, A&A, 401, 73
-
Wolf C., Hildebrandt H., Taylor E.N., Meisenheimer K., 2008, A&A, 492, 933
-
Yee H.K.C., et al., 2000, ApJS, 129, 475
-
York D., et al., 2000, AJ, 120, 1579