Testing three derivative methods of stellar population synthesis models
Abstract
The number of methods used to study the properties of galaxies is increased, and testing these methods is very important. Galactic globular clusters (GCs) provide an excellent medium for such test, because they can be considered as simple stellar populations. We present ages and metallicities for 40 Galactic GCs as determined from three publicly available techniques, including colour, Lick-index and spectrum-fitting methods, based on Bruzual & Charlot evolutionary population synthesis (EPS) models. By comparing with the ages obtained from colour-magnitude diagrams (CMDs) and metallicities obtained from spectra of stars, we are able to estimate the ability of these methods on determination of GCs parameters, which is absolutely necessary. As a result, we find that: (i) for the metallicity, our derived metallicities agree with those derived from the spectra of stars, Lick-index method is suitable to study metallicity for the stellar population systems in the range of [Fe/H] and spectrum-fitting method is suitable to study metallicity for the stellar population systems in the range of [Fe/H]; (ii) for the age, these three methods have difficulties in age determination, our derived ages are smaller (about 2.0 Gyr, on average) than the results of CMDs for all these three methods. We use Vazdekis and Maraston models to analyze whether our results are dependent on EPS models, and find that the tendency of these two models is the same as that of Bruzual & Charlot models. Our results are independent of the EPS models. In addition, our test is based on the old GCs and our conclusions may hold for old stellar population systems.
Besides the age-metallicity degeneracy, we examine the possible effects of other factors (horizontal branch morphology, blue straggler stars, binary interactions and enhancement) and give quantitative analysis of the influences of these factors on age determinations (except for enhancement). For colour and spectrum-fitting methods, the age can be underestimated about Gyr, Gyr, and Gyr due to influences of horizontal branch, blue straggler and binary stars, respectively. And for Lick-index method, the lower limit of maximal change of age is 6.0 Gyr, 5.0 Gyr and 3.0 Gyr due to influences of horizontal branch, blue straggler and binary stars, respectively.
keywords:
Galaxy: globular cluster: general – galaxies: fundamental parameters – galaxy: stellar content.1 Introduction
Understanding the formation and evolution of galaxies is one of the important questions of cosmology. With the increased telescope size and improved instruments, we can obtain multiband photometric and high-resolution spectroscopic data of extragalactic sources. People can take advantage of these data to study the properties of galaxies to a maximum extent.
Many techniques have been emerged to study the properties of galaxies, and evolutionary population synthesis (EPS) is one of these techniques which has been developed rapidly since it was first introduced by Tinsley (1968). By EPS method, we can compare the observational data of clusters and galaxies with EPS models to investigate their properties. So far many EPS models (e.g. Vazdekis 1999; Schulz et al. 2002; Bruzual & Charlot 2003, hereafter BC03; Le Borgne et al. 2004; Zhang et al. 2005a,b; Maraston 2005; Zhang & Li 2006) emerged and were applied widely in the study of galaxy properties. Based on these EPS models, people adopted different methods to study the properties of stellar population (SP) systems, e.g. using colours to estimate age and metallicity (Dorman, Connell & Rood 2003; James et al. 2006); choosing suitable Lick/IDS absorbtion-line indices to break the age-metallicity degeneracy (Worthey 1994; Worthey & Ottaviani 1997; Trager et al. 1998); using full spectrum-fitting to match SP system spectra with model spectra (Koleva et al. 2008, hereafter K08) and so on.
Now it becomes the most important to test them and estimate the reliability for these methods, especially for the fact that a lot of extragalactic studies are heavily dependent on these methods. Galaxies are not the ideal test medium for these methods because of their complex mixture of SPs. On the contrary, Galactic globular clusters (GCs) are suitable test beds for this purpose. Presumably formed in a single burst, GCs can be characterized by a single age () and a single metallicity (Z), they are considered as the simple stellar populations (SSPs). The age and metallicity can represent the overall SP component of a GC. Furthermore, the ages and metallicities of them can be known from spatially resolved observations (such as colour-magnitude diagrams, hereafter CMD and spectroscopy of individual stars), which provide us a benchmark for this test. Therefore we use the Galactic GCs to study the reliability of these three methods.
Similar to this work, GCs are also used in other tests, such as testing different models and methods based on GCs (Mendel, Proctor & Forbes 2007; Riffel et al.2011; K08).
-
•
Mendel et al. (2007) have used Galactic GCs to test three EPS model predictions of age, metallicity and -element abundances. Riffel et al. (2011) have employed the near-infrared integrated spectra of 12 Galactic GCs to test near-infrared EPS models.
-
•
Meanwhile, K08 has used Galactic GCs to investigate the consistency and reliability of using full spectrum-fitting on the determination of SSP equivalent age and metallicity.
Beyond the work of K08, we use Galactic GCs and BC03 models to investigate the reliability of three (colour, Lick-index and spectrum-fitting) methods on the estimations of age and metallicity. Through comparing these results with those obtained by other techniques (such as CMDs, spectra of stars), it can provide a valuable examination of these derivative methods of EPS models, and give a guidance to users of these methods.
The outline of this paper is as follows. We give the Galactic GC sample data, population synthesis models and stellar spectral library in Section 2. We analyze the methods used in this work in Section 3. In Section 4, we present the results and discussions of this work. The influences of horizontal branch (HB) morphology, blue straggler stars (BSs), binary interactions and enhancement on the age determinations are given in Section 5. The summary is presented in Section 6.
2 The Galactic GC sample data, population synthesis models and stellar spectral library
At first, we describe the Galactic GC sample data and the EPS models in this Section. In order to discuss the influences of HB morphology, BSs and binary stars on the derived ages, we introduce the high spatial resolution photometric data and stellar spectral library.
2.1 The sample data
In this work, we choose 40 Galactic GCs (which have both photometric and spectroscopic data) as our sample and use the observed data from different studies. The spectroscopic data of Galactic GCs are taken from the spectral library of Schiavon et al. (2005, hereafter S05). These spectra are obtained from the Cerro Tololo Inter-American Observatory Blanco 4-m telescope with the Ritchey-Chretien spectrograph. And these spectra cover the wavelength 33506430 Å with a resolution of about 3.1 Å.
The photometric data of our Galactic GC sample are taken from the 2010 version of the Harris′ catalogue (Harris 1996; http://physwww.physics.mcmaster.ca/harris/mwgc.dat). The selected targets span a wide range of cluster parameters, including metallicity, HB morphology, Galactic coordinates and Galactocentric distance. And the main characters of them are listed in Table A1, which are taken from Harris′ catalogue.
It is well known that the ages of GCs can be obtained with much higher accuracy by CMDs (De Angeli et al., 2005), and the metallicities can be obtained by the high resolution spectra of stars (Carretta et al., 2009). In order to give a comparison, we take the ages of 30 GCs from Salaris & Weiss (2002), De Angeli et al. (2005) and Marín-Feanch et al. (2009), which determine ages of GCs from the CMDs, and the ages are mainly taken from Salaris & Weiss (2002). The metallicities of all these 40 GCs are taken from Zinn & West (1984), Carretta & Gratton (1997), Kraft & Ivans (2003) and Carretta et al. (2009), which determine metallicities of GCs from spectra of stars, and the metallicities are mainly taken from Zinn & West (1984).
2.2 The stellar population synthesis models
To test these three methods on the parameter determinations, we adopt the standard BC03 models. The standard BC03 population synthesis models utilize the Padova 1994 evolutionary tracks, the STELIB library (Le Borgne et al. 2003) and the Chabrier (2003) initial mass function (IMF) with stellar mass limits of 0.1 and 100 M⊙. This set of models presents the intermediate-resolution spectra ( 3 Å), some spectral feature indices and colours (based on various systems, including Johnson-Cousins and AB systems). The SSP models given by BC03 span a wide range of age (0.1 Myr 20.0 Gyr) and metallicity Z (0.00010.05), but these models provide six metallicities: [Fe/H] = 2.3, 1.7, 0.7, 0.4, 0.0, and 0.4 (here we adopt Z⊙ = 0.02).
In order to discuss the influence of binary stars on age determinations in Section 5.3, we also adopt the other two EPS models, one is the models of SSPs (Zhang et al. 2004) and the other is the models of binary stellar populations (BSPs, Zhang et al. 2005a). These models were built on the basis of the stellar evolution tracks (Eggleton, 1971, 1972, 1973), -2.0 stellar atmosphere models (Lejeune, Cuisinier & Buser 1997, 1998) and various initial distributions of stars. The main input parameters of the BSP models are as follows: (i) the initial mass of the primary is chosen from the approximation to the IMF of Miller & Scalo (1979) as given by Eggleton et al. (1989); (ii) the initial secondary-mass distribution, which is assumed to be correlated with the initial primary-mass distribution, satisfies a uniform value, i.e., ()=1; (iii) the distribution of orbital separations is taken as constant log for wide binaries and falls off smoothly at close separations; (iv) the eccentricity distribution satisfies a uniform form: . Other assumptions and more details see Zhang et al. (2004) for SSP models and Zhang et al. (2005a) for BSP models. For those previous models, Zhang et al. adopt the 2.2-version of library of Lejeune et al. (1997, 1998), which is a low-resolution library. However, the spectra of S05 library are intermediate resolution and we calculate the Lick indices by degrading to the resolution of Lick system (see Section 4.1), we do some modification for these two models, instead of using library we choose the high-resolution ( 0.1 Å, see Section 2.3) BLUERED library of Bertone et al. (2008) in this work. And other input physics remain unchanged.
2.3 Other photomethic data and stellar spectral library
For the purpose of investigating the influences of HB morphology and BSs on age determination, in the first step we should select the HB stars and BSs from CMDs of GCs. CMDs taken from Piotto et al. (2002, hereafter P02) are used to obtain HB stars and BSs for GCs. These data are high spatial resolution photometric data and observed with the Wide-Field Planetary Camera 2 on board of Hubble Space Telescope (HST/WFPC2) camera in the F439W and F555W bands. The HST snapshot catalogue contains photometric tables for 74 GCs and the and magnitudes are also obtained from the HST photometry through the transformations given by P02. There are 26 clusters in common between the spectral library of S05 and P02 photometric catalogue.
In the second step we should give the corresponding colours and spectra for each HB star and BS. In order to do this, we adopt two stellar spectral libraries. One is the 2.2-version of library of Lejeune et al. (1997, 1998), which is a low-resolution library. This library provides extensive and homogeneous grids of low-resolution theoretical flux distributions in the range of 911600 000 Å and synthetic UBVRIJHKLM colours for a large range of stellar parameters: 50 000 Teff/K 2000, 5.50 logg 1.02 and 1.0 [Fe/H] 5.0. By this library we can obtain the colours for HB stars and BSs. In order to obtain high-resolution spectra for them we adopt the other library, it is BLUERED library of Bertone et al. (2008), which is a high-resolution (R 500 000) library. This library contains 832 theoretical stellar spectra covering the optical range of 35007500 (see Bertone et al. 2008 for more details). It spans a large range of Teff (400050,000 K) and logg (0.05.0) at six metallicity values ([Fe/H] and ).
3 methods
Having described the sample data and EPS models, we now begin to introduce the three methods used in this paper, including colour, Lick-index and spectrum-fitting methods.
3.1 Colour method
As shown by Yi et al. (2004), the and colours can be well used to derive the ages and metallicities for GCs. Anders et al. (2004) also analyzed the reliability and limitation of the combination of various passbands and they found that the and bands are important for the age and metallicity determinations, and the V band and near-infrared data can provide additional constraints. They listed the preferable passband combinations in their Tables 1 and 2, and the UBVI are the preferable combinations for the SP systems with age larger than a few Gyr from their Table 2. So we select three colours (, and ) from Harris’ catalogue to fit with models to obtain the ages and metallicities of GCs. But for the other SP systems, the selection of colours may be different, such as Maraston et al. (2001) have found that the ages of young star clusters can be well determined based on and colours, and wider photometric data can be used well to constrain the parameters for distant SP systems (Barro et al., 2011). In this procedure, we set the ages and metallicities of SPs free and select the best-fitting model by minimizing the following the formula:
| (1) |
where the CM,i,n is the n-th colour corresponding to the i-th SSP model. The CO,n and O,n are the n-th colour and error of the Galactic GCs. Ndof is the degree of freedom. Error O,n is not given in the Harris′ catalogue, so we assume that the error of , and is 0.04 mag.
Errors on the age and metallicity estimation are determined from the contours. Because we use three colours in this work, the Ndof is 2. And for Ndof 2, the 1, 2 and 3 errors correspond to the formal confidence intervals of 68.7% ( = 2.3), 95.4% ( = 6.17) and 99.73% ( = 11.8; Avni 1976), respectively.
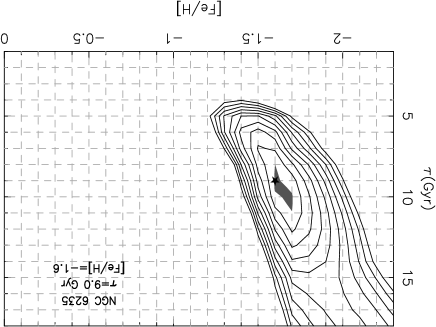
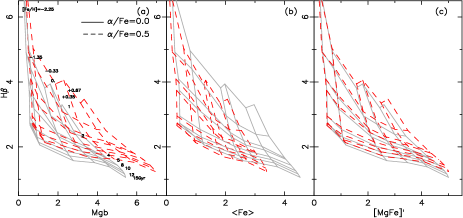
Fig. 1 shows an example of the method of using contour map of to obtain age and metallicity for NGC 6235. The star stands for the and corresponds to the obtaining and [Fe/H]. The shaded area maps 1 confidence region, and the and [Fe/H] are obtained based on this shaded area.
3.2 Lick-index method
Lick/IDS indices have been used to break the age-metallicity degeneracy (Trager et al. 2000; Terlevich & Forbes 2002; Gallazzi et al. 2005) of SP systems. In this paper, we select the Balmer (H, H, H, H and H), Mg b, Fe5270 and Fe5335 indices to study the parameters of GCs (Balmer indices are age-sensitive indices, Mg b, Fe5270 and Fe5335 are metal-sensitive indices). The H and H are high order Balmer indices which measured with a narrower ( 20 ; marked by subscript F) and a wider ( 40 ; marked by subscript A) central bandpass (Worthey & Ottaviani, 1997). Among these five Balmer indices, H and H are little sensitive to Fe and the other three indices are sensitive to Fe. And in Section 5.4, we will discuss the influence of -enhancement on age determination for Lick-index method. For the three metal-sensitive indices, we adopt the following definition: [MgFe] = [Mg b(0.72 Fe5270 + 0.28 Fe5335)]1/2, which defined by Thomas, Maraston & Bender (2003). The [MgFe] has been found to be good tracer of metallicity. Adopting the models of Thomas, Maraston & Johansson (2011a) we present this character in Fig. 2, the grids of H versus Mg , Fe (Fe1/2(Fe5237Fe5335)) and [MgFe] with two types of /Fe ([/Fe] and ), the gray solid and red dashed lines stand for [/Fe] and , respectively. From them we can see that the influence of /Fe ratio is obvious for H versus Mg and Fe grids, and is small for H versus [MgFe] grid. The Mg increases and Fe decreases with increasing /Fe, and the combination index [MgFe]′ counteract the effect of /Fe ratio on Mg, Fe5237 and Fe5335. This certify that the [MgFe]′ is independent of /Fe and can be considered as good tracer of metallicity (Thomas et al., 2003).
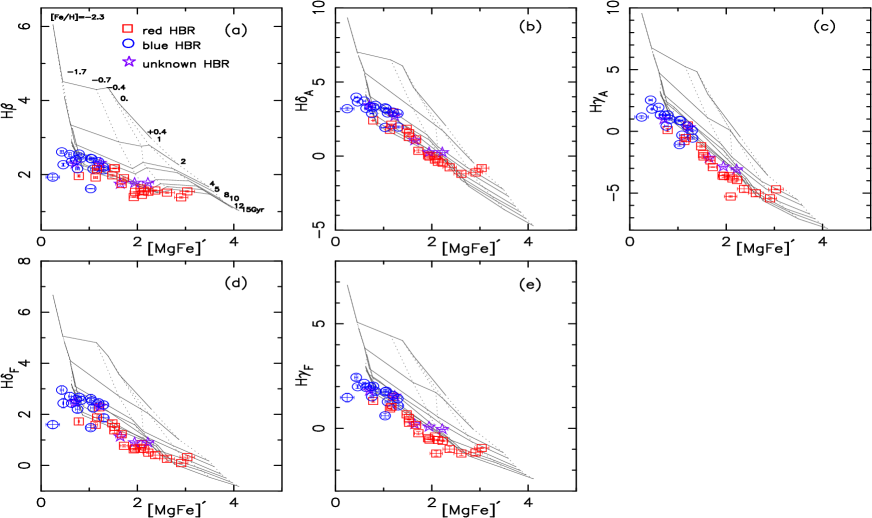
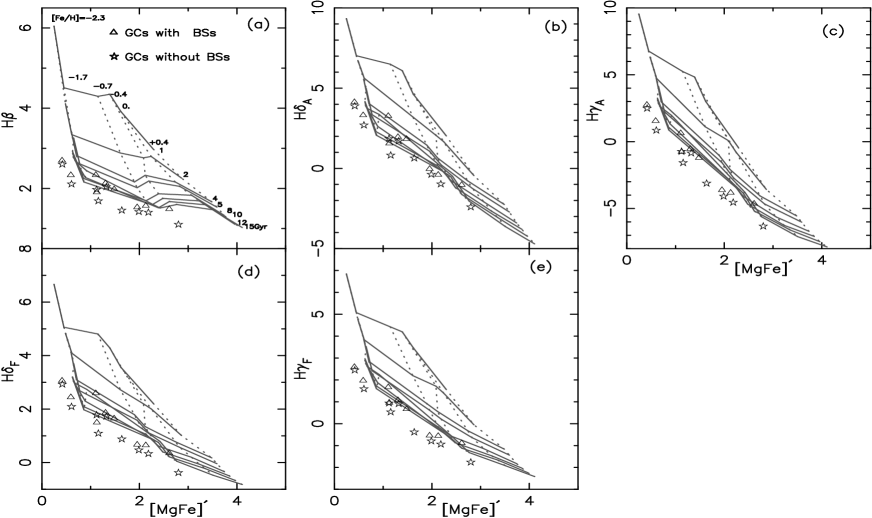
In Fig. 3, we show the distribution of GCs on five Balmer (H, H, H, H and H) indices versus [MgFe] planes. We can see that the majority of GCs lie beyond the grid covered by H (this problem does not involve all Balmer indices, Thomas et al. 2011a), which would be inconsistent with the typical universe age 13.6 Gyr. This is a general problem (see Fig. 2 of Mendel et al. 2007) for all studies of using H index to study the GCs based on existing models. This problem is also clearly demonstrated by the ′zero-point′ offset (some GCs lie beyond the grid of H and most GC ages are greater than 14 Gyr). Although these problems have been pointed by some groups (Vazdekis et al. 2001; Schiavon et al. 2002; Cenarro et al. 2008), but few works have been done on studying the specific sources of this problem or quantified their effects on the derived ages and metallicities. Similar to the technique described in Puzia et al. (2005), the ages and metallicities for individual GCs are computed as the weighted mean of the parameters derived from five Balmer indices versus [MgFe] grids.
Due to the influence of hot blue HB stars, the isochrones for old ( 8.0 Gyr) stellar populations with metallicity below [Fe/H] tend to overlap (Maraston & Thomas 2000; Mendel et al. 2007), this nature is reflected by H in panel (a) of Fig. 3. This brings an ambiguity in determining ages and metallicities of GCs and unnaturally extends the age distributions for old ages for Lick-index method. Note that, for the GCs lying beyond the Lick indices grids, we assume the values of GCs are 15.0 Gyr.
3.3 spectrum-fitting method
With the increase of spectroscopic data, people use spectra to study the properties of SP systems. So far there are many kinds of full spectrum-fitting techniques used in such study (e.g. Cid Fernandes et al. 2005; Mathis, Charlot & Brinchmann 2006; Tojeiro et al. 2007; K08).
We employ a modified version of the STARLIGHT code by Cid Fernandes et al. (2005) to analyze the observed spectra of Galactic GCs. The STARLIGHT code is originally used to study the properties of galaxy, and is achieved by fitting the observed spectrum FO with a model spectrum FM that mixed by N⋆ SSPs with different ages and metallicities from the BC03 models. The code is carried out with a simulated annealing plus Metropolis scheme (Cid Fernandes et al. 2001), which searches for the minimum
| (2) |
where is the error in FO. The line-of-sight stellar motions are modeled by a Gaussian distribution centered at velocity v⋆ and with dispersion ⋆. The output includes the distributions of stellar age, metallicity, extinction, velocity dispersion and stellar mass.
4 Results and Discussions
We use colour, Lick-index and spectrum-fitting methods based on BC03 model to obtain the ages and metallicities for Galactic GCs, and compare them with those determined from spatially resolved observations (such as CMDs, spectra of stars). We also compare the ages and metallicities derived from other two models (Vazdekis and Maraston models) to test whether our results are dependent on EPS models. Before displaying the results of this work, we should introduce some pretreatments of model, sample data and methods. The details are given as follows.
4.1 Pretreatments
-
•
For the EPS model, as said above, the BC03 model provides six metallicities, we linearly interpolate colours, Lick indices and spectra of SSPs that span [Fe/H] from 2.3 to 0.4 in increments of 0.1 dex.
-
•
In order to discuss the influence of HB morphology on age determinations in Section 5.1, we divide the GCs into three groups according to the value of HB ratio (HBR 111 HBR , B is the number of blue HB stars, R is the number of red HB stars and V is the number of RR Lyrae variable.) from the Harris′ catalogue. One is the blue HBR type (HBR 0), the second is red HBR type ( HBR 0) and the third is unknown HBR (HBR is not given).
-
•
For the colour method, we do extinction corrections for observed magnitudes of GCs by adopting the extinction curves of Schlegel et al. (1998) and the of Harris′ catalogue (the 8th column of Table A1).
-
•
For the Lick-index method, in this work we calculate the Lick indices from the spectra of Galactic GCs by degrading to wave-dependent resolution of the Lick system (see Section 4.4 of BC03), without adopting the results by using fitting functions.
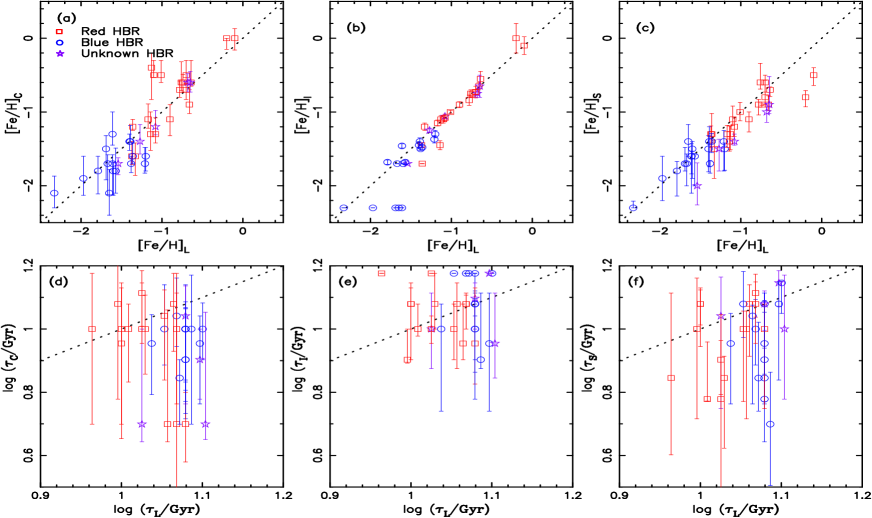
Figure 4: Top panels: the comparisons between the metallicities obtained by three methods and the spectra of stars for Galactic GCs. Symbols have the same meanings in Fig.3. Bottom panels are the comparisons between the ages obtained by three methods and the CMDs. Left, middle and right panels are comparison results for methods of colour, Lick-index and spectrum-fitting, respectively. -
•
For the spectrum-fitting method, we adopt a modified version of the STARLIGHT code. Because it is generally accepted that the GC can be represented by a SSP, only one component in the base. We fit the observed GC spectrum FO with each of the SSP spectrum Fi, do not fit the observed spectrum with a linear combination of N⋆ SSPs. In this study, following Cid Fernandes et al. (2005), we find the best fitting SSP, which matches a given observed spectrum of GC, through a standard minimization procedure:
(3) instead of equation (2), where Fi corresponds to the spectrum of i-th SSP model. And in this work we construct a base of ages metallicities SSP model spectra. The use of STARLIGHT to study the integrated spectra of clusters has also been extensively discussed by Cid Fernandes & Gonzlez Delgado (2010).
In the spectrum-fitting process, we use the spectra in the 37005700 range because the red and blue parts of the observations have poor quality. Errors on the age and metallicity estimation are also determined by the contours.
4.2 Comparison of parameters with other studies
Using the methods and pretreatments outlined in Sections 3 and 4.1, we obtain ages, metallicities and corresponding errors for GCs. In order to distinguish the ages and metallicities derived from different methods, we define some parameters in this paper. and [Fe/H]C stand for the age and metallicity determined from colour method, and [Fe/H]I represent those obtained from Lick-index method, and and [Fe/H]S stand for those determined from spectrum-fitting method. The parameters of literatures are represented by and [Fe/H]L. In Table A2 we list the GC IDs in the first column. In the 2nd to 7th columns, , [Fe/H]C, , [Fe/H]I, and [Fe/H]S are given with errors, respectively. And in 8th and 9th columns we list the and [Fe/H]L.
In the top panels of Fig. 4, we give the comparison between our GC metallicities and those given in the literatures that obtain metallicities from the spectra of stars. And
(a), (b) and (c) panels are the comparison results for colour, Lick-index and spectrum-fitting methods, respectively. The vertical bars are the errors in metallicities derived from three methods. From them
we see that the metallicities obtained by three methods are in agreement with literature value for the whole sample. Meanwhile we also find that all GCs with blue HBR have lower metallicity than those with red HBR for these three methods, which agrees
with the study of Lee, Yoon & Lee (2000). Our specific analysis are given as follows.
(a) For colour method, [Fe/H]C agrees with [Fe/H]L for the whole sample, but there exists discreteness. We can see that [Fe/H]C is a bit smaller than [Fe/H]L in the range of [Fe/H]L1.0 and [Fe/H]C agrees with [Fe/H]L for the range of [Fe/H]L1.0. But for the value of [Fe/H]L is about 1.1, there exist three GCs (NGC 6171, 6342 and 6652) having lager [Fe/H]C than [Fe/H]L. From the [Fe/H]C and of these GCs listed in Table A2, we see that is smaller than , so these GCs can be affected by age-metallicity degeneracy.
(b) For the Lick-index method, the [Fe/H]I is perfectly in agreement with [Fe/H]L in the range of [Fe/H] . But there have difficulties in metallicity determination for the range of [Fe/H] , because it tends to overlap for Balmer and [MgFe] indices at low-metallicity range for BC03 model. And we can see this phenomenon clearly in the panel (a) of Fig. 3. This indicates that Lick-index method is suitable to study metallicity for SP systems in the range of [Fe/H] and has some difficulties in studying SP systems for the range of [Fe/H] .
(c) For the spectrum-fitting method, we find that [Fe/H]S matches [Fe/H]L in the range of [Fe/H] , and [Fe/H]S is smaller than [Fe/H]L for the range of [Fe/H] . All these results imply that the spectrum-fitting method may be suitable to study metallicity for SP systems in the range of [Fe/H] and [Fe/H]S may be smaller than [Fe/H]L for the range of [Fe/H] .
On the whole, our metallicities obtained from three methods match those determined from spectra of stars in the entire metallicity range spanned by the GCs. The Lick-index method is suitable to study the metallicity in the range of [Fe/H] and spectrum-fitting method is suitable to study the metallicity in the range of [Fe/H] .
In the bottom panels of Fig. 4, we compare our derived GC ages of three methods with the values of literature that determine ages from CMDs. And (d), (e) and (f) panels are corresponding to colour, Lick-index and spectrum-fitting methods, respectively. From them we can see there exists large discrepancy in age determinations, and the errors are also large for these three methods. Our specific analysis are given as follows.
(d) For the colour method, most of the GCs with blue and unknown HBR have relative lower than , but there has no obvious tendency for those with red HBR. The age of GCs with blue HBR can be influenced by HB stars for the existence of HB stars making GCs look younger. Five GCs are found to possess extreme low , including two with unknown HBR (NGC 6388 and 6441) and three with red HBR (NGC 6171, 6342, and 6652). Among these GCs, three have relative lager [Fe/H]C than [Fe/H]L, which can be affected by the age-metallicity degeneracy (see Fig. 4a). Meanwhile from the 4th and 5th columns of Table A1, we know that the other two GCs are close to the Galactic bulge, which are badly contaminated by the field stars or affected by differential reddening, so we can not get reliable parameters for them.
(e) For the Lick-index method, we can see there exist some GCs with extreme large (about 15.0 Gyr), and except these GCs most of GCs have smaller which are influenced by HB stars, especially for those with blue HBR. About eight GCs have large of 15.0 Gyr which lie beyond the grids, including two with red HBR (NGC 1851 and 6637), one with unknown HBR (NGC 5946) and five with blue HBR (NGC 1904, 2298, 3201, 6254 and 7078). Similar to above, Lick-index method has some difficulties in parameter determinations for the range of [Fe/H] , and most of these eight GCs are metal-poor ([Fe/H]I1.5), so we obtain extreme large for them.
(f) For the spectrum-fitting method, most GCs with blue HBR have relative smaller than , but there has no obvious tendency for those with red and unknown HBR. From panel (c), we know that [Fe/H]S is consistent with [Fe/H]L in the range of [Fe/H] and most of GCs with blue HBR are metal-poor, so the of GCs with blue HBR are affected by HB stars rather than age-metallicity degeneracy. For the GCs with red and unknown HBR, one part has large which can be influenced by age-metallicity degeneracy, and the other part has small which may be influenced by HB stars and BSs.
| Models | BC03 | Vazdekis | Maraston |
|---|---|---|---|
| Stellar evolution track | Padova 1994 | Padova 2000 | Cassisi+Geneva |
| Stellar spectral library | STELIB | MILES | MILES |
| IMF | Chabrier | Salpeter | Chabrier |
| (number) | |||
| Age(Gyr) |
Note that, relevant to this test is that CMD-derived ages also can carry their own problems for this test, because the CMD-derived ages depend on the adopted tracks and on whether element ratios be taken into account, which has also been discussed in Maraston & Strömbäck (2011).
On the whole, all of these three methods have difficulties in age determination and we can not directly say which method is better on age determination. Except the influences of CMD-derived ages and age-metallicity degeneracy in the entire age range, there exist some uncertainties in age determinations, some factors (e.g. HB stars, BSs, binary stars and -enhancement) can affect the age determinations and we will discuss them in the next Section.

4.3 Consistency checks
We use Vazdekis222http://miles.iac.es/ (the updated v9.1 version, Vazdekis et al., 2010; Falcn-Barroso et al., 2011) and Maraston (Maraston & Strömbäck, 2011) models to investigate whether our results are dependent on EPS models. The Vazdekis models use the Padova 2000 theoretical isochrones (Girardi et al., 2000), the MILES library (Sánchez-Blázquez et al., 2006) and four types of IMF with stellar mass limits (Vazdekis et al. 2003) of 0.1 and 100 M⊙. This version covers the wavelength range of 35407410 with a spectral resolution (FWHM) of 2.5 (Falcn-Barroso et al., 2011), seven metallicities and 50 ages across the range of 0.063017.1800 Gyr. In this work, we select the unimodal Salpeter IMF (Salpeter, 1955) to study the parameters of GCs for spectrum-fitting and Lick-index methods. For the colour method, because the MILES library has relatively limited wavelength coverage and does not extend into I-band, we select the colours from previous models of Vazdekis (Vazdekis, 1999) to study the parameters of GCs. This does not influence our results (private discussion).
The Maraston models assume a stellar evolution prescription, which consists of the isochrones and stellar tracks by Cassisi, Castellani & Castellani (1997) for ages larger than 30.0Myr and by Ganeva (Schaller et al., 1992) for younger populations. Sets of models have been also computed with Padova stellar evolutionary models (Girardi et al., 2000). Four different libraries of flux-calibrated empirical stellar spectra and three types of IMF have been considered. We select the MILES library and the Chabrier (2003) IMF to study the parameters of GCs. These updated models cover the wavelength range of 35007430 with a spectral resolution (FWHM) of 2.54 (Beifiori et al., 2011) and five metallicities with different ages across the range of 0.006015.0000 Gyr (Maraston & Strömbäck 2011, and references therein). Just as said above, we use the updated models of Maraston & Strömbäck (2011) based on MILES library for spectrum-fitting and Lick-index methods. And for the colour method we select the models of Maraston (2005), which based on the library, to study the parameters of GCs. In Table 1 we list the comparison of main model ingredients in each EPS model. The first, second and third rows list the stellar evolution track, stellar spectral library and IMF of the EPS models that we used in this study. The 4th and 5th rows show the metallicity () and age range that these models cover, and the number of metallicities is also given in the parenthesis of the 4th row.
We use these two EPS models to obtain the parameters of GCs based on three methods described above and compare the results of these two models with that of the literatures. In Fig. 5, we show the comparisons between the parameters of GCs obtained from tree methods based on three EPS models (BC03, Vazdekis and Maraston) and the literatures, in which the open squares, pentacles and circles stand for the results of BC03, Vazdekis and Maraston EPS models, respectively. The dispersion (rms) is also listed in the lower right corner of each panel, rmsbc03, rmsvazd and rmsmara stand for the rms of BC03, Vazdekis and Maraston EPS models, respectively. We find that the metallicities obtained from three methods of these two EPS models (Vazdekis and Maraston) have an agreement with those of the literatures in the entire metallicity range. From the top panels (a, b and c panels), we find that the comparisons between metallicities obtained by three methods and the spectra of stars for these two models are similar to that of BC03 models. For Lick-index method in panel (b), we see that the rmsvazd and rmsmara are smaller than rmsbc03, this may be due to the adoption of MILES for these two models and STELIB for BC03 models (Maraston & Strömbäck, 2011). For the spectrum-fitting method in panel (c), the [Fe/H]S of Vazdekis model is larger than that of the other two models, so the rmsvazd is smaller than rmsbc03 and rmsmara. From these rms, we can know that the dispersion of colour method is larger than that of other two methods. All these can not influence our conclusions, Lick-index method is suitable to study metallicity in the range of [Fe/H] and spectrum-fitting method is suitable to study metallicity in the range of [Fe/H] . From bottom panels, we can see that all these three methods have difficulties in age determinations for these two EPS models and the rms is larger than that of metallicity. There also exist some GCs with extreme large (about 15.0 Gyr) for these two models, and most of GCs have relative smaller , and than , which is similar to that of BC03 models. The comparisons of derived metallicities and ages of individual GCs show that these three models make different parameter predictions. However, the whole tendency for these three methods of these three EPS models is nearly the same. This indicates that our conclusions are independent of the EPS models.
5 Uncertainties in age
From the above analyses, we know that our metallicities are consistent with the values of literatures within the error bars, but there exist some discrepancies in age determinations. It is well known that the HB stars, BSs, binary stars and enhancement exist in GCs, however they are not considered in most of the EPS models and they are important for models. All these can affect the parameter determinations for GCs. So in this Section, we analyze the effects of some factors (HB morphology, BSs, binary star and enhancement) on age determinations.
5.1 Horizontal Branch morphology
It is widely known that HB morphology can affect the age determination (de Freitas Pacheco & Barbuy 1995; Lee et al. 2000; Maraston & Thomas 2000). The HB stars (especially the blue HB stars) can be hot and their existence can mimic young or intermediate age populations in old SP systems. Hot extended HB stars have been observed in GCs with HST by Piotto et al. (1999).
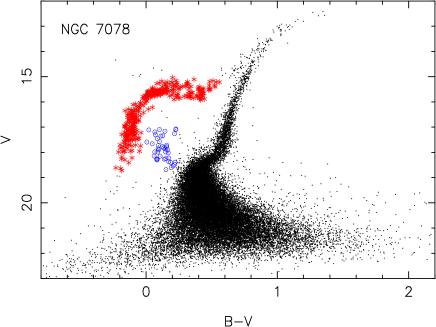
The main goal of this part is to analyze the contributions of observed HB stars to the age determinations for three methods. At first, we should select HB stars from the CMD and then give corresponding colours, spectra and Lick indices for HB stars. We use the distribution of stars in the CMD of P02 and select 18 GCs (include five with blue HBR, four with unknown HBR and nine with red HBR), which have in common with our sample and show obvious HB stars, to study the influence of HB stars on age determinations. We select HB stars according to the method described in Gratton et al. (2010), and take NGC 7078 as an example to show the selection of HB stars in Fig. 6 (red asterisks are HB stars).
The total observed quantity () of a
GC includes two components: the total HB stars
component (XHB) and the component (X(tot-HB))
of other stars in the GC. After selecting of HB stars and analyzing and X(tot-HB),
we can study the influence of HB stars on age determinations.
The observed spectra and colours of these two components (XHB and X(tot-HB)) can be constructed by follows.
(i) The integrated colours of these two components, taking and as examples, can be expressed as
| (4) |
| (5) |
where NHB is the number of HB stars,
bi,HB and vi,HB are the magnitudes for the -th HB star which given by P02, and and are the magnitudes for each GC which obtained from Harris′ catalogue.
(ii) The spectra of FHB and F(tot-HB) can be obtained by following
| (6) |
| (7) |
where tot is the spectrum taken from S05, and is the spectrum of i-th HB star which is obtained from the BLUERED library. In this procedure, we transform the surface flux () from BLUERED library into observed flux () for each HB star by adopting the distance of GCs from the sun by Harris catalogue.
For the colours and spectra of HB stars, we can derive them from the stellar spectral library based on HB stars [Fe/H], Teff and logg. Because the GC is taken as a SSP, the same metallicity (i.e. [Fe/H]L in Table A2) of GC is adopted for HB stars for a certain GC. The parameters of Teff and logg are obtained as follows.
(i) The Teff can be obtained from the theoretical library by the magnitudes of P02 and metallicities of GCs. From the theretical colourTeff calibration of library, we can assign the Teff for each HB star.
(ii) The logg is not easy to obtain, in this work we select a bimodal logg for HB stars, a median value of logg 2.5 for HB stars with Teff8000 K (include all red and part blue HB stars) and logg 4.0 for HB stars with Teff8000 K (consist of blue HB stars). The reasons are given as follows.
(a) Moni Bidin et al. (2007) studied the Teff, logg, helium abundances and masses for HB stars in NGC 6752. And they found that the logg of all HB stars covered the range of 2.5 logg 5.7. Fig. 3 of Maraston et al. (2003) displayed the theoretical isochrones, and the logg range for HB stars was about . Dorman (1992) and Lei et al. (2011, in preparation) have presented a large grid of HB evolution sequences (including the evolution of extreme HB stars), and from their data we find the logg range for red HB star is about and for blue HB star is about .
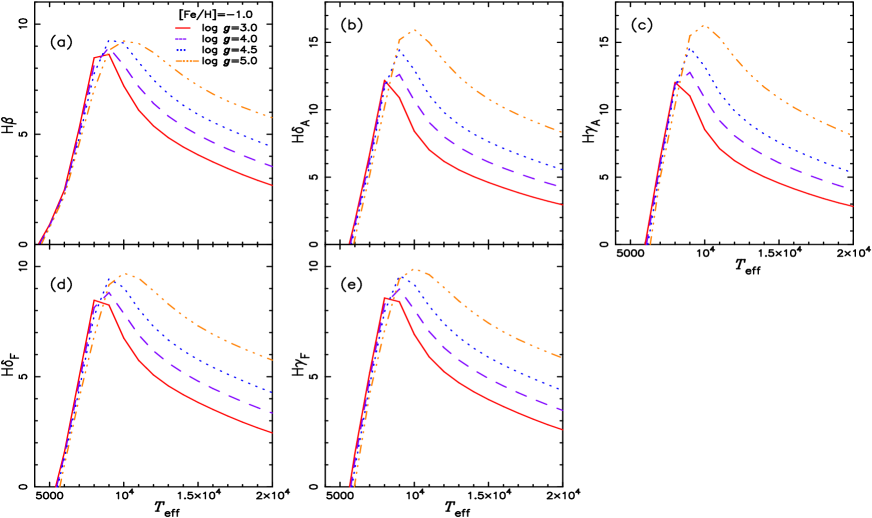
(b) The Balmer indices have a strong dependence on the logg for Teff8000 K, they show decrease with increasing Teff within a fixed metallicity. This is shown in Fig. 7, from it we see that the differences are large for different logg with Teff8000 K. So for the HB stars with Teff8000 K, the adoption of logg has little effect on Balmer indices, but for those with Teff8000 K, the adoption of logg should be reasonable. In addition, from Fig. 1 of Recio-Blabco et al. (2006), we can see that all red and part blue HB stars are with Teff8000 K and part blue HB stars are with Teff8000 K. Combined with logg range of red and blue HB stars, we choose a bimodal log for them and the boundary is Teff8000 K, logg 2.5 (the median value of red HB stars) for those with Teff8000 K and logg 4.0 (the median value of blue HB stars) for those with Teff8000 K.
Based on [Fe/H], Teff and logg determined as described above and the stellar spectral library, we can obtain the FHB and F(tot-HB). Using the methods described in Section 3 we can study the influence of HB stars on age determinations.
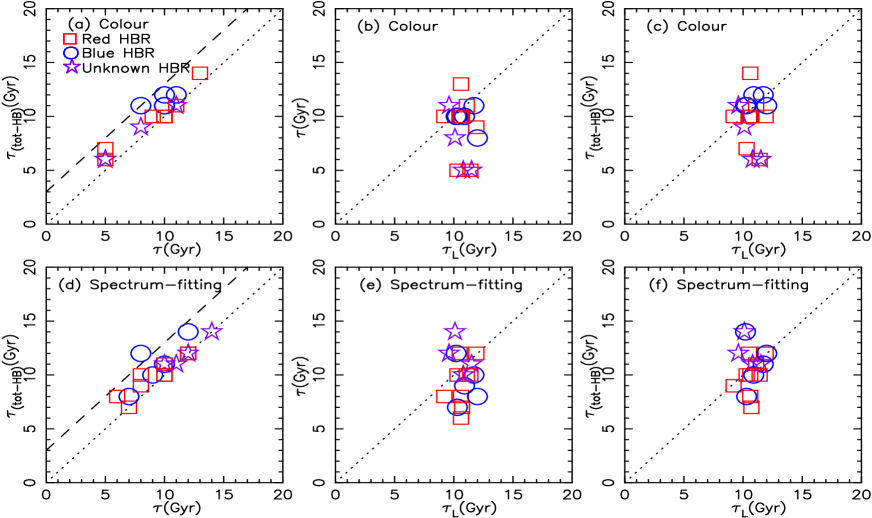
For the colour and spectrum-fitting methods, we show the influences of HB stars on age determinations in Fig. 8. For the sake of simplicity, represents the age of GC with HB stars (correspond to and in Section 4.2) and represents the age of GC without HB stars. We fix [Fe/H]C and [Fe/H]S for GCs when calculating . For colour method, panel (a) shows the comparison between and . And panels (b) and (c) represent the level of comparisons between a case of (, ) and a case of (, ). We give the range for by dashed line in panel (a). We can see all of GCs with blue HBR are with , and part of GCs with red and unknown HBR are with . On the whole, the influence of HB stars on age determination is larger for GCs with blue HBR than those with red and unknown HBR. From panels (b) and (c), we can see that most of GCs are on the side in panel (b), while the GCs are on both side of the dotted line (1:1 relation, ) in panel (c), and the dispersion between and is smaller than that between and . So the consistence between and is better than that between and excepting four GCs with small and . These four GCs are with , and they are the GCs (NGC 6342, 6338, 6441 and 6652) said in Section 4.2. From these two panels we can know that the HB stars can change the age of these four GCs about 1.02.0 Gyr and can not change age largely. Because we fix [Fe/H]C on calculating and two (NGC 6342 and 6652) of these four GCs have relative large [Fe/H]C, these two GCs can be affected by the age-metallicity degeneracy. And the result would be if [Fe/H]C is not fixed. However, for the other two GCs, they have a bit larger [Fe/H]C, excepting affected by age-metallicity degeneracy, they also can be affected by their positions on Galactic plane for they being close to Galactic bulge.
For spectrum-fitting method, just as colour method, panels (d), (e) and (f) show the comparisons between , and . And we give the range for by dashed line in panel (d). We can see all of GCs with blue HBR are with , and part of GCs with red and unknown HBR are with . On the whole, the influence of HB stars on age determination is larger for GCs with blue HBR than those with red and unknown HBR. From panels (e) and (f), we also can see that the dispersion between and is smaller than that between and and the GCs is more close to the dotted line (1:1 relation) in panel (e), so the consistence between and is better than that between and .
In the 10th and 12th columns of Table A2, we give the change of age ( and , ) influenced by HB stars for these two methods. On the whole, the existence of HB stars can make age be small about 0.03.0 Gyr for this two methods.

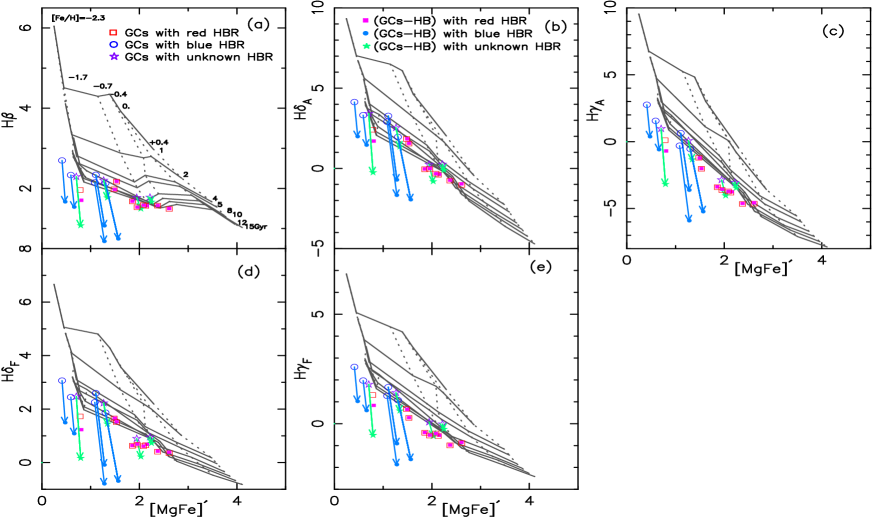
For the Lick-index method, the influence is displayed in Fig. 9, in which the open and solid symbols stand for GCs with and without HB stars, respectively; squares, circles and pentacles display GCs with red, blue and unknown HBR, respectively. The positions of GCs with and without HB stars change a lot for those with blue and unknown HBR and small for those with red HBR. For clarity, we use arrows to indicate the moving directions when HB stars removed for GCs with blue and unknown HBR whose positions change large, and do not use arrows to indicate the moving directions for GCs with red HBR whose positions change small. From these arrows, we can see that the positions for those with blue and unknown HBR are shifted toward older age (15.0 Gyr). All these show that the ages of GCs with blue and unknown HBR can be affected strongly by HB stars, and the ages of those with red HBR are affected slightly by HB stars. In the 11th column of Table A2, we list the change of age ( , ) affected by HB stars for Lick-index method. For the GCs with and without HB stars all lying inside Lick indices grids, we give the numerical change of age. For those with HB stars lying inside grids and lying beyond grids when HB stars removed, we assume Gyr to show the change of age even though this may be just the minimal change of age. For those with and without HB stars all lying beyond grids, we use ′uncom′ instead of numerical value to express the change of age, but this does not mean that the age of GCs changes small. On the whole, the lower limit of maximal change of age is 6.0 Gyr due to the influence of HB stars, and the influence of HB stars is stronger for GCs with blue and unknown HBR than those with red HBR.
5.2 Blue straggler stars
BSs are identified as blue, luminous extensions of main-sequence (MS) stars (Sandage 1953), and they have been widely observed in stellar systems (Johnson et al. 1999; Alcaino et al. 2003; Piotto et al. 2004; Ahumada & Lapasset 2007). Just as the blue HB stars, the existence of BSs can also mimic the presence of younger SPs (Lee et al. 2000; Schiavon et al. 2004; Cenarro et al. 2008). They can enhance the integrated spectrum in ultraviolet and U bands of the GC. This phenomenon would lead to the GC being predicted as young or lower metallicity based on the EPS models without considering the BSs. Cenarro et al. (2008) found that higher BSs ratios can lead to smaller apparent ages. Xin et al. (2008) studied the BSs, influence on the integrated properties of Large Megellanic Cloud star cluster ESO 121 SC03, and found that the best-fitting values of age and metallicity are significantly underestimated compared to the true cluster parameters.
Similar to the procedure of investigating the influence of HB stars on age determinations in Section 5.2, we also calculate the influence of BSs on age determinations. The first step, we select the BSs from the CMDs of P02 through directly visual inspection of the CMD of each cluster (Fig. 6, just as the method describing in Moretti, Angeli Piotto 2008). And in this work we select 9 GCs (in common with our sample) with distinct BSs to study the quantitative influence of BSs. The parameter of Teff for each BSs can be estimated by the empirical relation Teff (Ferraro et al., 2006). Ferraro et al. (2006) also indicated that the gravity of BSs was in the range of 4.3 g 4.8. In our procedure, we choose g = 4.5 for BSs. The same metallicity of GC is adopted for BSs of a certain GC. Based on these parameters we can obtain the colours, Lick indices and spectra of BSs from stellar spectral library. Because the BLUERED library is at high resolution, it does not provide colours. We adopt the colours from library and spectra from BLUERED library.
Using the methods described in Section 3, we can study the influence of BSs on age determinations. Similar to Fig. 8, Fig. 10 shows the influence of BSs on age determinations for colour and spectrum-fitting methods, and represents the age of GC without BSs. For colour method, panles (a), (b) and (c) show the comparisons between , and . We give the range for by dashed line in panel (a). We can see that most GCs are with , and this indicates that the existence of BSs can make GCs look younger. From panels (b) and (c), we can see the GCs lie on both side of the dotted line in panel (c) and lie on one side of the dotted line in panel (b), so the consistence between and is better than that between and .
For spectrum-fitting method, similar to colour method, panels (d), (e) and (f) show the comparisons between , and . And we give the range for by dashed line in panel (d). Just as the colour method, most GCs are with . From panels (e) and (f), we can see that the dispersion between and is smaller than that between and , and the GCs is more close to the dotted line (1:1 relation) in panel (e), so the consistence between and is better than that between and .
In the 13th and 15th columns of Table A2, we give the change of age ( and , ) influenced by BSs for these two methods. The change of age is about 0.02.0 Gyr for the influence of BSs, and this approximates to influence (0.03.0 Gyr) of HB stars on age determinations for these two methods. In theory, the Teff of HB stars is higher than BSs, and the existence of HB stars can make the spectra and colours bluer than that of BSs. But these two type stars have great contribution in blue and ultraviolet bands. In this work, we select colours and the spectra in the 37005700 range, so the difference of influences by these two type stars is small in such range of colours and spectra, and the change of age affected by these two type stars is nearly the same. The difference of influences on age by these two type stars may be obvious for Lick-index method.
Fig. 11 displays the effect of BSs on age determination for Lick-index method. Open triangles and pentacles stand for GCs with and without BSs, respectively. From these different symbols, we can see that the Balmer indices of GCs with BSs are stronger than those without BSs, and those without BSs go down on the Lick indices planes. Similar to HB stars, the change of age ( , ) affected by BSs for Lick-index method is listed in the 14th column of Table A2. On the whole, the lower limit of maximal change of age is 5.0 Gyr due to the existence of BSs, and this approximates to the lower limit of maximal change of age affected by HB stars (6.0 Gyr). We can not say that the influences of this two type stars are similar, because we do not give the numerical value of age change for those lying beyond grids. From Figs. 9 and 11, we can see that HB stars can make H stronger about 1.5, but BSs can make H stronger about 0.5, this demonstrate that the influence on age determination for HB stars is larger than that of BSs. And the difference of influence on age by these two type stars is obvious for this method.

5.3 Binary stars
Binary stars are very common in star clusters and galaxies. The evolution of binary stars is very different from single stars, and binary interactions can also create some important objects and phenomenons, such as BSs (e.g. Pols & Marinus 1994; Tian et al. 2006), subdwarf B stars (Han et al. 2002, 2003), and the Gravitational wave radiation sources (Liu 2009). Therefore, binary stars have the potential to play an important role in determining the overall appearance of any realistic SP. Zhang et al. (2004, 2005a) have investigated the effects of binary interactions on the integrated colours, spectra and Lick indies. And they found that the inclusion of binary interactions made the integrated and colours and spectra of populations bluer for various metallicities, and made the H greater than that without binary interactions.
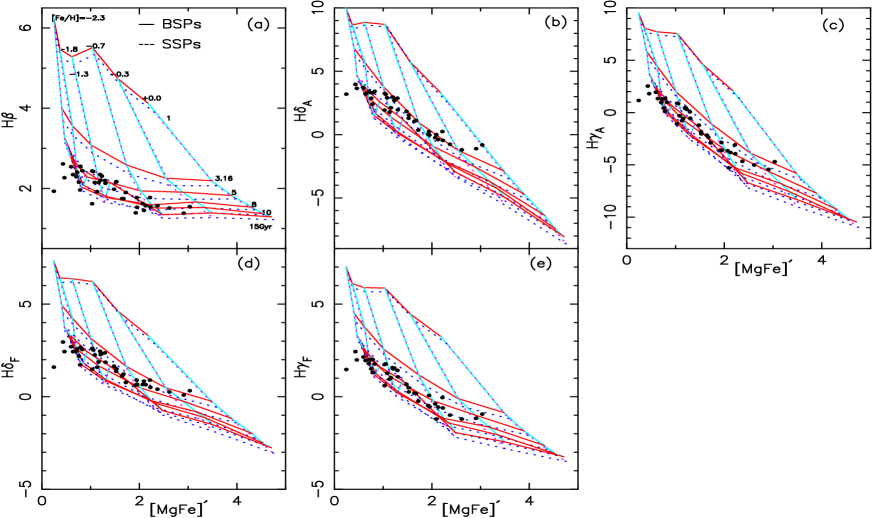
In this work, we investigate the effect of binary stars on the age determinations of GCs based on the models of SSPs (Zhang et al. 2004) and BSPs (Zhang et al. 2005a). For these two models, we adopt the BLUERED library instead of for spectrum-fitting and Lick-index methods, and library for colour method. More description of these two models is given in Section 2.2. In this part we obtain the ages of GCs from three methods based on SSP and BSP models. In Fig. 12 we display the ages determined from SSP and BSP models for colour and spectrum-fitting methods. The ages of GCs obtained from BSP model are lager than those obtained from SSP model. Similar to the HB and BS stars, the existence of binary star can make the GCs look younger (about Gyr) for these two methods. Similar to above, binary stars also have great contributions in blue and ultraviolet bands. So the influence of binary stars is small in the colours and spectra that we used. Fig. 13 gives the results for Lick-index method, in which the solid and dashed lines stand for BSP and SSP models, respectively. From them we can see that the grids for BSP model go up in these five panels, and the five Balmer indices of BSP model are greater by 0.15 than those of SSP model. Using these two models to study the ages for GCs, we can see that the lower limit of maximal change of age is 3.0 Gyr for the existence of binary stars.
5.4 enhancement
The existence of enhancement can make stars on the isochrones hotter throughout all evolutionary phases, and the effect increases with metallicity. Galactic GCs are found to be enhanced (Thomas et al., 2003; Maraston et al., 2003; Lee & Worthey, 2005). Just as the other factors, the existence of enhancement also can mimic young SPs and make Galactic GCs look younger. For the Lick-index method, as said in Section 3.2, the Balmer indices would be affected by enhancement, so the age determined by Lick-index method can be affected by this factor. Maraston & Strömbäck (2011) and Thomas et al. (2011b) have selected some Lick indices and used the fitting technique to derive the parameters for GCs, and they found that the derived ages agreed well with those obtained by CMDs when taking account the enhancement. Thomas et al. (2003, 2011a) have presented the whole set of Lick indices of SSP models with variable /Fe ratio, this allows us to study the influence of enhancement on age determination for Lick-index method.
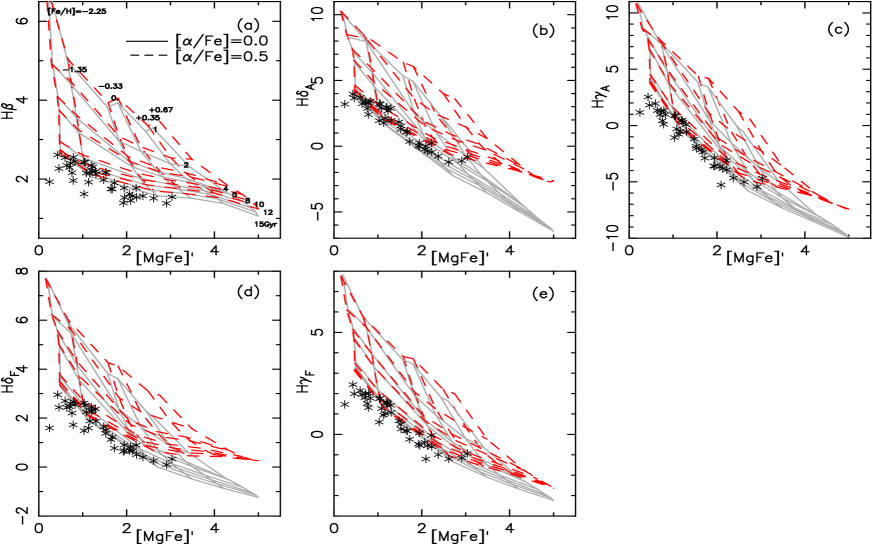
We use the Lick indices of Thomas et al. (2011a) models to study the influence of enhancement on age determination for Lick-index method, and two types of /Fe ratio ([/Fe] and [/Fe]) are chosen. Fig.14 gives the result, from them we can see that enhancement can make the Balmer indices stronger, especial for high metallicity, and has little effect on [MgFe]′ which consists with above said (Section 3.2). Therefore the enhancement can affect the age determination and has little effect on metallicity determination for Lick-index method. We also can see that the influence of enhancement on H and H is small at the range of [Fe/H] . In this work, the ages for GCs are computed as the weighted mean of the ages derived from five Balmer indices versus [MgFe]′ grids and most of the GCs are in the range of [Fe/H] . Therefore, the enhancement has little effect on age determination of GCs for Lick-index method. But for the study of high-metallicity SP systems, the enhancement should be taken into account, because the influences of enhancement on these five Balmer indices are all significant for high-metallicity range.
6 Summary
We have investigated the utility of three methods (colour, Lick-index and full spectrum-fitting) with the same EPS models (BC03 models) for estimating ages and metallicities of Galactic GCs. We also compared our results with those estimated in the literatures from other methods, and the main results of this study are as follows.
(1) Our results show that Galactic GCs are almost old metal-poor SP systems.
(2) Metallicities determined from these three methods are in agreement with those of literatures in the entire range spanned by GCs. The Lick-index method is suitable to obtain metallicity for SP systems in the range of [Fe/H] and spectrum-fitting method is suitable to study metallicity for SP systems in the range of [Fe/H].
(3) There exist some discrepancies between our ages and the literatures, we can not directly say which method is more suitable for age determination. Through comparing with the literatures we find our results are younger than the literatures on average, especially for GCs with blue HBR. Many factors can affect the age determinations and make GCs become younger (such as the HB morphology, BSs, binary stars, enhancement).
(4) We use Vazdekis and Maraston models to investigate whether our results are dependent on EPS models. The comparisons of derived metallicities and ages for individual GCs show that three models make different parameter predictions. However, the whole tendency for these three methods of these three EPS models is nearly the same. All these indicate that our above conclusions are independent of the EPS models.
(5) In this work we use the old Galactic GCs to test these three methods, and our results may hold for old SP system.
(6) We also study the quantitative influences of HB, BSs and binary stars on age determinations for three methods. The existence of all these stars can make the GCs look younger. For the colour and spectrum-fitting methods, the age can be underestimated about 0.03.0 Gyr, 0.02.0 Gyr and 0.03.0 Gyr due to influences of HB, BSs and binary stars, respectively. And for Lick-index method, the lower limit of maximal change of age is 6.0 Gyr, 5.0 Gyr and 3.0 Gyr due to influences of horizontal branch, blue straggler and binary stars, respectively.
(7) For the Lick-index method, we also investigate the influence of enhancement on age determination, and find that the enhancement has little effect on age determination for Galactic GCs.
Acknowledgments
We thank Richard de Grijis for some useful discussions and suggestions. We thank Claudia Maraston for kindly providing the new version of Maraston EPS model. We thank the anonymous referee for very valuable comments that help to improve the manuscript. This work is in part supported by Natural Science Foundation (Grant Nos 10773026, 11033008, 10821061, 2007CB815406 and 11103054) and by the Chinese Academy of Sciences under Grant No. KJCX2-YW-T24. The authors are also supported by the program of the Light in China, Western Region (LCWR) under grant XBBS2011022, the Beyond The Horizons under grant 100020101 and Xinjiang Natural Science Foundation (No.2011211A104).
References
- Ahumada (2007) Ahumada J. A., Lapasset E., 2007, A&A, 463, 789
- Alcaino (2003) Alcaino G., Alvarado F., Borissova J., Kurtev R., 2003, A&A, 400, 917
- Anders (2004) Anders P., Bissantz N., Fritze-v. Alvensleben U., de Grijs R., 2004, MNRAS, 347, 196
- Avni (1976) Avni Y., 1976, ApJ, 210, 642
- Barro et al. (2011) Barro G., Prez-Gonzlez P. G., Gallego J., Ashby M. L. N., Kajisawa M., Miyazaki S., Villar V., Yamada T., Zamorano J., 2011, ApJS, 193, 30
- Beifiori et al. (2011) Beifiori A., Maraston C., Thomas D., Johansson J., 2011, A&A, 531, 109
- Bertone (2008) Bertone E., Buzzoni A., Chavez M., Rodriguez-Merino L. H., 2008, A&A, 485, 823
- Bruzual & Charlot (2003) Bruzual G., Charlot S., 2003, MNRAS, 344, 1000 (BC03)
- Carretta & Gratton (1997) Carretta E., Gratton R., 1997, A&AS, 121, 95
- Carretta et al. (2009) Carretta E., Bragaglia A., Gratton R., D’Orazi V., Lucatello S., 2009, A&A, 508, 695
- Cassisi et al. (1997) Cassisi S., Castellani M., Castellani V., 1997, A&A, 317, 108
- Cenarro et al. (2008) Cenarro A. J., Cervantes J. L., Beasley M. A., Marín-Franch A., Vazdekis A., 2008, ApJ, 689, L29
- Chabrier (2003) Chabrier, G., 2003, PASP, 115, 763
- Cid Fernandes et al. (2001) Cid Fernandes R., Sodr L., Schmitt H. R., Leo J. R. S., 2001, MNRAS, 325, 60
- Cid Fernandes et al. (2005) Cid Fernandes R., Mateus A., Sodr L., Stasiska G., Gomes J. M., 2005, MNRAS, 358, 363
- Cid Fernandes & Gonz´alez Delgado (2010) Cid Fernandes R., Gonzlez Delgado R.M., 2010, MNRAS, 403, 780
- De Angeli et al. (2005) De Angeli F., Piotto G., Cassisi S., Busso G., Recio-Blanco A., Salaris M., Aparicio A., Rosenberg A.,2005, AJ, 130, 116
- de Freitas Pacheco & Barbuy (1995) de Freitas Pacheco J. A., Barbuy B., 1995, A&A, 302, 718
- Dorman (1992) Dorman B., 1992, ApJS, 81, 221
- Dorman et al. (2003) Dorman B., Connell R. W., Rood R. T., 2003, ApJ, 591, 878
- Eggleton (1971) Eggleton P. P., 1971, MNRAS, 151, 351
- Eggleton (1972) Eggleton P. P., 1972, MNRAS, 156, 361
- Eggleton (1973) Eggleton P. P., 1973, MNRAS, 163, 279
- Eggleton et al. (1989) Eggleton P. P., Tout C. A., Fitchett M. J., et al., 1989, ApJ, 347, 998
- Falcn-Barroso et al. (2011) Falcn-Barroso J., Snchez-Blzquez P., Vazdekis A., Ricciardelli E., Cardiel N., Cenarro A. J., Gorgas J., Peletier R. F., 2011, A&A, 532, 95
- Ferraro et al. (2006) Ferraro F. R., et al., 2006, ApJ, 647, L53
- Gallazzi et al. (2005) Gallazzi A., Charlot S., Brinchmann J., White S. D. M., Tremonti C. A., 2005, MNRAS, 362, 41
- Girardi et al. (2000) Girardi L., Bressan A., Bertelli G., Chiosi C., 2000, A&AS, 141, 371
- Gratton et al. (2010) Gratton R., Carretta E., Bragaglia A., Lucatello S., D,Orazi V., 2010, A&A, 517, 87
- Han et al. (2002) Han Z., Podsiadlowski Ph., Maxted P. F. L., Marsh T. R., Ivanova N., 2002, MNRAS, 336, 449
- Han et al. (2003) Han Z., Podsiadlowski Ph., Maxted P. F. L., Marsh T. R., 2003, MNRAS, 341, 669
- Harris (1996) Harris, W. E., 1996, AJ, 112, 1487
- James et al. (2006) James P. A., Salaris M., Davies J. I., Phillipps S., Cassisi S., 2006, MNRAS, 347, 339
- Johnson et al. (1999) Johnson J. A., Bolte M., Stetson P. B., Hesser J. E., Somerville R. S., 1999, ApJ, 527, 199
- Koleva et al. (2008) Koleva M., Prugniel Ph., Ocvirk P., Le Borgne D., Soubiran C., 2008, MNRAS, 385, 1998 (K08)
- Kraft & Ivans (2003) Kraft R. P., Ivans I. I., 2003, PASJ, 115, 143
- Le Borgne et al. (2003) Le Borgne D., et al., 2003, A&A, 402, 433L
- Le Borgne et al. (2004) Le Borgne D., Rocca-Volmerange B., Prugniel Ph., Lançon A., Fioc M., Soubiran C., 2004, A&A, 425, 881
- Lee et al. (2000) Lee H.-C., Yoon S.-J., Lee Y.-W., 2000, AJ, 120, 998
- Lee & Worthey (2005) Lee H.-C., Worthey G., 2005, ApJS, 160, 176
- Lei et al. (2011) Lei Z., Zhang X., Chen X., Zhang F., Li L., Han Z., 2011, in preparation
- Lejeune et al. (1997) Lejeune T., Cuisinier F., Buser R., 1997, A&AS, 125, 229
- Lejeune et al. (1998) Lejeune T., Cuisinier F., Buser R., 1998, A&AS, 130, 65
- Liu (2009) Liu, J., 2009, MNRAS, 400, 1850
- Maraston & Thomas (2000) Maraston C., Thomas D., 2000, ApJ, 541, 126
- Maraston et al. (2001) Maraston C., Kissler-Patig M., Brodie J. P., Barmby P., Huchra J. P., 2001, A&A, 370, 176
- Maraston et al. (2003) Maraston C., Greggio L., Renzini A., Ortolani S., Saglia R. P., Puzia T. H., Kissler-Patig M., 2003, A&A, 400, 823
- Maraston (2005) Maraston C., 2005, MNRAS, 362, 799
- Maraston & Strömbäck (2011) Maraston C., Strömbäck 2011, MNRAS, submitted
- Marín-Feanch et al. (2009) Marín-Franch A., et al., 2009, ApJ, 694, 1498
- Mathis et al. (2006) Mathis H., Charlot S., Brinchmann J., 2006, MNRAS, 365, 385
- Mendel et al. (2007) Mendel J. T., Proctor R. N., Forbes D. A., 2007, MNRAS, 379, 1618
- Miller & Scalo (1979) Miller G. E., Scalo J. M., 1979, ApJS, 41, 531
- Moni Bidin et al. (2007) Moni Bidin C., Moehler S., Piotto G., Momany Y., Recio-Blanco A., 2007, A&A, 474, 505
- Moretti et al. (2008) Moretti A., de Angeli F., Piotto G., 2008, A&A, 483, 183
- Piotto et al. (1999) Piotto G., Zoccali M., King I. R., Djorgovski S. G., Sosin C., Rich R. M., Meylan G., 1999, AJ, 118, 1727
- Piotto et al. (2002) Piotto G., et al., 2002, A&A, 391, 945
- Piotto et al. (2004) Piotto G., et al., 2004, ApJ, 604, 109L
- Pols & Marinus (1994) Pols O. R., Marinus M., 1994, A&A, 288, 475
- Recio-Blabco et al. (2006) Recio-Blanco A., Aparicio A., Piotto G., de Angeli F., Djorgovski S. G., 2006, A&A, 452, 875
- Riffel et al. (2011) Riffel R., Ruschel-Dutra D., Pastoriza M. G., Rodríguez-Ardila A., Santos J. F. C. Jr., Bonatto C. J., Ducati J. R., 2011, MNRAS, 410, 2714
- Puzia et al. (2005) Puzia T. H., Kissler-Patig M., Thomas D., Maraston C., Saglia R. P., Bender R., Goudfrooij P., Hempel M., 2005, A&A, 439, 997
- Salaris & Weiss (2002) Salaris M., Weiss A., 2002, A&A, 388, 492
- Salpeter (1955) Salpeter E. E., 1955, ApJ, 121, 161
- Sánchez-Blázquez et al. (2006) Sánchez-Blázquez P., et al., 2006, MNRAS, 371, 703
- Sandage (1953) Sandage A. R., 1953, AJ, 58, 61
- Schaller et al. (1992) Schaller G., Schaerer D., Meynet G., Maeder A., 1992, A&AS, 96, 269
- Schiavon et al. (2002) Schiavon R. P., Faber S. M., Rose J. A., Castilho B. V., 2002, ApJ, 580, 873
- Schiavon et al. (2005) Schiavon R. P., Rose J. A., Courteau S., MacArthur L. A., 2004, ApJ, 608, 33L
- Schiavon et al. (2005) Schiavon R. P., Rose J. A., Courteau S., MacArthur L. A., 2005, ApJS, 160, 163 (S05)
- Schlegel et al. (1998) Schlegel D. J., Finkbeiner D. P., Davis M., 1998, ApJ, 500, 525
- Schulz et al. (2002) Schulz J., Fritze-v. Alvensleben U., Möller C. S., Fricke K. J., 2002, A&A, 392, 1
- Terlevich & Forbes (2002) Terlevich A. I., Forbes D. A., 2002, MNRAS, 330, 547
- Thomas et al. (2003) Thomas D., Maraston C., Bender R., 2003, MNRAS, 339, 897
- Thomas et al. (2011a) Thomas D., Maraston C., Johansson J., 2011a, MNRAS, 412, 2183
- Thomas et al. (2011b) Thomas D., Johansson J., Maraston C., 2011b, MNRAS, 412, 2199
- Tian et al. (2006) Tian B., Deng L., Han Z., Zhang X., 2006, A&A, 455, 247
- Tinsley (1968) Tinsley B. M., 1968, ApJ, 151, 547
- Tojeiro et al. (2004) Tojeiro R., Heavens A. F., Jimenez R., Panter B., 2007, MNRAS, 381, 1252
- Trager et al. (1998) Trager S. C., Worthey G., Faber S. M., Burstein, D., González J. J., 1998, ApJS, 116, 1
- Trager et al. (2000) Trager S. C., Faber S. M., Worthey G., González J. J., 2000, AJ, 119, 1645
- Vazdekis (1999) Vazdekis A., 1999, ApJ, 513, 224
- Vazdekis et al. (2001) Vazdekis A., Salaris M., Arimoto N., Rose J. A., 2001, ApJ, 549, 274
- Vazdekis et al. (2003) Vazdekis A., Cenarro A. J., Gorgas J., Cardiel N., Peletier R. F., 2003, MNRAS, 340, 1317
- Vazdekis et al. (2010) Vazdekis A., Sánchez-Blázquez P., Falcón-Barroso J., Cenarro A. J., Beasley M. A., Cardiel N., Gorgas J., Peletier R. F., 2010, MNRAS, 404, 1639
- Worthey (1994) Worthey G., 1994, ApJS, 95, 107
- Worthey & Ottaviani (1997) Worthey G., Ottaviani D. L., 1997, ApJS, 111, 377
- Xin et al. (2008) Xin Y., Deng L., de Grijs R., Mackey A. D., Han Z., 2008, MNRAS, 384, 410
- Yi et al. (2004) Yi S. K., Peng E., Ford H., Kaviraj S., Yoon S.-J., 2004, MNRAS, 349, 1493
- Zhang et al. (2004) Zhang F., Han Z., Li L., Hurley J. R., 2004, A&A, 415, 117
- Zhang et al. (2005) Zhang F., Han Z., Li L., Hurley J. R., 2005a, MNRAS, 357, 1088
- Zhang et al. (2005) Zhang F., Li L., Han Z., 2005b, MNRAS, 364, 503
- Zhang & Li (2006) Zhang F., Li L., 2006, MNRAS, 370, 1181
- Zinn & West (1984) Zinn R., West M. J., 1984, ApJS, 55, 45
Appendix A The parameters of Galactic GCs and some influence on age determination
| (1) | (2) | (3) | (4) | (5) | (6) | (7) | (8) | (9) |
|---|---|---|---|---|---|---|---|---|
| NGC | RA | DEC | L | B | RSun | RGc | HBR | |
| (2000) | (2000) | (deg) | (deg) | (kpc) | (kpc) | |||
| 104 | ||||||||
| 1851 | ||||||||
| 1904 | ||||||||
| 2298 | ||||||||
| 2808 | ||||||||
| 3201 | ||||||||
| 5286 | ||||||||
| 5904 | ||||||||
| 5927 | ||||||||
| 5946 | … | |||||||
| 5986 | ||||||||
| 6121 | ||||||||
| 6171 | ||||||||
| 6218 | ||||||||
| 6235 | ||||||||
| 6254 | ||||||||
| 6266 | ||||||||
| 6284 | … | |||||||
| 6304 | ||||||||
| 6316 | ||||||||
| 6333 | ||||||||
| 6342 | ||||||||
| 6352 | ||||||||
| 6356 | ||||||||
| 6362 | ||||||||
| 6388 | … | |||||||
| 6441 | … | |||||||
| 6522 | ||||||||
| 6528 | ||||||||
| 6544 | ||||||||
| 6553 | ||||||||
| 6569 | … | |||||||
| 6624 | ||||||||
| 6626 | ||||||||
| 6637 | ||||||||
| 6638 | ||||||||
| 6652 | ||||||||
| 6723 | ||||||||
| 6752 | ||||||||
| 7078 |
TableA2. The ages and metallicities obtained by three methods (colour, Lick-index and full spectrum-fitting) and literatures. The first column lists the names of Galactic GCs. The 2nd to 7th columns are the ages, metallicities and their errors obtained from three methods, and the 8th and 9th columns are the same parameters from literatures. In the 10th to 12th columns, we list the change of age when eliminating the HB stars for 18 GCs (details see Section 5.1). And the 13th to 15th columns give the change of age when removing the BSs for 9 GCs (details see Section 5.2).
| (1) | (2) | (3) | (4) | (5) | (6) | (7) | (8) | (9) | (10) | (11) | (12) | (13) | (14) | (15) |
|---|---|---|---|---|---|---|---|---|---|---|---|---|---|---|
| NGC | C | [Fe/H]C | I | [Fe/H]I | S | [Fe/H]S | L | [Fe/H]L | ||||||
| (Gyr) | (dex) | (Gyr) | (dex) | (Gyr) | (dex) | (Gyr) | (dex) | (Gyr) | (Gyr) | (Gyr) | (Gyr) | (Gyr) | (Gyr) | |
| 104 | 10.00 | 12.00 | 7.00 | 10.70 | 0.00 | 0.00 | 0.00 | |||||||
| 1851 | 10.00 | 15.00 | 8.00 | 9.20 | uncom∗ | |||||||||
| 1904 | 11.00 | 15.00 | 10.00 | 11.70 | uncom∗ | uncomc | ||||||||
| 2298 | 10.00 | 15.00 | 14.00 | 12.60 | ||||||||||
| 2808 | 10.00 | 10.00 | 6.00 | 10.20 | ||||||||||
| 3201 | 10.00 | 15.00 | 12.00 | 11.30 | ||||||||||
| 5286 | 9.00 | 10.00 | 8.00 | 12.50 | ||||||||||
| 5904 | 10.00 | 10.00 | 9.00 | 10.90 | ||||||||||
| 5927 | 10.00 | 12.00 | 12.00 | 10.50 | ||||||||||
| 5946 | 8.00 | 15.00 | 14.00 | 10.10 | uncom∗ | |||||||||
| 5986 | 8.00 | 12.00 | 6.00 | 12.10 | ||||||||||
| 6121 | 10.00 | 12.00 | 13.00 | 11.70 | ||||||||||
| 6171 | 5.00 | 12.00 | 12.00 | 11.70 | ||||||||||
| 6218 | 9.00 | 9.00 | 12.00 | 12.50 | ||||||||||
| 6235 | 10.00 | 10.0 | 12.00 | 10.20 | ||||||||||
| 6254 | 7.00 | 15.00 | 7.00 | 11.80 | ||||||||||
| 6266 | 10.00 | 12.00 | 7.00 | 10.30 | ||||||||||
| 6284 | 11.00 | 12.50 | 12.00 | 9.60 | ||||||||||
| 6304 | 9.00 | 12.00 | 12.00 | 10.00 | ||||||||||
| 6316 | 10.00 | 15.00 | 12.00 | … | ||||||||||
| 6333 | 7.00 | 15.00 | 10.00 | … | ||||||||||
| 6342 | 5.00 | 9.00 | 10.00 | 10.30 | ||||||||||
| 6352 | 12.00 | 8.00 | 10.00 | 9.90 |
Table A2. Continue
| (1) | (2) | (3) | (4) | (5) | (6) | (7) | (8) | (9) | (10) | (11) | (12) | (13) | (14) | (15) |
|---|---|---|---|---|---|---|---|---|---|---|---|---|---|---|
| NGC | C | [Fe/H]C | I | [Fe/H]I | S | [Fe/H]S | L | [Fe/H]L | ||||||
| (Gyr) | (dex) | (Gyr) | (dex) | (Gyr) | (dex) | (Gyr) | (dex) | (Gyr) | (Gyr) | (Gyr) | (Gyr) | (Gyr) | (Gyr) | |
| 6356 | 9.00 | 9.00 | 11.00 | … | ||||||||||
| 6362 | 11.00 | 10.00 | 10.00 | 11.10 | ||||||||||
| 6388 | 5.00 | 10.00 | 11.00 | 11.50 | ||||||||||
| 6441 | 5.00 | 9.00 | 10.00 | 10.80 | ||||||||||
| 6522 | 10.00 | 9.00 | 8.00 | … | -1.69 | |||||||||
| 6528 | 6.00 | 8.00 | 13.00 | … | ||||||||||
| 6544 | 9.00 | 15.00 | 9.00 | … | ||||||||||
| 6553 | 14.00 | 0.00 | 10.00 | 13.00 | … | |||||||||
| 6569 | 11.00 | 10.00 | 14.00 | … | ||||||||||
| 6624 | 10.00 | 10.00 | 6.00 | 10.60 | ||||||||||
| 6626 | 10.00 | 12.00 | 9.00 | 12.00 | ||||||||||
| 6637 | 13.00 | 15.00 | 8.00 | 10.60 | uncom∗ | uncom∗ | ||||||||
| 6638 | 10.00 | 10.00 | 12.00 | … | ||||||||||
| 6652 | 5.00 | 12.00 | 10.00 | 11.40 | ||||||||||
| 6723 | 12.00 | 9.00 | 11.00 | 11.60 | ||||||||||
| 6752 | 10.00 | 8.00 | 5.00 | 12.20 | ||||||||||
| 7078 | 8.00 | 15.00 | 8.00 | 11.80 | uncom∗ | uncom∗ |
Note.
∗ For GCs beyond Lick indices grids, we do not compare the age after remove the HB stars or BSs and use ′uncom′
to express the change of age.