Scaling of Traction Forces with Size of Cohesive Cell Colonies
Abstract
To understand how the mechanical properties of tissues emerge from interactions of multiple cells, we measure traction stresses of cohesive colonies of 1–27 cells adherent to soft substrates.
We find that traction stresses are generally localized at the periphery of the colony and the total traction force scales with the colony radius.
For large colony sizes, the scaling appears to approach linear, suggesting the emergence of an apparent surface tension of order .
A simple model of the cell colony as a contractile elastic medium coupled to the substrate captures the spatial distribution of traction forces and the scaling of traction forces with the colony size.
PACS numbers: 87.17.Rt, 87.19.R-, 68.03.Cd
Tissues have well defined mechanical properties such as elastic modulus Discher et al. (2005). They can also have properties unique to active systems, such as the homeostatic pressure recently proposed theoretically as a factor in tumor growth Basan et al. (2009). While the mechanical behavior of individual cells has been a focus of inquiry for more than a decade Lee et al. (1994); Ananthakrishnan and Ehrlicher (2007); Vogel and Sheetz (2006); Gardel et al. (2008), the collective mechanics of groups of cells has only recently become a topic of investigation Nelson et al. (2005); du Roure et al. (2005); Trepat et al. (2009); Angelini et al. (2010); Khalil and Friedl (2010); Liu et al. (2010); Saez et al. (2010); Tambe et al. (2011); Maruthamuthu et al. (2011); it is unknown how collective properties of tissues emerge from interactions of many cells.
In this Letter, we describe measurements of traction forces in colonies of cohesive epithelial cells adherent to soft substrates. We find that the spatial distribution and magnitude of traction forces are more strongly influenced by the physical size of the colony than by the number of cells. For large colonies, the total traction force, , that the cell colony exerts on the substrate appears to scale as the equivalent radius, , of the colony. This scaling suggests the emergence of a scale-free material property of the adherent tissue, an apparent surface tension of order . A simple physical model of adherent cell colonies as contractile elastic media captures this behavior.
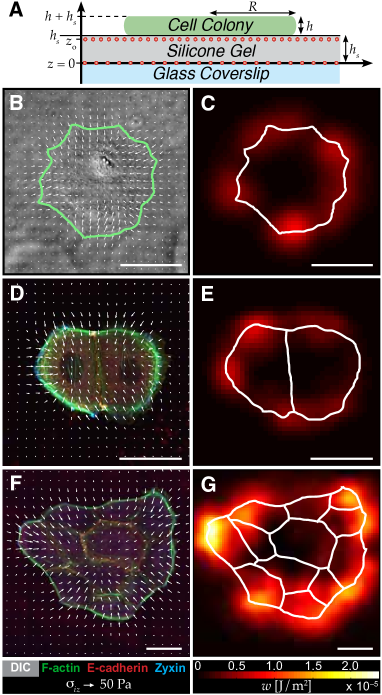
To measure traction stresses that cells exert on their substrate, we used traction force microscopy (TFM) Dembo and Wang (1999). Our TFM setup consisted of a film of highly elastic silicone gel (Dow Corning Toray, CY52-276A/B) with thickness on a rigid glass coverslip (Fig. 1A). Using bulk rheology, we estimated the Young’s modulus of the gel to be . To quantify the gel deformation during our experiments, our substrates contained two dilute layers of fluorescent beads (radius , Invitrogen): one layer between the glass and gel and a second at height above the coverslip Xu et al. (2010). To image the fluorescent beads, we used a spinning-disk confocal microscope (Andor Revolution, mounted on a Nikon Ti Eclipse inverted microscope with a 40 NA 1.3 objective). After determining bead positions using centroid analysis in Matlab Crocker and Grier (1996), we calculated the substrate displacement, , across its stressed (with cells) and unstressed (with cells removed) states. In Fourier space, the in-plane displacement field is related to the traction stresses at the surface of the substrate via linear elasticity, , where represents the in-plane wave vector. Here, and are the Fourier transforms of the in-plane traction stress on the top surface and the displacements just below the surface, respectively. The tensor, , depends on the thickness and modulus of the substrate, the location of the beads, and the wave vector del Alamo et al. (2007); Xu et al. (2010). We calculated the strain energy density, , which represents the work per unit area performed by the cell colony to deform the elastic substrate Butler et al. (2002). The displacement of the surface was determined using .
Primary mouse keratinocytes were isolated and cultured as described in Barrandon and Green (1987). We plated keratinocytes on fibronectin-coated TFM substrates. After the cells proliferated to the desired colony sizes over 6–, we raised the concentration of CaCl2 in the growth medium from to . After 18–24 in the high-calcium medium, cadherin-based adhesions formed between adjacent keratinocytes, which organized themselves into cohesive single-layer cell colonies O’Keefe et al. (1987); Vaezi et al. (2002). After imaging the beads in their stressed positions, we removed the cells by applying proteinase K and imaged the beads in their unstressed positions.
Stress fields and strain energy densities for representative colonies of one, two, and twelve keratinocytes are shown in Fig. 1. Traction stresses generically point inward, indicating that the colonies are adherent and contractile. Regions of high strain energy appear to be localized primarily at the periphery of the single- or multi-cell colony. For single cells, these findings are consistent with myriad previous reports on the mechanics of isolated, adherent cells Wang et al. (2001, 2002); Delanoë-Ayari and Rieu (2010); Fournier et al. (2010). Recent reports have also observed localization of high stress at the periphery of small cell colonies on micropatterned substrates Krishnan et al. (2011) and at edges of cell monolayers Nelson et al. (2005); du Roure et al. (2005); Saez et al. (2010). To visualize cell–cell and cell–matrix adhesions, we immunostained multi-cell colonies for E-cadherin and zyxin. Additionally, we stained the actin cytoskeleton with phalloidin. Actin stress fibers were concentrated at colony peripheries and usually terminated with focal adhesions, as indicated by the presence of zyxin at the fibers’ endpoints. In contrast, E-cadherin was localized at cell–cell junctions, typically alongside small actin fibers. Despite differences in the architecture of the relevant proteins, the stresses and strain energy distributions are remarkably similar in the single-cell and multi-cell colonies.
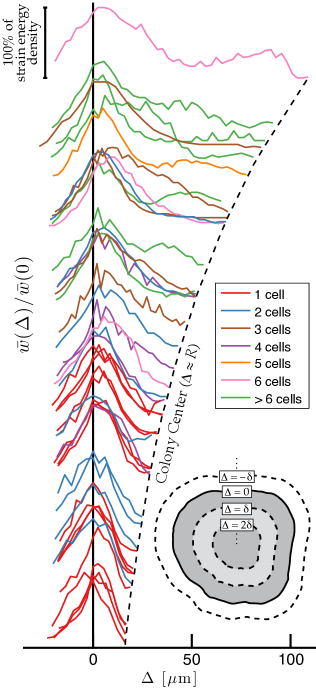
To explore these trends, we measured traction stresses of 45 cohesive colonies of 1–27 cells. For each colony, we defined an equivalent radius, , as the radius of a disk with the same area. The equivalent radii ranged from to . We calculated the average strain energy density as a function of distance, , from the colony edge (Fig. 2 inset). Figure 2 shows the normalized strain energy profiles, , of all 45 colonies. Usually, the strain energy density was largest near the colony edge (). Because of the finite spatial resolution of our implementation of TFM, we measured some strain energy outside colony boundaries ().
Next, we examined how global mechanical activity changes with the cell number and geometrical size of the colony. As in previous studies, we calculated the “total traction force” Califano and Reinhart-King (2010); Fu et al. (2010),
| (1) |
exerted by the cell colony onto the substrate. This quantity is meaningful when stresses have radial symmetry and are localized at the colony edge, which is the case for the majority of colonies in this study. We observed a strong positive correlation between equivalent radius and total force over the range of colonies examined (Fig. 3). Similar trends have been seen for isolated cells over a smaller dynamic range of sizes Tolić-Nørrelykke and Wang (2005); Califano and Reinhart-King (2010); Tan et al. (2003); Fu et al. (2010). We see no systematic differences in for colonies of the same size having different numbers of cells, suggesting that cohesive cells cooperate to create a mechanically coherent unit.
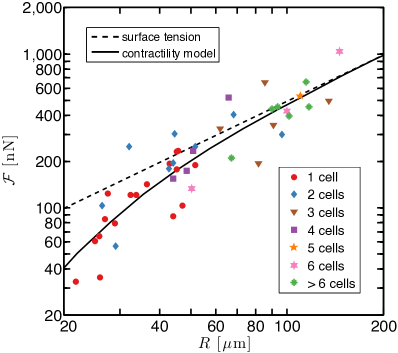
The data in Fig. 3, while scattered, show clear monotonic growth of the mechanical output of cell colonies with their geometrical size, independent of the number of cells. For smaller colonies (), the increase of total force is superlinear. As the cell colonies get larger, the scaling exponent appears to approach unity. We hypothesize that the transition to an apparently consistent exponent for the large colonies reflects the emergence of a scale-free material property of an adherent tissue, defined by the ratio , with dimensions of surface tension.
Just as intermolecular forces yield the condensation of molecules into a dense phase, cohesive interactions between cells, mediated by cadherins, cause them to form dense colonies de Gennes et al. (2004); Foty and Steinberg (2005). For large ensembles of molecules, molecular cohesion creates a free energy penalty per unit area, known as surface tension, for creating an interface between two phases. It is tempting to think of the adherent colonies studied here as aggregates of cohesive cells that have wet the surface Douezan et al. (2011). Indeed, when matter wets a surface, the traction stresses are localized at the contact line Jerison et al. (2011), as we found in our cell colonies (Figs. 1 and 2).
Effective surface tension of cell agglomerates has been invoked to explain cell sorting and embryogenesis Steinberg (2007). Previous measurements of non-adherent aggregates of cohesive cells reported effective surface tensions between and Foty et al. (1994, 1996); Guevorkian et al. (2010). However, the origins of the effective surface tension of cohesive cells are distinct from conventional surface tension. Recently, it was suggested that the surface tension is not only determined by contributions from cell–cell adhesions but also the contraction of acto-myosin networks Käfer et al. (2007); Manning et al. (2010). It is important to distinguish the effective surface tension due to active processes from the familiar surface tension defined in thermodynamic equilibrium.
To elucidate the origins of an effective surface tension in these experiments, we consider a minimal model proposed recently to describe cell–substrate interactions Banerjee and Marchetti (2011); Edwards and Schwarz (2011). We describe a cohesive colony as an active elastic disk of thickness and radius (Fig. 1A). The mechanical properties of the cell colony are assumed to be homogeneous and isotropic with Young’s modulus and Poisson’s ratio . Acto-myosin contractility is modeled as a contribution to the local pressure, linearly proportional to the chemical potential difference, , between ATP and its hydrolysis products Kruse et al. (2005). In our model, the strength of cell–cell adhesions is implicitly contained in the material parameters of the colony, and . The constitutive equations for the stress tensor, , of the colony are then given by
| (2) |
where is the displacement field of the cell colony and a material parameter that controls the strength of the active pressure, . Mechanical equilibrium requires that .
We use cylindrical coordinates and assume in-plane rotational symmetry. The top surface is stress-free, , and we employ a simplified coupling of the colony to the substrate. Ignoring all nonlocal effects arising from the substrate elasticity, . Here, is the radial component of the displacement field, the bar denotes -averaged quantities, and the rigidity parameter, , describes the coupling of the contractile elements of the colony to the substrate. The local proportionality of stress and displacement is accurate only when the substrate thickness is much smaller than the characteristic length scale of the stress distribution or when the cells are on substrates of soft posts Tan et al. (2003).
With these assumptions, the equation of force-balance simplifies to
| (3) |
Combining Eqs. (2) and (3), we find the governing equation for the radial displacement, :
| (4) |
where the penetration length, , describing the localization of stresses near the boundary of the cell colony, is given by .
The solution of Eq. (4) with boundary conditions and can be expressed in terms of modified Bessel functions as
| (5) |
with and .
As in our experiments, the resulting displacements and traction stresses are localized near the colony edge (Fig. 2). To compare quantitatively to experiments, we calculate the total force,
| (6) |
In the large-colony limit, , we find , yielding the anticipated linear growth of total force for large colonies. In this limit, the contractile active pressure dominates over internal elastic stresses and underlies the observed apparent surface tension.
The theory matches the scaling of the data reasonably well with and apparent surface tension , as shown by the solid line in Fig. 3. The penetration length, , is comparable to the spatial resolution of our measurements. For single cells, recent measurements have suggested apparent surface tensions of in an endothelial cell Bischofs et al. (2009) and in Dictyostelium cells Delanoë-Ayari and Rieu (2010). From previously published data on a millimeter-scale adherent sheet of cohesive cells, we calculated the apparent surface tension by integrating the average stress profiles near the sheet edge and found a value of about Trepat et al. (2009). For our cell colonies of thickness , estimated from confocal imaging of phalloidin-stained colonies, the fitted value of the apparent surface tension implies . This value is consistent with that inferred from experiments in crawling keratocytes Kruse et al. (2006). We can estimate the active pressure by assuming , where is the areal density of bound myosin motors, the stiffness of motor filaments, and their average stretch. Using , , and , we find Günther and Kruse (2007); Banerjee et al. (2011).
In conclusion, we demonstrate a scaling relation between total traction force and the geometrical size of cohesive cell colonies adherent to soft substrates. A simple physical model of cohesive colonies as adherent contractile disks captures the essential observations and suggests that the apparent surface tension in the large-colony limit is driven by acto-myosin contractility. It is intriguing that a model of a cell colony with homogenous and isotropic properties is successful when the morphology of the underlying acto-myosin networks within the colony are patently heterogeneous and anisotropic (Fig. 1). Experiments measuring the apparent surface tension of colonies on substrates with different stiffnesses and with molecular perturbations that affect the contractility of acto-myosin networks and strength of intercellular adhesions will help to illuminate the limitations of the current model. Additionally, the relationship between the apparent surface tension measured here in two-dimensional cell colonies and the effective surface tension measured in three-dimensional cell aggregates Foty et al. (1994); Guevorkian et al. (2010) needs to be established. From a cell-biology perspective, it will be essential to determine the molecular mechanisms that regulate a colony’s apparent surface tension.
Acknowledgements.
We are grateful to Paul Forscher and Margaret L. Gardel for helpful discussions and to an anonymous reviewer for useful comments. This work was supported by NSF Graduate Research Fellowships to A.F.M. and C.H., NSF grants to E.R.D. (DBI-0619674) and M.C.M. (DMR-0806511 and DMR-1004789), NIH grants to V.H. (AR054775 and AR060295), as well as support to E.R.D. from Unilever.References
- Discher et al. (2005) D. Discher, P. Janmey, and Y. Wang, Science 310, 1139 (2005).
- Basan et al. (2009) M. Basan, T. Risler, J. Joanny, X. Sastre-Garau, and J. Prost, HFSP Journal 3, 265 (2009).
- Lee et al. (1994) J. Lee, M. Leonard, T. Oliver, A. Ishihara, and K. Jacobson, The Journal of Cell Biology 127, 1957 (1994).
- Ananthakrishnan and Ehrlicher (2007) R. Ananthakrishnan and A. Ehrlicher, International Journal of Biological Sciences 3, 303 (2007).
- Vogel and Sheetz (2006) V. Vogel and M. Sheetz, Nature Reviews Molecular Cell Biology 7, 265 (2006).
- Gardel et al. (2008) M. Gardel, B. Sabass, L. Ji, G. Danuser, U. Schwarz, and C. Waterman, The Journal of Cell Biology 183, 999 (2008).
- Nelson et al. (2005) C. M. Nelson, R. P. Jean, J. L. Tan, W. F. Liu, N. J. Sniadecki, A. A. Spector, and C. S. Chen, Proceedings of the National Academy of Sciences 102, 11594 (2005).
- du Roure et al. (2005) O. du Roure, A. Saez, A. Buguin, R. Austin, P. Chavrier, P. Siberzan, and B. Ladoux, Proceedings of the National Academy of Sciences 102, 14122 (2005).
- Trepat et al. (2009) X. Trepat, M. Wasserman, T. Angelini, E. Millet, D. Weitz, J. Butler, and J. Fredberg, Nature Physics 5, 426 (2009).
- Angelini et al. (2010) T. Angelini, E. Hannezo, X. Trepat, J. Fredberg, and D. Weitz, Physical Review Letters 104, 168104 (2010).
- Khalil and Friedl (2010) A. Khalil and P. Friedl, Integrative Biology 2, 568 (2010).
- Liu et al. (2010) Z. Liu, J. Tan, D. Cohen, M. Yang, N. Sniadecki, S. Ruiz, C. Nelson, and C. Chen, Proceedings of the National Academy of Sciences 107, 9944 (2010).
- Saez et al. (2010) A. Saez, E. Anon, M. Ghibaudo, O. du Roure, J. Di Meglio, P. Hersen, P. Silberzan, A. Buguin, and B. Ladoux, Journal of Physics: Condensed Matter 22, (2010).
- Tambe et al. (2011) D. Tambe, C. Hardin, T. Angelini, K. Rajendran, C. Park, X. Serra-Picamal, E. Zhou, M. Zaman, J. Butler, D. Weitz, et al., Nature Materials 10, 469 (2011).
- Maruthamuthu et al. (2011) V. Maruthamuthu, B. Sabass, U. Schwarz, and M. Gardel, Proceedings of the National Academy of Sciences 108, 4708 (2011).
- Dembo and Wang (1999) M. Dembo and Y. Wang, Biophysical Journal 76, 2307 (1999).
- Xu et al. (2010) Y. Xu, W. Engl, E. Jerison, K. Wallenstein, C. Hyland, L. Wilen, and E. Dufresne, Proceedings of the National Academy of Sciences 107, 14964 (2010).
- Crocker and Grier (1996) J. Crocker and D. Grier, Journal of Colloid and Interface Science 179, 298 (1996).
- del Alamo et al. (2007) J. del Alamo, R. Meili, B. Alonso-Latorre, J. Rodriguez-Rodriguez, A. Aliseda, R. Firtel, and J. Lasheras, Proceedings of the National Academy of Sciences 104, 13343 (2007).
- Butler et al. (2002) J. Butler, I. Tolić-Nørrelykke, B. Fabry, and J. Fredberg, American Journal of Physiology – Cell Physiology 282, C595 (2002).
- Barrandon and Green (1987) Y. Barrandon and H. Green, Proceedings of the National Academy of Sciences 84, 2302 (1987).
- O’Keefe et al. (1987) E. O’Keefe, R. Briggaman, and B. Herman, Journal of Cell Biology 105, 807 (1987).
- Vaezi et al. (2002) A. Vaezi, C. Bauer, V. Vasioukhin, and E. Fuchs, Developmental Cell 3, 367 (2002).
- Wang et al. (2001) H.-B. Wang, M. Dembo, S. Hanks, and Y.-l. Wang, Proceedings of the National Academy of Sciences 98, 11295 (2001).
- Wang et al. (2002) N. Wang, E. Ostuni, G. Whitesides, and D. Ingber, Cell Motility and the Cytoskeleton 52, 97 (2002).
- Delanoë-Ayari and Rieu (2010) H. Delanoë-Ayari and J. Rieu, Physical Review Letters 105, 248103 (2010).
- Fournier et al. (2010) M. Fournier, R. Sauser, D. Ambrosi, J. Meister, and A. Verkhovsky, Journal of Cell Biology 188, 287 (2010).
- Krishnan et al. (2011) R. Krishnan, D. Klumpers, C. Park, K. Rajendran, X. Trepat, J. van Bezu, V. van Hinsbergh, C. Carman, J. Brain, J. Fredberg, et al., American Journal of Physiology – Cell Physiology 300, C146 (2011).
- Califano and Reinhart-King (2010) J. Califano and C. Reinhart-King, Cellular and Molecular Bioengineering 3, 68 (2010).
- Fu et al. (2010) J. Fu, Y. Wang, M. Yang, R. Desai, X. Yu, Z. Liu, and C. Chen, Nature Methods 7, 733 (2010).
- Tolić-Nørrelykke and Wang (2005) I. Tolić-Nørrelykke and N. Wang, Journal of Biomechanics 38, 1405 (2005).
- Tan et al. (2003) J. Tan, J. Tien, D. Pirone, D. Gray, K. Bhadriraju, and C. Chen, Proceedings of the National Academy of Sciences 100, 1484 (2003).
- de Gennes et al. (2004) P.-G. de Gennes, F. Brochard-Wyart, and D. Quèrè, Capillarity and Wetting Phenomena: Drops, Bubbles, Pearls, Waves (Springer-Verlag, New York, 2004).
- Foty and Steinberg (2005) R. Foty and M. Steinberg, Developmental Biology 278, 255 (2005).
- Douezan et al. (2011) S. Douezan, K. Guevorkian, R. Naouar, S. Dufour, D. Cuvelier, and F. Brochard-Wyart, Proceedings of the National Academy of Sciences 108, 7315 (2011).
- Jerison et al. (2011) E. Jerison, Y. Xu, L. Wilen, and E. Dufresne, Physical Review Letters 106, 186103 (2011).
- Steinberg (2007) M. Steinberg, Current Opinion in Genetics & Development 17, 281 (2007).
- Foty et al. (1994) R. Foty, G. Forgacs, C. Pfleger, and M. Steinberg, Physical Review Letters 72, 2298 (1994).
- Foty et al. (1996) R. Foty, C. Pfleger, G. Forgacs, and M. Steinberg, Development 122, 1611 (1996).
- Guevorkian et al. (2010) K. Guevorkian, M. Colbert, M. Durth, S. Dufour, and F. Brochard-Wyart, Physical Review Letters 104, 218101 (2010).
- Käfer et al. (2007) J. Käfer, T. Hayashi, A. F. M. Marée, R. W. Carthew, and F. Graner, Proceedings of the National Academy of Sciences 104, 18549 (2007).
- Manning et al. (2010) M. Manning, R. Foty, M. Steinberg, and E. Schoetz, Proceedings of the National Academy of Sciences 107, 12517 (2010).
- Banerjee and Marchetti (2011) S. Banerjee and M. Marchetti, Europhysics Letters 96, 28003 (2011).
- Edwards and Schwarz (2011) C. Edwards and U. Schwarz, Physical Review Letters 107, 128101 (2011).
- Kruse et al. (2005) K. Kruse, J. Joanny, F. Jülicher, J. Prost, and K. Sekimoto, The European Physical Journal E: Soft Matter and Biological Physics 16, 5 (2005).
- Bischofs et al. (2009) I. Bischofs, S. Schmidt, and U. Schwarz, Physical Review Letters 103, 48101 (2009).
- Kruse et al. (2006) K. Kruse, J. Joanny, F. Jülicher, and J. Prost, Physical Biology 3, 130 (2006).
- Günther and Kruse (2007) S. Günther and K. Kruse, New Journal of Physics 9, 417 (2007).
- Banerjee et al. (2011) S. Banerjee, T. Liverpool, and M. Marchetti, Europhysics Letters 96, 58004 (2011).