Further author information: (Send correspondence to S.G.)
S.G.: E-mail: 210556397@ukzn.ac.za,say.xen@gmail.com, Telephone: +27 (0)31 230 2809
J.J: E-mail: jaidip@iitk.ac.in, P.K.P.: E-mail:pprasanta@iiserk.ac.in and A.P.: E-mail:asima@iitk.ac.in
Wavelet-based multifractal analysis of laser biopsy imagery
Abstract
In this work, we report a wavelet based multi-fractal study of images of dysplastic and neoplastic HE- stained human cervical tissues captured in the transmission mode when illuminated by a laser light (He-Ne 632.8nm laser). It is well known that the morphological changes occurring during the progression of diseases like cancer manifest in their optical properties which can be probed for differentiating the various stages of cancer. Here, we use the multi-resolution properties of the wavelet transform to analyze the optical changes. For this, we have used a novel laser imagery technique which provides us with a composite image of the absorption by the different cellular organelles. As the disease progresses, due to the growth of new cells, the ratio of the organelle to cellular volume changes manifesting in the laser imagery of such tissues. In order to develop a metric that can quantify the changes in such systems, we make use of the wavelet-based fluctuation analysis. The changing self- similarity during disease progression can be well characterized by the Hurst exponent and the scaling exponent. Due to the use of the Daubechies’ family of wavelet kernels, we can extract polynomial trends of different orders, which help us characterize the underlying processes effectively. In this study, we observe that the Hurst exponent decreases as the cancer progresses. This measure could be relatively used to differentiate between different stages of cancer which could lead to the development of a novel non-invasive method for cancer detection and characterization.
keywords:
Monochromatic Transmission imaging, mutli-fractal analysis, cancer detection1 Introduction
The recent surge in the investigation of non-invasive techniques for cancer detection through fluorescence spectroscopy[1, 2, 3, 4, 5, 6], Raman spectroscopy[7], elastic scattering spectroscopy[8, 9], optical gated imaging, optical coherence tomography, diffuse optical tomography, polarization gated imaging [10, 11, 12, 13], turbid medium polarimetry [14] and phase contrast microscopy[15] are some areas being actively pursued to understand the micro-structure variations through disease progression. It is well known that the elastic scattering spectrum contains rich morphological information about the biological tissue samples due to the inhomogeneity of the constituent organelles’ sizes[16, 17, 18, 19, 20, 21, 22, 23, 24, 25, 26, 27, 28, 8, 14]. The angular and wavelength dependence of the elastic scattering spectra have been used to analyze such subtle variations in the morphological changes [16, 19, 21, 26, 28, 9].
In this work, we perform a Monochromatic Transmission Imaging (MTI) of the tissue samples which provides us with small angle scattering information of the biological samples. Ghosh et al.[9] have analyzed the angular dependence of the elastic light scattering spectra in order to analyze the changing multi-fractality of the morphological structures in the tissues. Soni et al.[15], analyzed the multi-fractality of the refractive index variation captured through phase contrast microscopy where the visible range of the electro-magnetic spectrum was used. The MTI presented in this work is a proof-of-concept study of the multi-fractality of elastic scattering in small forward angles through imaging where the contribution of the larger sized scatters is more pronounced[20]. It is well known that the elastic light scattering spectra is the power spectrum of the refractive index variation[29, 30, 31, 32, 33]. Here, we restrict ourselves to a single wavelength in order to observe the refractive index fluctuation at a particular wavelength.
The use of the Wavelet Based Multi-Fractal De-trended Fluctuation Analysis (WBMFDFA) allows the use of the Multi Resolution Analysis (MRA) capability of the wavelet transforms to isolate trends of different polynomial orders. This is particularly helpful in the context of inhomogeneous size distribution of scatterers in a biological sample. This method has been used in various contexts like determining the multi-fractality in light scattering spectra for pre-cancer detection[9] and studying tissue multi-fractality through phase contrast microscopy[15]. Here we apply this method to explore the possibility of differentiating between various stages of cancer.
This article is organized as follows: In the next section (2), we give a brief description of the sample preparation and the experimental setup. In the subsequent section (3), we briefly review the Fourier analysis and the WBMFDFA. In section (4), we present our observations and discuss the results of the analysis. We conclude with future directions in section (5).
2 Experimental materials and methods
2.1 Sample preparation
Hematoxylin and Eosin (HE) stained healthy and histo-pathologically graded neoplastic biopsy samples of human cervical tissues sliced into 4mm 6mm (lateral), 5 m thick sections were prepared on glass slides for the experiment. The 12 healthy and 22 dysplastic tissue samples were obtained from G. S. V. M. Medical College and Hospital, Kanpur, India. HE staining involves nuclear staining by the application of hemalum (a complex of aluminium ions and haematoxylin) followed by the staining of eosinophilic structures by eosin Y[34]. The slide preparation involved standard tissue dehydration, wax embedding and sectioning under a rotary microtome[35].
2.2 Experimental setup
A schematic representation of the experimental setup is shown in Fig. (1).
A 632.8nm (output power 5mW) He-Ne laser (Research Electro-Optics Inc., LHRR-0200,USA) masked by a reflective Neutral Density Filter (NDF) (Special Optics Inc., 9-1051, USA; two NDFs were used: a) with optical density 0.5, 31.62% transmittance and optical density 0.9 with 12.58% transmittance) was used to illuminate the sample S. An aperture was used to control the beam size to 1mm. The transmitted light was collected through a 20X objective (Labomed LP20X Semi Plan Achro) and collimating lenses on an Electron-Multiplying Charge Coupled Device (Andor iXon3 897, with a pixel size 16m 16m and image size 512 512). This recorded raw image was then subtracted by the image of a blank glass slide to remove the artifacts arising due to glass. The exposure time was kept at 0.4s. The resulting image was then cropped for isolating the epithelium and the stroma. False color images of the epithelium for healthy and dysplastic samples are shown in Fig. (2).
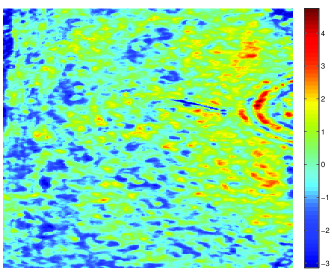
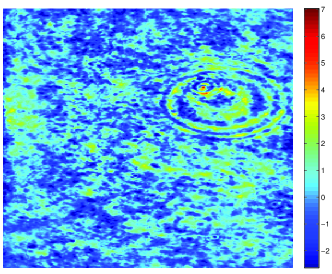
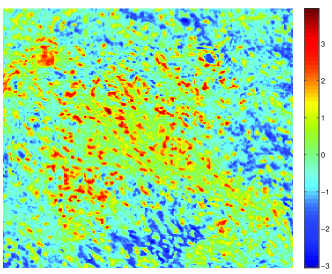
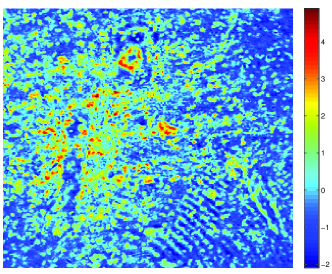
These images were then subjected to fluctuation analysis.
3 Theory
3.1 Image unfolding
The image unfolding is a method to convert two dimensional data into one dimension by horizontally (vertically) concatenating the rows (columns) of the image. For example, a matrix of the form
| (1) |
can be unfolded horizontally as
| (2) |
and vertically as where T is the matrix transpose. This method has been used to study the multi-fractal behavior of human cervical tissues earlier [15] where the multi-fractality of such tissues were analyzed through phase contrast microscopy.
3.2 Spectral characterization
The Fourier power spectrum of a signal is given by
| (3) |
where and are dual spaces of each other and for self-similar processes, the power spectrum is well known to follow a power law
| (4) |
where is called the power law exponent. This is related to the Hurst exponent by , which is a parameter used to describe the self-similarity of mono-fractal processes and is related to the fractal dimension through [36]. However, the ubiquitousness of multi-fractal processes in nature have been well studied and characterized[37]. The multi-fractality is characterized by a described by a spectrum of exponents instead of a single exponent. In the next subsection, we will briefly review the multi-fractal analysis through wavelet based fluctuation analysis.
3.3 Wavelet Based Multi-Fractal De-trended Fluctuation Analysis
The question of multi-fractal signals has been studied by Stanley and his co workers extensively though the Multi-Fractal De-trended Fluctuation Analysis (MFDFA)[38]. The Wavelet Based Multi-Fractal De-trended Fluctuation Analysis (WBMFDFA) proposed by Manimaran et al. [39, 40] used the Multi-Resolution Analysis capability of the wavelet transforms to perform the de-trending of the signals. In this method, we initially make the signal stationary by calculating the log-return series and normalize it to get the normalized log-return series:
| (5) |
where is the time average of the log-return series and is the standard deviation of . Subsequently, we calculate the profile of the series through
| (6) |
We use this profile series to extract the fluctuations through discrete wavelet transform.
The fluctuation extraction involves a wavelet decomposition using the Db4 wavelet which has a support width of 7 and 8 filters[41, 42]. The profile series can be decomposed as
| (7) |
where, is the mother wavelet Db4 and is the father wavelet such that it is orthogonal to the mother wavelet. The coefficients () are called the low pass (high pass) coefficients and capture the trend (fluctuation). The profile is reconstructed at a particular level by taking only the low pass coefficients to extract the trend at level . This trend is subtract from the profile to obtain the fluctuations at each scale. However, due to the convolution errors, these obtained fluctuations could have edge artifacts which are removed by performing this fluctuation extraction on the reversed profile and taking the average[39, 40, 43, 9]. Then these fluctuations are subdivided in to non-overlapping segments such that where the segment length is related to the wavelet scale by the number of filter co-efficients for the wavelet used and is the length of the fluctuations. We obtain the order fluctuation function for as
| (8) |
and for
| (9) |
The fluctuation function and the window size are related by
| (10) |
where is called the generalized Hurst exponent[38]. However, the dependence of on does not make it the ideal parameter for the characterization of multi-fractality [44] and hence a more sophisticated function called the singularity spectrum is required.
The singularity spectrum is related to the generalized Hurst exponent by the relations
| (11) | |||||
| (12) | |||||
| (13) |
Here, is the multi-fractal scaling exponent and is defined by the standard partition function based formalism [37, 45] and and are related by a Legendre transform. A quantity or the width of the singularity spectrum can be an important parameter for the characterization and differentiation of the multi-fractality of a signal. This parameter has recently been used to characterize the network properties of financial markets[46]. We shall use this width of the singularity spectrum to analyze and differentiate between healthy and dysplastic tissue images in the following section.
4 Results and discussions
We have shown the false color blank subtracted images of histo-pathologically characterized samples of healthy and dysplastic human cervical tissues in Fig. (2). The inhomogeneity of the tissue micro-structure due to the presence of various organelles with various refractive indices can be easily observed in the figures. We use the Fourier analysis and the WBMFDFA in order to probe the refractive index variations associated with the structural changes occurring in the course of disease progression.
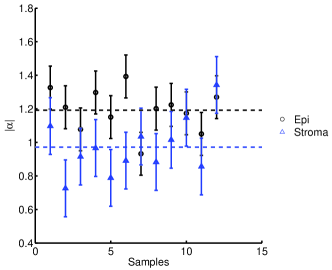
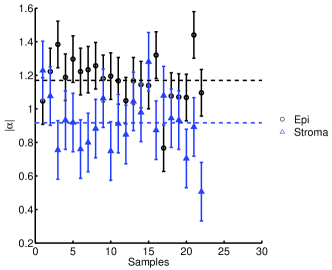
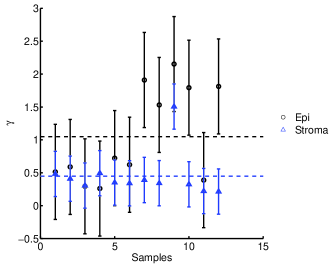
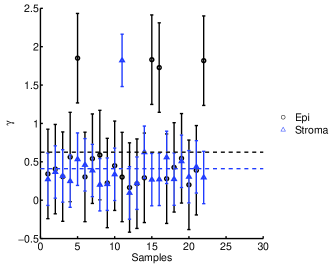
The Fourier power law analysis is based on the mono-fractal hypothesis and proffers the power law exponent which is related to the Hurst exponent by . The Fourier power in this case is a function of the spatial frequency. The values of the for the healthy and dysplastic epithelium and stroma are shown in Fig. (3(a)) and (3(b)). We observe that the mean absolute for the epithelium (stroma) is () for the healthy case while it is () for the dysplatic case. This power law behavior in the spatial frequency domain can be attributed to the inhomogeneous size distribution of the scatterers in the tissue micro-structure. However, this power law exponent is not independent of the scale as has been observed in the case of the phase contrast microscopy[15] and implies the multi-fractal nature of the scatterer composition of the tissues.
In terms of distinguishing different stages of cancer, as compared to the results obtained in the analysis of the phase contrast microscopic images (where the whole visible spectral region (nm-nm) is used as opposed to this method where a monochromatic image at nm is used), the mean value111The mean value here denotes the ensemble average or the average over all the samples. of is lower. Nevertheless, the trend of for dysplastic samples being lower than that of the healthy samples is corroborated at the nm wavelength. As expected, the for the epithelium is higher than that of the stroma . The densely packed structure of the connective fibers in the stroma as compared to the epithelium causes . A comparison of the mean values of and for health and dysplastic tissues is given in table (1). To further verify this and to analyze the multi-fractal nature of the tissues, we proceed to study the images through the WBMFDFA.
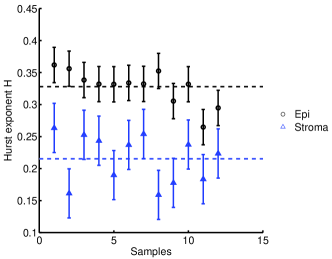
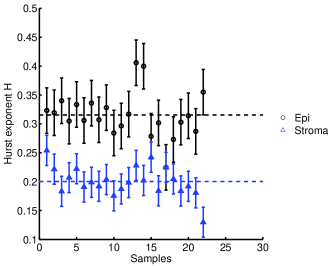
Figure 4 shows the calculated values of the Hurst exponent for healthy and dysplastic tissues in Fig. (4(a)) and (4(b)) respectively. The Hurst exponent for the epithelium and that for the stroma are also compared. We can see that while the healthy tissues show a mean of , the dysplastic tissues display a mean value of . Similarly, the values of mean are and for healthy and dysplastic stroma respectively. This is in agreement with the results of the Fourier analysis based power law calculations. As observed earlier, the . The comparative values of and are given in table (1).
We mentioned in the earlier section that multi-fractal signals require the singularity spectrum for characterization and that the width of the singularity spectrum is a parameter used to describe multi-fractality of the data under consideration. In Fig. (5), the and for healthy 5(a) and dysplastic 5(b) tissues is shown. The mean and are found to be and respectively. As compared to the differences between and and and ; the difference between and is more pronounced. Still, the trend of is followed, also implying the higher multi-fractality of the epithelium as compared to the stroma.
| Parameter | Epithelium | Stroma | ||
|---|---|---|---|---|
| Healthy | Dysplastic | Healthy | Dysplastic | |
5 conclusion
In conclusion, we have compared the normal and dysplastic human cervical epithelium and stroma in an effort to probe the differences between their multi-fractality towards developing a possible non-invasive optical technique for cancer detection. The use of monochromatic imagery for this purpose provides us information about the micro-structural changes in the tissues associated with disease progression.
We observe that the multi-fractality of tissues decreases with progression of cancer. Though the or are not drastically different, the trend of decreasing multi-fractality through the progression is sufficient to quantify the stage of cancer. For example, the decreasing shows that the as the cancer progresses, the tissue micro-structure goes from towards a flatter power spectrum. Similarly, the Hurst exponents show that with the increase in the cancer grades, the structural organization goes from a seemingly more random behavior to a spatially long term correlated behavior. The decreasing implies the decrease in multi-fractality with the disease progression.
This work is a proof of concept about the exploration of monochromatic laser imagery to understand the variations of the tissue micro-structure when observed at a particular wavelength as compared to phase contrast microscopy where the whole visible range is used. However, we believe that due to the presence of various fluorescing enzymes in the cancerous tissues like NAD, the response of the tissues to different wavelengths would be different and a more extensive study of the same is being undertaken which will be reported soon. A notable feature of this study is its candidature for in-vivo examination and characterization of the MTI which is also under investigation currently.
References
- [1] Alfano, R., Tang, G., Pradhan, A., Lam, W., D., C., and OPher, E., “Fluorescence spectra from cancerous and normal human breast and lung tissues,” IEEE J. Quantum Electon. 23, 1806–1811 (1987).
- [2] Richards-Kortum, R. and Sevick-Muraca, E., “Quantitative optical spectroscopy for tissue diagnosis,” Annu. Rev. Phys. Chem. 47(1), 555–606 (1996).
- [3] Ramanujam, N., “Fluorescence spectroscopy of neoplastic and non-neoplastic tissues,” Neoplasia 2(1–2), 89 (2000).
- [4] Ghosh, N., Majumder, S. K., and Gupta, P. K., “Polarized fluorescence spectroscopy of human tissues,” Opt. Lett. 27, 2007–2009 (Nov 2002).
- [5] Biswal, N., Gupta, S., Ghosh, N., and Pradhan, A., “Recovery of turbidity from measured fluorescence: an experimental approach,” Opt. Epress. 11, 3320–3331 (2003).
- [6] Ghosh, N., Majumder, S. K., Patel, H. S., and Gupta, P. K., “Depth-resolved fluorescence measurement in a layered turbid mediumby polarized fluorescence spectroscopy,” Opt. Lett. 30, 162–164 (Jan 2005).
- [7] Haka, A. S., Shafer-Peltier, K. E., Fitzmaurice, M., Crowe, J., Dasari, R. R., and Feld, M. S., “Diagnosing breast cancer by using Raman spectroscopy,” Proc. Natl. Acad. Sci. (USA) 102(35), 12371–12376 (2005).
- [8] Boustany, N. N., Boppart, S. A., and Backman, V., “Microscopic Imaging and Spectroscopy with Scattered Light,” Annu. Rev. Biomed. Eng. 12(1), 285–314 (2010).
- [9] Ghosh, S., Soni, J., Purwar, H., Jagtap, J., Pradhan, A., Ghosh, N., and Panigrahi, P. K., “Differing self-similarity in light scattering spectra: a potential tool for pre-cancer detection,” Opt. Express 19, 19717–19730 (Sep 2011).
- [10] Fujimoto, J., “Optical coherence tomography for ultrahigh resolution in vivo imaging,” Nature Biotechnology 21(11), 1361–1367 (2003).
- [11] Schmitt, J., “Optical coherence tomography (OCT): a review,” IEEE J. Sel. Topics Quantum Electron. 5(4), 1205–1215 (1999).
- [12] Hebden, J. C., Arridge, S. R., and Delpy, D. T., “Optical imaging in medicine: I. Experimental techniques,” Phys. Med. Biol. 42(5), 825 (1997).
- [13] Jacques, S. L. and Ramella-Roman, J. C. and Lee, K., “Imaging skin pathology with polarized light,” J. Biomed. Opt. 7, 329–340 (2002).
- [14] Ghosh, N., Banerjee, A., and Soni, J., “Turbid medium polarimetry in biomedical imaging and diagnosis,” Eur. Phys. J. Appl. Phys. 54(03), 30001 (2011).
- [15] Soni, J., Jose, G. P., Ghosh, S., Pradhan, A., Sengupta, T. K., Panigrahi, P. K., and Ghosh, N., “Probing tissue multifractality using wavelet based multifractal detrended fluctuation analysis: Applications in precancer detection,” in [Biomedical Engineering and Informatics (BMEI), 2011 4th International Conference on ], 1, 448–452 (December 2011).
- [16] Perelman, L. T., Backman, V., Wallace, M., Zonios, G., Manoharan, R., Nusrat, A., Shields, S., Seiler, M., Lima, C., Hamano, T., Itzkan, I., Van Dam, J., Crawford, J. M., and Feld, M. S., “Observation of Periodic Fine Structure in Reflectance from Biological Tissue: A New Technique for Measuring Nuclear Size Distribution,” Phys. Rev. Lett. 80, 627–630 (Jan 1998).
- [17] Ghosh, N., Mohanty, S. K., Majumder, S. K., and Gupta, P. K., “Measurement of Optical Transport Properties of Normal and Malignant Human Breast Tissue,” Appl. Opt. 40, 176–184 (Jan 2001).
- [18] Gurjar, R. S., Backman, V., Perelman, L. T., Georgakoudi, I., Badizadegan, K., Itzkan, I., Dasari, R. R., and Feld, M. S., “Imaging human epithelial properties with polarized light-scattering spectroscopy,” Nature Medicine 7, 1245–1248 (2001).
- [19] Wax, A., Yang, C., and Izatt, J. A., “Fourier-domain low-coherence interferometry for light-scattering spectroscopy,” Opt. Lett. 28, 1230–1232 (Jul 2003).
- [20] Drezek, R., Guillaud, M., Collier, T., Boiko, I., Malpica, A., Macaulay, C., Follen, M., and Richards-Kortum, R., “Light scattering from cervical cells throughout neoplastic progression: influence of nuclear morphology, DNA content, and chromatin texture,” J. Biomed. Opt. 8, 7 (2003).
- [21] Graf, R. and Wax, A., “Nuclear morphology measurements using Fourier domain low coherence interferometry,” Opt. Express 13, 4693–4698 (Jun 2005).
- [22] Tuchin, V. V., Wang, L., and Zimnyakov, D. A., [Optical Polarization in Biomedical Applications ], Springer-Verlag (2006).
- [23] Ghosh, N., Buddhiwant, P., Uppal, A., Majumder, S. K., Patel, H. S., and Gupta, P. K., “Simultaneous determination of size and refractive index of red blood cells by light scattering measurements,” Appl. Phys. Lett. 88(8), 084101 (2006).
- [24] Young L. Kim and Vladimir M. Turzhitsky and Yang Liu and Hariharan Subramanian and Prabhakar Pradhan, “Low-coherence enhanced backscattering: review of principles and applications for colon cancer screening ,” J. Biomed. Opt. 11, 041125 (2006).
- [25] Choi, W., Fang-Yen, C., Badizadegan, K., Oh, S., Lue, N., Dasari, R. R., and Feld, M. S., “Tomographic phase microscopy,” Nature Methods 4, 717–719 (2007).
- [26] Choi, W., Yu, C.-C., Fang-Yen, C., Badizadegan, K., Dasari, R. R., and Feld, M. S., “Field-based angle-resolved light-scattering study of single live cells,” Opt. Lett. 33, 1596–1598 (Jul 2008).
- [27] Yu, C.-C., Lau, C., O’Donoghue, G., Mirkovic, J., McGee, S., Galindo, L., Elackattu, A., Stier, E., Grillone, G., Badizadegan, K., Dasari, R. R., and Feld, M. S., “Quantitative spectroscopic imaging for non-invasive early cancer detection,” Opt. Express 16, 16227–16239 (Sep 2008).
- [28] Kalashnikov, M., Choi, W., Yu, C.-C., Sung, Y., Dasari, R. R., Badizadegan, K., and Feld, M. S., “Assessing light scattering of intracellular organelles in single intact living cells,” Opt. Express 17, 19674–19681 (Oct 2009).
- [29] Xu, M. and Alfano, R. R., “Fractal mechanisms of light scattering in biological tissue and cells,” Opt. Lett. 30, 3051–3053 (Nov 2005).
- [30] Hunter, M., Backman, V., Popescu, G., Kalashnikov, M., Boone, C. W., Wax, A., Gopal, V., Badizadegan, K., Stoner, G. D., and Feld, M. S., “Tissue Self-Affinity and Polarized Light Scattering in the Born Approximation: A New Model for Precancer Detection,” Phys. Rev. Lett. 97, 138102 (Sep 2006).
- [31] Sheppard, C. J. R., “Fractal model of light scattering in biological tissue and cells,” Opt. Lett. 32, 142–144 (Jan 2007).
- [32] Wu, T. T., Qu, J. Y., and Xu, M., “Unified Mie and fractal scattering by biological cells and subcellular structures,” Opt. Lett. 32, 2324–2326 (Aug 2007).
- [33] İlker R. Çapoğlu, Rogers, J. D., Taflove, A., and Backman, V., “Accuracy of the Born approximation in calculating the scattering coefficient of biological continuous random media,” Opt. Lett. 34, 2679–2681 (Sep 2009).
- [34] Kiernan, J. A., [Histological and Histochemical Methods: Theory and Practice ], Bloxham, UK: Scion, 4 ed. (2008).
- [35] Bancroft, J. D. and Gamble, M., [Theory and practice of histopathological techniques ], Churchill Livingstone, 5 ed. (2002).
- [36] Hurst, H., “Long-term storage capacity of reservoirs,” Trans. Am. Soc. Civ. Eng. 116, 770–808 (1951).
- [37] Stanley, H. E. and Meakin, P., “Multifractal phenomena in physics and chemistry,” Nature 335, 405–409 (1988).
- [38] Peng, C.-K., Buldyrev, S. V., Havlin, S., Simons, M., Stanley, H. E., and Goldberger, A. L., “Mosaic organization of dna nucleotides,” Phys. Rev. E 49, 1685–1689 (Feb 1994).
- [39] Manimaran, P., Panigrahi, P. K., and Parikh, J. C., “Wavelet analysis and scaling properties of time series,” Phys. Rev. E 72, 046120 (Oct 2005).
- [40] Manimaran, P., Panigrahi, P. K., and Parikh, J., “Difference in nature of correlation between NASDAQ and BSE indices,” Physica A 387(23), 5810–5817 (2008).
- [41] Daubechies, I., [Ten Lectures on Wavelets ], CBMS-NSF Regional Conference Series in Applied Mathematics, SIAM: Society for Industrial and Applied Mathematics, 1 ed. (June 1992).
- [42] Farge, M., “Wavelet Transforms and their Applications to Turbulence,” Annu. Rev. of Fluid Mech. 24(1), 395–458 (1992).
- [43] Ghosh, S., Manimaran, P., and Panigrahi, P. K., “Characterizing multi-scale self-similar behavior and non-statistical properties of fluctuations in financial time series,” Physica A 390(23-24), 4304 – 4316 (2011).
- [44] Mandelbrot, B., [The fractal geometry of nature ], Wheeler Freeman, San Francisco, USA (1982).
- [45] Eke, A., Herman, P., Kocsis, L., and Kozak, L., “Fractal characterization of complexity in temporal physiological signals,” Physiol. Meas. 23, R1–R38 (2002).
- [46] Ghosh, S., Petruccione, F., and Jaekel, U., “Singularity spectrum based characterization of financial networks,” Unpublished.