Planetesimal Formation at the Boundary Between Steady Super/Sub-Keplerian Flow Created by Inhomogeneous Growth of Magnetorotational Instability
Abstract
We have studied formation of planetesimals at a radial pressure bump in a protoplanetary disk created by radially inhomogeneous magnetorotational instability (MRI), through three-dimensional resistive MHD simulations including dust particles. In our previous papers, we showed that the inhomogeneous MRI developing in non-uniform structure of magnetic field or magnetic resistivity can transform the local gas flow in the disk to a quasi-steady state with local rigid rotation that is no more unstable against the MRI. Since the outer part of the rigid rotation is super-Keplerian flow, a quasi-static pressure bump is created and dust concentration is expected there. In this paper, we perform simulations of the same systems, adding dust particles that suffer gas drag and modulate gas flow via the back-reaction of the gas drag (dust drag). We use super-particles, each of which represents – dust particles with sizes of centimeter to meter. We have found that the dust drag suppresses turbulent motion to decrease the velocity dispersion of the dust particles while it broadens the dust concentrated regions to limit peaky dust concentration, compared with the simulation without the dust drag. We found that the positive effect for the gravitational instability (reduction in the velocity dispersion) is dominated over the negative one (suppression in particle concentration). For meter-size particles with the friction time , where is Keplerian frequency, the gravitational instability of the dust particles that may lead to planetesimal formation is expected. For such a situation, we further introduced the self-gravity of dust particles to the simulation to demonstrate that several gravitationally bound clumps are actually formed. Through analytical arguments, we found that the planetesimal formation from meter-sized dust particles can be possible at AU, if dust spatial density is a few times larger than that in the minimum mass solar nebula.
1 Introduction
Planets form from coalescence of planetesimals in a protoplanetary disk. Planetesimals with more than kilometer sizes should form from dust grains that are initially less than micrometer sizes. However, so called ”meter-size barrier” exists. Because meter-size particles are marginally coupled with disk gas motion and the disk gas rotates slightly slower than Keplerian motion due to radially negative pressure gradient of the gas, the particles suffer ”headwind” and rapidly migrate toward the host star. The infall timescale is only a few hundred years for meter-size particles (Weidenschilling, 1977; Nakagawa et al., 1981), which is much shorter than the growth timescale of particles by mutual collisions. It has not been clarified how the particles grow over meter-sizes before infalling to the host star.
One way to bypass the meter-size barrier is to form clumps from dust particles through self-gravitational instability (GI), which occurs on orbital periods (Safronov, 1969; Goldreich & Ward, 1973), if the dust particles locally have a large enough spatial density. Once bodies of kilometer-size or more are formed, they no longer undergo rapid migration. Original idea for dust concentration for onset of GI was vertical settling of dust grains onto the disk midplane. However, the dust settling induces Kelvin-Helmholtz instability due to difference in rotation velocities between the dust-rich layer (Keplerian) and an overlaying dust-poor layer (sub-Keplerian), and it prevents the dust layer from becoming dense enough for GI (e.g., Weidenschilling, 1980; Cuzzi et al., 1993; Sekiya, 1998; Ishitsu & Sekiya, 2003; Barranco, 2009) unless initial dust to gas ratio in the disk is sufficiently high (e.g., Chiang, 2008; Lee et al., 2010a, b).
Other than the induced KH instability, global turbulence is likely to exist in the disk. While the turbulence generally scatters dust particles, it could concentrate dust particles in anti-cyclonic vortexes (e.g., Barge & Sommeria, 1995; Chavanis, 2000; Johansen et al., 2004; Inaba & Barge, 2006). For this mechanism to lead to GI, relatively high initial surface density of dust and very weak turbulence may be required. In the case of strong turbulence, dust particles have too high velocity dispersion for GI and the high collision velocity between dust particles results in fragmentation rather than growth (Güttler et al., 2009; Zsom et al., 2010). Johansen et al. (2007) performed local three-dimensional MHD simulation including dust particles and showed that weakly fluctuating pressure bumps are created by magnetorotational instability (MRI) and meter-size bodies are concentrated at the bumps. In the relatively-weak turbulence with the viscosity , the dust particles could stay long enough and increase their density to cause GI. They found that back-reaction of drag force from gas to the dust particles, which we hereafter call ”dust drag force,” modulates gas motion to follow the particles in dust-accumulated regions and weaken the turbulence.
Although vertical sedimentation of dust is inhibited by KH instability, radial accumulation is possible. For example, radial dependence of speed of dust migration due to gas drag can enhance the dust to gas ratio to facilitate GI in inner disk regions (Youdin & Shu, 2002; Youdin & Chiang, 2004). This radial migration induces ”streaming instability” if dust drag is considered. In local dust-accumulated areas (dust clumps), the dust drag force modulates the gas flow closer to Keplerian rotation. As a result, ”head wind” to the clumps becomes weaker and their radial migration due to the gas drag becomes slower, which leads to rapid growth of the clumps by capturing dust particles and smaller clumps that migrate faster from outer regions (e.g., Youdin & Goodman, 2005; Youdin & Johansen, 2007; Johansen & Youdin, 2007; Johansen et al., 2009; Bai & Stone, 2010a, b, c). The suppression of local turbulence by the dust drag decreases the velocity dispersion of the dust particles in the clumps, which is also favorable for the GI.
A global radial pressure bump also leads to radial concentration of dust. The inner boundary of ”dead zone” is one of such locations. The growth rate of MRI depends on the magnetic strength and the ionization degree of disk gas (e.g., Jin, 1996; Sano & Miyama, 1999). In the region where the gas ionization degree is low enough or the vertical magnetic field is weak enough, the ohmic dissipation decays MRI there (”dead zone”). The disk gas is ionized by thermal ionization, the stellar X-rays (e.g. Igea & Glassgold, 1999), the cosmic rays (e.g., Umebayashi, 1983) and the radionuclides (e.g. Stepinski, 1992). Gammie (1996) and Sano et al. (2000) showed that the dead zone exists in the disk and it is confined in the inner disk (AU) near the disk midplane. Because the viscosity is lower in the dead zone and disk accretion flux is conserved between the dead and active zones, disk gas column density is enhanced in the dead zone. The positive radial gradient of gas column density at the inner boundary of the dead zone produces a pressure bump in which dust particles accumulate (Dzyurkevich et al., 2010). However, the inner boundary may be located at AU, so the planetesimal formation there may be unable to account for formation of icy planets and cores of gas giants.
The column density of tiny dust grains may be enhanced around a snow line due to slowdown of the dust radial migration speed by diffusion of sublimated vapor (Cuzzi & Zahnle, 2008) or by down-sizing through sublimation of a icy mantle around a silicate core of dust particles (Saito & Sirono, 2011). Since the ionization degree depends on the abundance of the tiny grains (Sano et al., 2000), the ionization degree would significantly decrease around the snow line to produce a local dead zone (Kretke & Lin, 2007; Ida & Lin, 2008). The inner edge of the local dead zone is a favorable site for rapid dust growth in relatively outer regions (Brauer et al., 2008). Kato et al. (2009, which are referred to as Paper I) and Kato et al. (2010, Paper II) pointed out that if the local dead zone induced by the snow line is embedded in the global MRI active zone, the divided inner active zone is sandwiched by the inner global dead zone and the outer local dead zone and it can be a stable barrier for dust radial migration in which dust particles are accumulated. Even if the snow line is not in the global active zone, near the outer boundary of dead zone where MRI is marginal, fluctuations of magnetic fields and/or ionization degree could make radially nonuniform MRI structure that can be approximated by an active zone radially sandwiched by dead zones.
In Paper I and II, we have investigated evolution of gas flow of the active zone radially sandwiched by dead zones, through shearing-box magnetohydrodynamic simulations. In Paper I, performing two-dimensional simulations, we found that the angular velocity profile of gas is modified by local MRI turbulence in radially non-uniform magnetic field. The vigorous angular momentum and mass transport associated with the MRI turbulence lead to a local rigid rotation in the originally active zone. The MRI turbulence can decay to the viscosity level of after the transformation to the quasi-steady state with the local rigid rotation, because there is no shear motion to create MRI while magnetic field remains. In the outer part of the local rigid rotation, gas rotation is super-Keplerian and a pressure bump is formed. Note that this gas flow structure is stable. If the rigid rotation is broken, the induced shear motion again produces MRI and transports angular momentum and mass to recover the rigid rotation as long as the strong enough magnetic field remains.
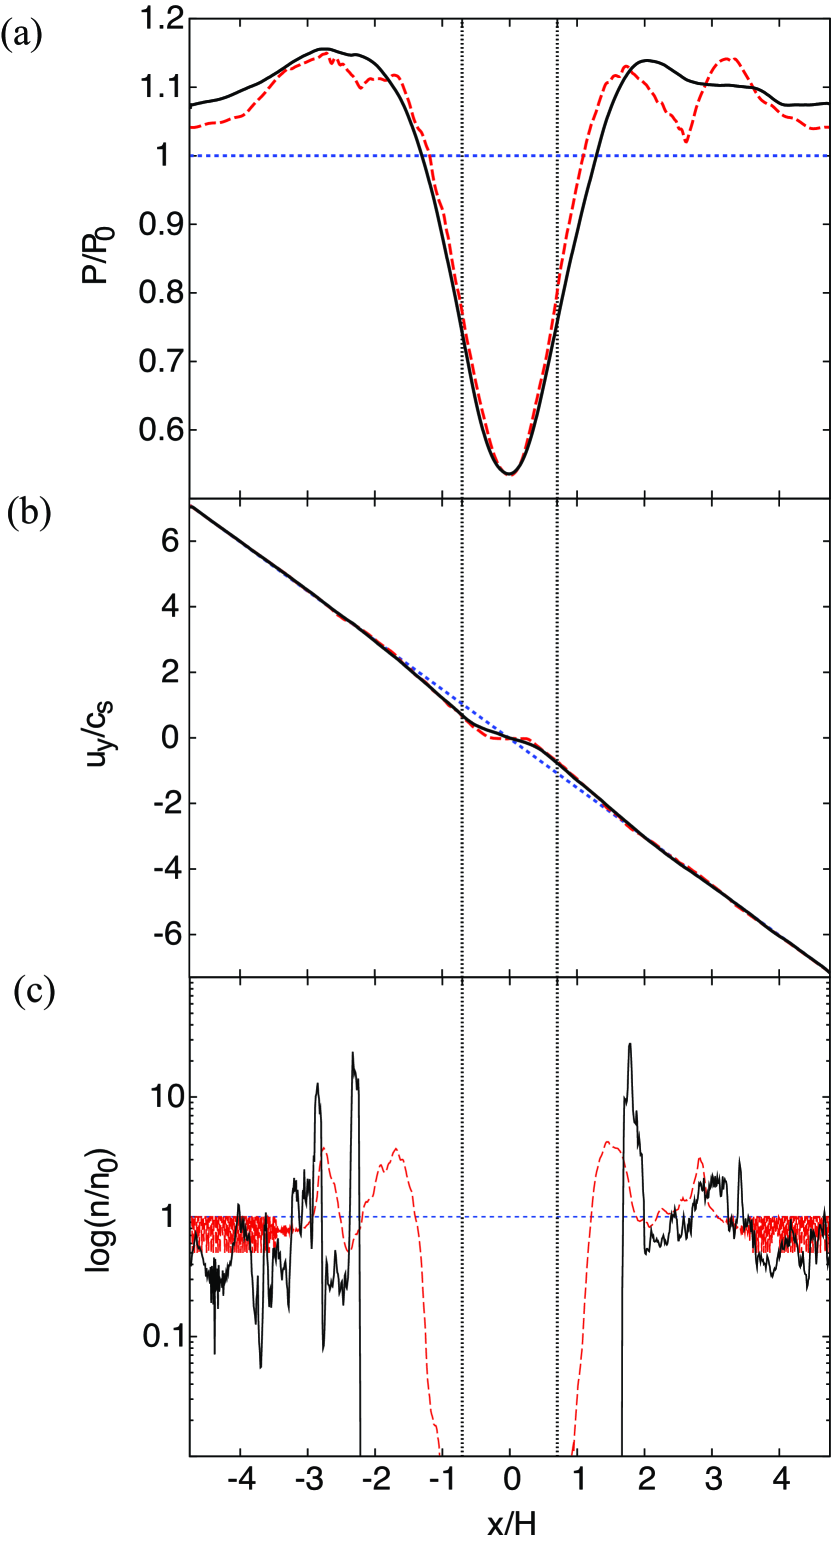
In Paper II, we found the same local rigid rotation in the three-dimensional (instead of two-dimensional) simulation as shown in Figure 1b. The calculations with test particles show that the boundary region between sub- and super-Keplerian zones acts as a strong and stable barrier for the dust migration and it leads to dust particle concentration up to 10,000 times of the initial value (Figure 1c), which could eventually lead to planetesimal formation.
However, the dust drag force onto gas was neglected in Paper II, although it would affect the dust concentration and velocity dispersion of dust particles in the concentrated regions by altering the gas flow. The drag lowers velocity dispersion of dust particles to facilitate the GI, while it broadens the dust accumulated region and suppresses peaky dust concentration that is rather negative for the GI. The latter effect is positive for the GI, while the former is negative. In this paper, we include the dust drag force to the simulations. The equations and initial setup employed in our simulation are described in section 2. In section 3, we show the simulation results. In section 4, we estimate the possibility of the planetesimal formation by analytical arguments. We also demonstrate the planetesimal formation via the GI by numerical simulation including the dust self-gravity. Section 5 is devoted for conclusion and discussion.
2 Equations and model
2.1 Equations
We consider a small region around the midplane which is rotating with the Keplerian frequency at a distance from a central star to study local dust motion and magnetohydrodynamics. The coordinates that we use are where is the radial distance from , is tangential distance, and is vertical distance from the disk midplane.
We include centimeter to meter-size dust particles as super-particles. Total number of the super-particles is and each super-particle represents – small dust particles. The equation of motion of the -th particle is given by
| (1) |
where is the gas velocity at the location of the -th particle, which is interpolated using gas velocities at the neighbor grid points. The third term in the r. h. s. (right hand side) represents the specific gas drag force to the dust particle. We adopt the Epstein drag force,
| (2) |
where and are the internal density and radius of dust particles, and are the spatial density and sound velocity of surrounding gas. The Epstein law is valid for centimeter to meter-size dust particles at AU if gas column density is less than twice as much as that of in the minimum solar nebula model (MMSN; Hayashi, 1981). Even if we consider higher column density, the deviation in the drag force strength from Epstein law would not be significant. The last term in Equation (1) is the self-gravitational force of the dust particles. We calculate the gravitational potential from the interpolated dust spatial density , solving the Poisson equation,
| (3) |
We calculate the self-gravity of the dust particles only in the situations where the GI is expected. We neglect the vertical gravity of the host star that causes settling of dust particles onto a thin layer ( where is the disk scale height; Schräpler & Henning, 2004) near the midplane, because we are interested in radial concentration of dust but not vertical settling. While this would not affect the growth of MRI around the disk mid-plane that we simulate (), we do not have to resolve the thin dust layer, avoiding expensive computational cost.
For the disk gas, we use the isothermal resistive MHD equations,
| (4) | |||||
| (5) | |||||
| (6) | |||||
| (7) |
where we assume constant (an isothermal disk), is the mean velocity field of the dust particles in the grid cell, is the dust to gas ratio, and the term, , expresses the global pressure gradient, which is separated from the local one. Let and be the global pressure and the local pressure variation due to the effect of MRI (). Assuming that , the global pressure gradient is given by
| (8) |
where is the disk scale height defined by . In our local model, is approximated to be constant. Note that both and are negative. Due to the radial pressure gradient, the gas rotation angular velocity is deviated from Keplerian one, as
| (9) |
The last term in the r. h. s. of Eq. (4) is the dust drag force (back-reaction of gas drag force on the dust particles). Except for this term, the equations of motions for disk gas and dust particles are the same as those in Paper II. The purpose of this paper is to study the effect of this term on dust concentration. When dust particles are accumulated and takes a large value of , this term would influence the gas flow. The induction equation (Eq. [6]) has the diffusion term by ohmic dissipation. Since we are interested in relatively inner regions ( a few dozens ), we neglect the ambipolar diffusion that could influence MRI growth in the outer regions of (Chiang & Murray-Clay, 2007). We treat the magnetic resistivity as a constant parameter for simplicity, though in reality it depends on the density of tiny grains ().
We scale length, time, and velocity by , , and in simulations. We solve the MHD equations by combining CIP scheme (Yabe & Aoki, 1991) and MOC-CT method (Stone & Norman, 1992). The dust density is allocated to the closest eight grids in the three-dimensional space using cloud-in-cell (CIC) model. This algorithm strictly conserves angular momentum transfer from dust to gas by using a similar method as Johansen et al. (2007). The boundary conditions in all directions are periodic. For the radial boundary, however, we take into account Keplerian differential rotation with the shearing box model (Wisdom & Tremaine, 1988; Hawley et al., 1995). While we are not interested in vertical sedimentation, we want to keep total dust mass in a whole simulation area, so that we adopt the periodic boundary condition also for vertical direction. The Poisson equation (3) is calculated by Fast Fourier Transform (FFT). This method requires the periodic boundary. For radial direction, according to the sheared boundary, we shift the phase azimuthally in Fourier space after the Fourier transform in the periodic azimuthal direction, following Johansen et al. (2007). Our simulations are performed by a vector computer, NEC SX-9 at ISAS/JAXA.
2.2 Initial conditions
The setup for the simulation in this paper is the same as CASE2 in Paper II. We assume non-uniform to set marginal MRI state where localized dead (stable) and active (unstable) regions co-exist in the initial conditions. The initial magnetic field is , where is the angle between the magnetic field and the vertical axis. We assume a constant value of that is determined by plasma beta , to establish the initial equilibration. With the constant magnetic resistivity of we adopt, a threshold vertical magnetic field for MRI is (Jin, 1996). We set radially varying in which () in the central zone and () in the side regions (see Figure 2b in Paper II), such that MRI grows only in the central zone. We set the radial width of the initially active region as in all cases, and that of the dead regions as in model-s40-* and in model-s05-*, where the asterisk * represents other simulation parameters (see below).
We assume equal-size dust particles with in model-s*-t10-* except for in model-s40-t01-e010, neglecting their coalescence and fragmentation. At 5AU in MMSN, and correspond to the dust sizes of approximately 3 and 30 centimeters, respectively. The super-particles are distributed uniformly such that the initial dust-to-gas ratio for model-s*-t*-e010 and for model-s40-t10-e001. Note that the dust-to-gas ratio in our simulation box corresponds to that near the midplane layer. If vertically global sedimentation of dust particles is taken into account, the dust-to-gas ratio in our simulation box should be larger than that averaged over the whole disk. For comparison, we also present the results of Paper II without the dust drag as model-*-*-test. The self-gravity of dust particles in Equation (1) are switched on only in the saturated state in which the GI is expected.
All of our simulations start with uniform gas density and pressure. The global pressure gradient is set to be . This assumed value of is a few times smaller than that expected at AU in MMSN. In order to compare the results with Johansen et al. (2007) and Paper II, we adopt the small value. As was argued in Paper II, the results would not be affected significantly by the value of . The initial angular velocities of gas and particles are and , respectively. Because gas rotates slower, the particles migrate inward (negative direction of ) in the initial state. Initial disturbances are given randomly to the gas radial velocity with the amplitude of . The size of our simulation box is - and the resolution is . Eight particles are distributed in each grid initially and the total number is . We have tested different number of distributed particles with different mass such that total mass is conserved and found that the results are converged if the distributed number of particles for each grid is . The initial setup is summarized in Table 1.
3 Effect of the dust drag on dust concentration
In the simulations with dust drag, quasi-steady state is formed and the dust particles are concentrated around the outer-edge of the super-Keplerian region by inhomogeneous MRI. Here, we study the effect of the dust drag on the dust concentration by comparing the results with those without the dust drag.
3.1 in a weak remnant turbulence
In this subsection, we discuss the results with , model-s40-t10-e010 with and model-s40-t10-e001 with . Strong dust concentration was found in corresponding models without the dust drag in Paper II (model-s40-t10-test), which is summarized in Figure 1. MRI is excited only in the initially active central region (). The MRI turbulence transfers mass and angular momentum of disk gas to establish a local rigid rotation in the initially active zone through the turbulent viscosity. Then, in the outer half region of the active zone, gas flow is accelerated and migrates outward because of angular momentum gain. On the other hand, in the inner half region, it is decelerated and migrates inward. As a result, gas mass is moved from the central zone to the side zones and gas pressure is lowered in the central zone. The effect of the pressure modulation extends by radial scale of . Equation (9) shows that
| (10) |
This equation shows that super-Keplerian regions are associated with locally positive pressure gradient with some off-set due to global pressure gradient. We find that super-Keplerian regions are created in and (panel a and b). Although MRI turbulence has decayed in the result at , the magnetic field has not been dissipated in the central zone (panel c). The MRI is suppressed by the disappearance of shear motion. If the rigid rotation is perturbed toward the original Keplerian motion, the retrieved shear motion causes MRI again to recover the rigid rotation. Thus, this profile is stable and strong.
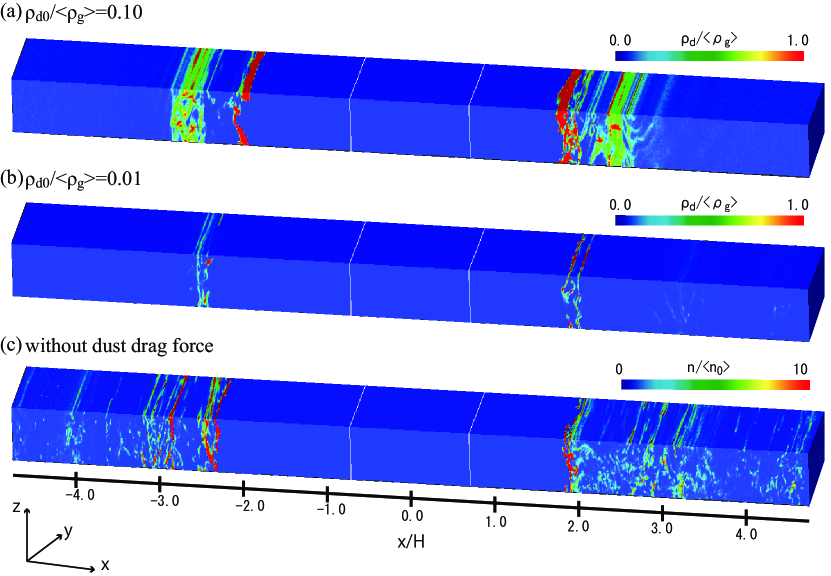
Figure 2 presents the dust density in the saturated state in model-s40-t10-e010 with (panel a) and model-s40-t10-e001 with (panel b), in comparison with model-s40-t10-test without the dust drag (panel c). Because the dust drag depends on spatial density of the dust particles, the results depend on . In all cases, after the particles are swept out of the active region by the MRI turbulence, they accumulate at the outer-edge of the super-Keplerian zone at 2.0 and -2.5. Particles leaving the simulation box from the small (left hand) boundary reenter the simulation region from the large (right hand) boundary after the shearing box correction is taken into account. The dust that reentered from the right hand boundary is halted at , resulting in further increasing of the dust density. The number of locations of dust concentration is fewer in the case with the dust drag, because the drag smoothes out small amplitude fluctuations of gas pressure. In the case with the drag, the individual dust concentrated areas are broader in model-s40-t10-e010 than in model-s40-t10-e001, which is discussed below. We also found that velocity dispersion is lower for a denser clump, which was not observed in the case without the dust drag. The effect of the reduced velocity dispersion will be discussed in section 4.
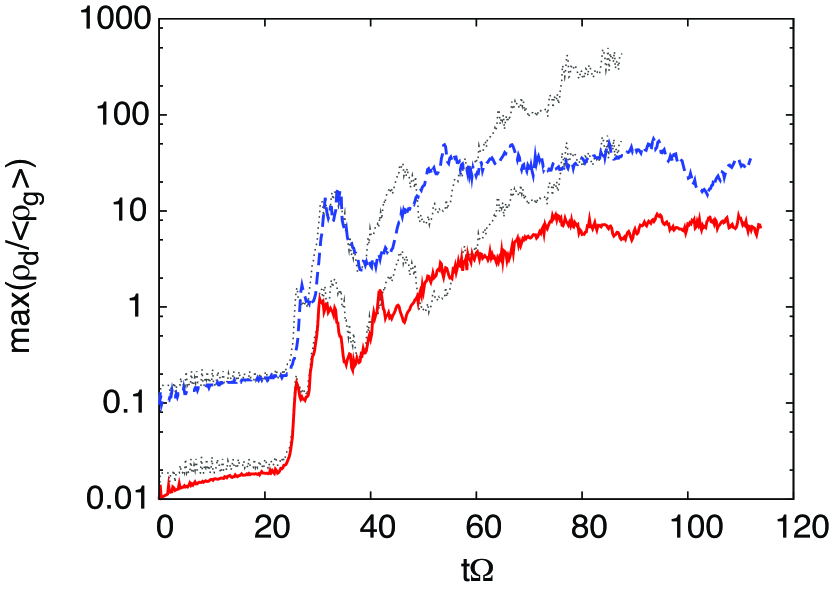
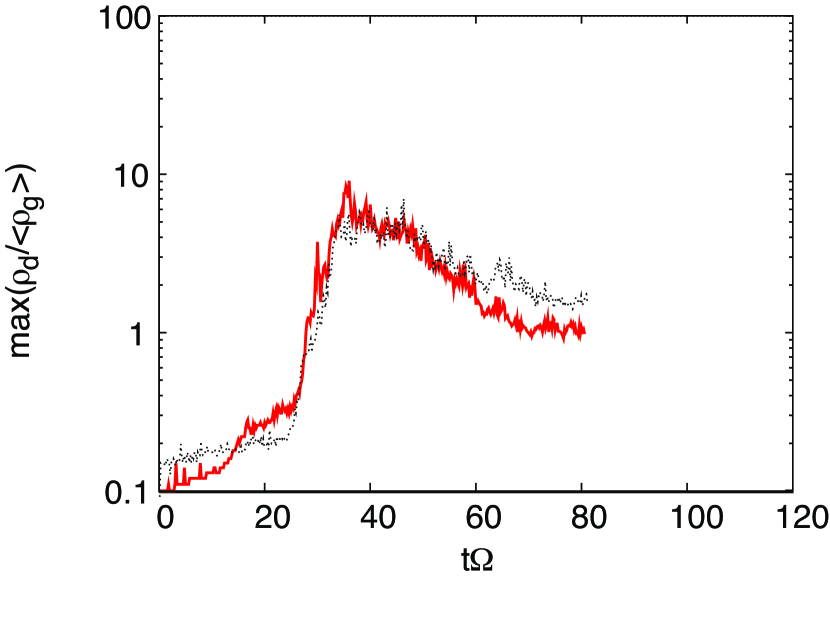
Figure 3 shows the time evolution of the maximum density of dust particles () in the simulation cells. The dust density is scaled by the gas density averaged in the whole simulation region (). The results are compared with those without the dust drag (dashed lines; model-Ls40-t10-test) for and . In the case without the dust drag, only concentration relative to the initial state is measured, so these lines are drawn by the evolution of concentration assuming or . The maximum density continues to increase monotonically in this case. However, the growth of the maximum value is saturated in both cases with the dust drag. The saturation is faster and the increase rate is slightly smaller in model-s40-t10-e010 than in model-s40-t10-e001.
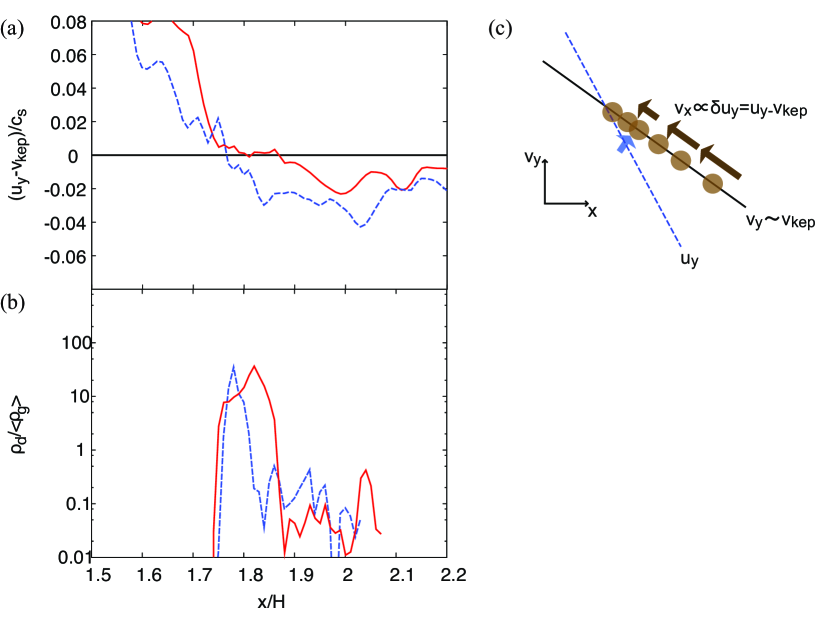
In order to explain the broadening of the dust accumulated region, in addition to the three-dimensional simulations, we performed the two-dimensional (-) version of the model-s40-t10-e010, in which the effect of the dust drag on the radial migration of the dust particles is more clearly shown. In Figure 4a, we plot the difference of gas angular velocity from Kepler angular velocity, , near the sub- and super-Keplerian boundary in the two-dimensional simulation. The velocities are averaged over the vertical direction. At (dashed line), the dust particles are expected to assemble at , where . At (solid line), however, the region with becomes broader (), because more dust particles have migrated to this region and their drag makes the gas flow close to Keplerian. Consequently, the dust particles are more broadly distributed there (Figure 4b). Figure 4c schematically illustrates the effect of the dust drag. The radial velocity () of a migrating dust particle becomes slower as the dust particle approaches the dust-concentrated region of , like ”traffic jam.” Due to the modulation by the dust drag, the radial width of the Keplerian region is expanded, and the dust particles stop their inward migration before they reach the location at which originally. Thus, the maximum dust density is self-regulated as shown in Figure 3.
In the three-dimensional simulation, similar results are obtained, although small amplitude oscillations remain. The similarity implies that geometry is not the main cause for the broadening of the dust concentration region.
3.2 in a weak remnant turbulence
In Paper II, for smaller particles with (model-s40-t01-test), we found that the dust concentration is not significant because the smaller dust particles are affected more by the turbulent diffusion. In the results in section 3.1, we found that the dust drag suppresses the local turbulence and velocity dispersion of the dust particles. It could enhance the dust accumulation by decaying the turbulence around the dust accumulated area, as found in Johansen et al. (2007).
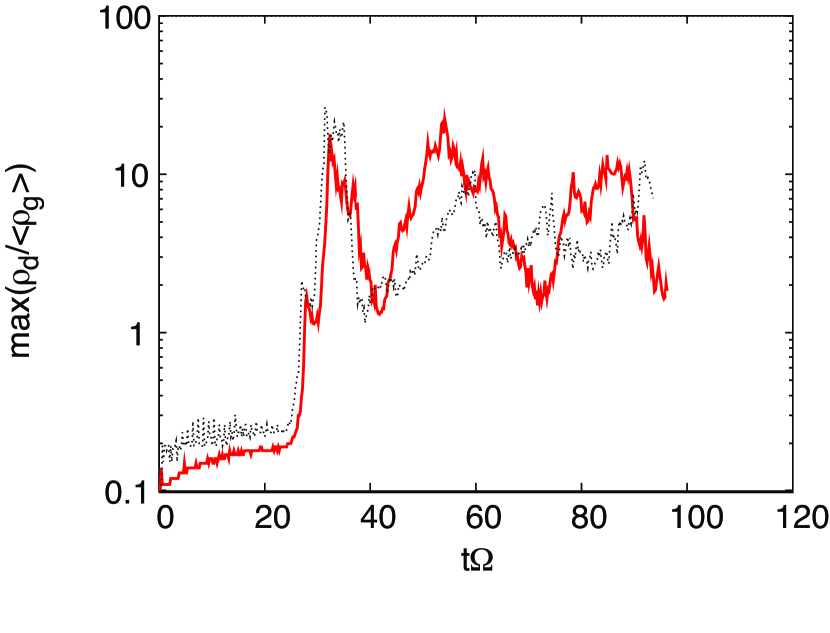
However, the time evolution of the maximum scaled density of dust particles () in model-s40-t01-e010 is not significantly different from that in model-s40-t01-test (Figure 5). In both cases, after rapidly increases by the diffusing-out from the initially active region by the MRI turbulence , it gradually increases and is saturated at . The velocity dispersion of the dust particles is actually reduced from that in the case without the dust drag, but the effect is not strong enough to enhance the dust concentration.
3.3 in a strong remnant turbulence
In Paper II, we found that with the smaller initial dead region , the viscosity in the saturated state is , which is much larger than for the runs with in model-Ls40-*. We found in Paper I that MRI turbulence does not decay if the magnetic Elssaser number radially averaged over the simulation region is smaller than unity in the initial state. Elsasser number is defined by
| (11) |
where is component of Alfven velocity and is spatial density of the disk gas. The run with corresponds to .
The stronger remnant turbulence limited to the values less than 100 even for in the case without the dust drag. We performed the run with , adding the dust drag (model-s05-t10-e010). Although the drag force reduces the turbulent diffusion in the local concentrated region, the maximum dust density is not enhanced from that in the case without the dust drag (Figure 6).
4 Planetesimal formation
As shown in the previous section, the dust accumulation is self-regulated by the effect of the dust drag. The suppressed maximum density of dust particles is unfavorable for the gravitational instability (GI), while their reduced velocity dispersion is favorable. In this section, we analyze the results of previous runs without the self-gravity of dust particles to examine the possibility of subsequent GI. In the results of some favorable runs, we re-perform the simulations, including self-gravity among the dust particles, to demonstrate that the GI actually occurs.
4.1 Analysis of gravitational instability
The GI is expected to arise when the self-gravity of dust particles is dominant over their thermal fluctuation (velocity dispersion), in other words, when the radius (size) of a dust clump with mass is smaller than the Jeans (Bondi) radius,
| (12) |
where and are the total mass and mean velocity dispersion of particles in the region with distance from the center of the clump, is the host star’s mass, , and . The background shear is included in . In order to numerically resolve GI, we set grid size in the -direction such that .
The condition of GI is often described by linear analysis of a uniform axisymmetric disk (e.g., Safronov, 1969; Goldreich & Ward, 1973; Sekiya, 1983), which is essentially equivalent to Toomre’s condition (Toomre, 1964),
| (13) |
where is the unperturbed solid column density. If we use and , the Toomre’s condition is identical to except a numerical factor of 2. Because significant radial inhomogeneity develops before GI occurs in our case, we use the condition that can be locally applied, rather than .
The mass of each super-particle is given by , where and are the spatial density and number density of particles in the initial conditions. Then, the dust clump mass is given by
| (14) |
where is the total particle number in , is its initial value, and by the assumption of a vertically isothermal disk. From Equtaions (12) and (14), the scaled Jeans radius is given by
| (15) |
The initial dust-to-gas density ratio is given. The simulation results give dust enhancement in a clump , the clump size , and velocity dispersion in the clump (the equations of motions we use are normalized by and ). From the results and simulation parameters, we can evaluate for any given values of and that are specified by disk model through Eq. (15).
4.2 Effect of dust drag force on
The onset of GI depends on and as shown by Equation (15). The dust drag suppresses and reduces (section 3). Here, using the arguments in section 4.1., we examine the possibility of the GI in model-s40-t10-e010, which is one of the most promising runs for the GI.
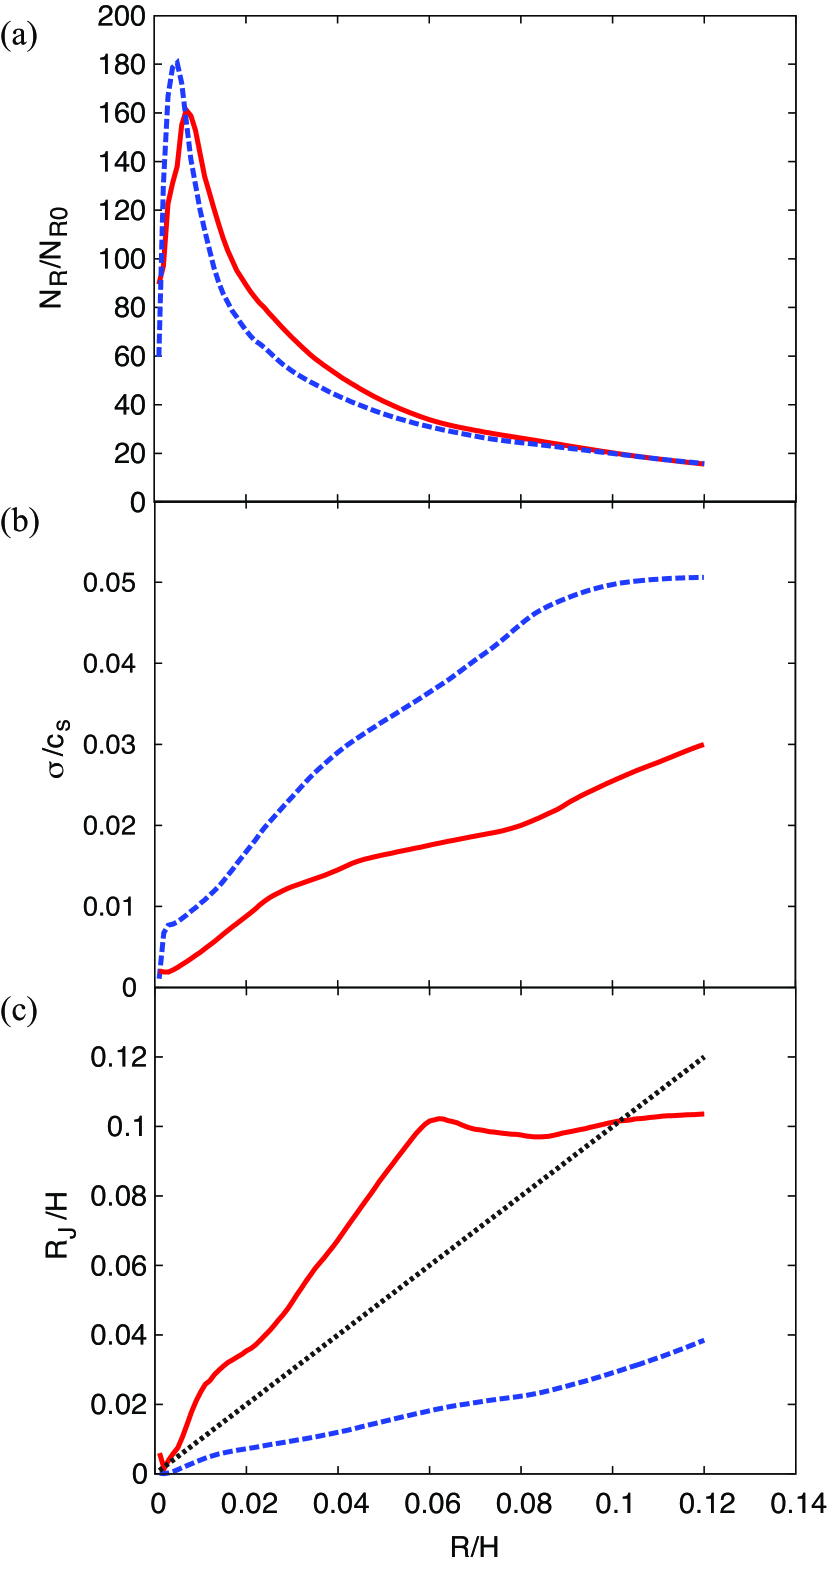
Figure 7 shows from the densest grid point (panel a) and the corresponding (panel b) in the results of model-s40-t10-e010 and model-s40-t10-test at . Panel c shows Jeans radius calculated for , , and , where is gas column density in MMSN). While the particle concentration is lowered by the dust drag only slightly (panel a), the velocity dispersion is significantly reduced (panel b). Since the positive effect for the GI (reduction in the velocity dispersion) is dominated over the negative one (suppression in particle concentration), calculated by Eq. (15) is higher and the condition for the GI () is satisfied in the case with the dust drag (panel c).
4.3 Simulation with dust self-gravity
We carried out additional simulations including the self-gravity force of dust particles to demonstrate the formation of gravitationally bound clumps that may lead to planetesimals, in model-s40-t10-e010. We set , , and . To reduce simulation cost, we introduced the self-gravity at when the dust concentration becomes saturated and is much larger than the grid size .
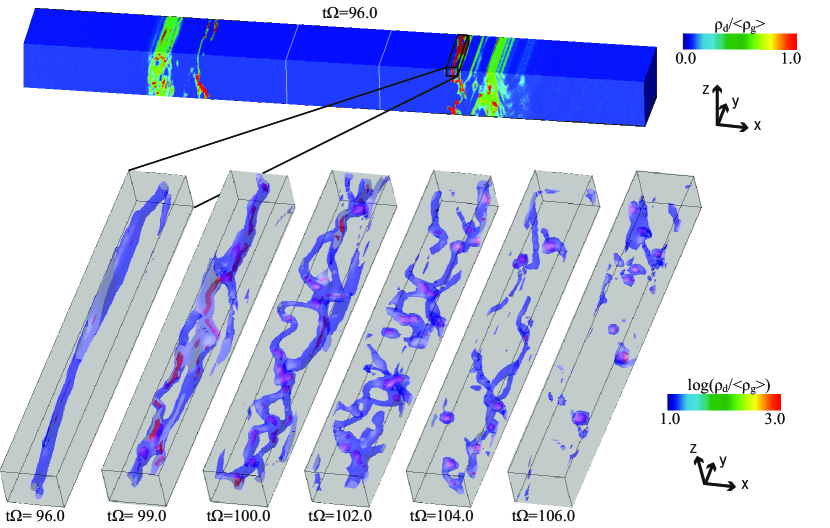
Figure 8 shows the time evolution of the gravitational collapse. Shortly after introduction of the self-gravity, the elongated high density region is kinked () and it is separated into several clumps (). The clumps grow by accreting surrounding dust particles and other clumps (-140).
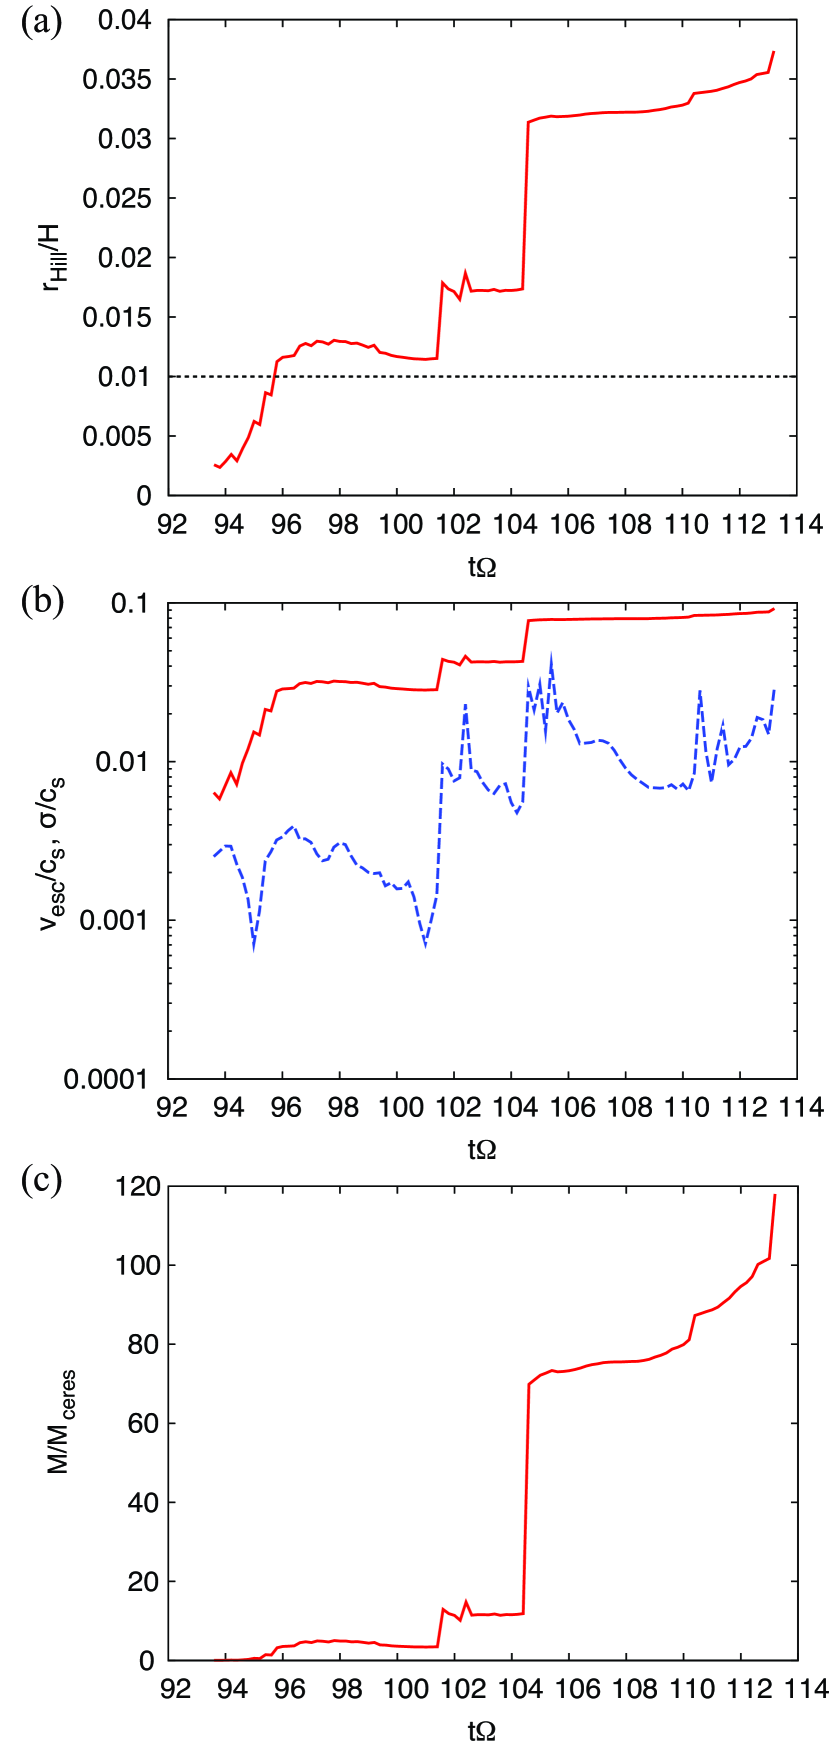
To confirm that the clumps are gravitationally bound and estimate the mass of formed planetesimals, we define the range of a clump by its Hill’s radius. The time evolution of the clump is shown in Figure 9. Figure 9a shows the Hill’s radius, where the grid size is represented by a dashed line. Immediately after the introduction of the self-gravity at , the Hill radius exceeds the grid size. After that, the clump is numerically resolved. Figure 9b shows that the velocity dispersion of the particles in the clump is always smaller than the surface escape velocity of the clump, which implies that the clump is gravitationally bound. If the gravitational collapse continues, it may form a planetesimal, although this simulation does not have resolution to follow the subsequent collapse.
Figure 9c shows the temporal development of the clump mass , which may correspond to the planetesimal mass. The abrupt jumps at and are caused by collisional merging with other clumps. Since the destruction process is not properly included in our simulation, such rapid growth may be unrealistic. A conservative estimate for the planetesimal mass may be the mass before the abrupt jumps, that is, times Ceres mass. However, note that this mass is close to the resolution of our simulation (Figure 9a) and the clump mass may be smaller in a higher-resolution simulation (Johansen et al., 2010).
We also performed the simulation with the self-gravity in model-s40-t10-e001, in which the Jeans radius is slightly larger than our grid size only for short interval. The GI is not found in this case, but it might be seen in a high-resolution simulation.
4.4 Critical gas column density for gravitational instability
In the simulation with addition of the self-gravity in section 4.3, we assumed that corresponds to at . On the other hand, simulations before adding self-gravity are scaled by and .
Here, fixing AU and , we apply the results of individual runs for various to derive a sufficient condition for gas column density to cause the GI. The conditions for the GI is . Since (Equation [15]), the condition is more easily satisfied for larger . In the saturated state in model-s40-t10-e010, the condition is satisfied even at , while we showed the results with in section 4.3. For smaller (model-s40-t10-e001), the critical column density is . The smaller dust particles with have no chance to excite the GI even in the weak residual turbulence (model-s40-t01-e010) as long as . In the stronger remnant turbulence (), the GI is not expected unless (model-s05-t10-e010).
Note that is a function of (Eq. [15]). That is, the possibility of the GI depends on the total column density of dust particles, but not on . Thus, for example, should be similar between the result with in model-Ls40-t10-e010 () and in model-Ls40-t10-e001 () at the same . From the results of simulations in this paper, it is inferred that the GI may occur when .
5 Conclusion and Discussion
We have studied the dust concentration including the ”dust drag force” onto gas (back-reaction of the gas drag exerted onto the dust particles) in a quasi-steady state created by inhomogeneous MRI found by Paper I and II, by performing the three-dimensional resistive MHD simulation including dust particles as super-particles. Since the inertia of the particles is taken into account, the dust drag force modulates gas flow in the dust concentrated regions. We also examined the possibility of the planetesimal formation via gravitational instability (GI) with analysis using Jeans radius of dense dust regions and performed simulations with adding self-gravity of the dust particles to demonstrate that gravitationally bound clumps are actually formed by the GI.
If MRI active and dead zones initially coexist, mass and angular momentum transfer associated by non-uniformly growing MRI turbulence changes the slightly sub-Keplerian gas flow in the initial state to a quasi-steady MRI-stable state in which super- and sub-Keplerian regions are radially adjacent to each other (Paper I), and the dust particles are concentrated at the outer edge of the super-Keplerian region (Paper II). In this paper, we found that the introduction of the dust drag broadens the dust accumulated regions while it reduces velocity dispersion of the particles, depending on the turbulent level and the friction time of the dust particles. We found that the positive effect (the reduction in velocity dispersion) is generally dominated over the negative effect (the broadening of the dust accumulated region). Consequently, in the case with dust drag, the GI is expected in the case of weak remnant turbulence (the turbulent viscosity ) and meter-size particles with , if the initial dust spatial density is a few times larger than that of MMSN. The GI is regulated by the absolute value of the dust spatial density, but not by the dust-to-gas ratio.
Smaller dust particles () are also less likely to cause the GI even in the weak remnant turbulence case, because they are more strongly coupled with gas turbulent motion. Since dust particles should have size distribution, the spatial density contributed from meter-size particles must be a few times larger than total dust density of MMSN for the GI. However, dust settling increases dust density in the layer of midplane that corresponds to our simulation box and it could compensate for the effect of size distribution. If the vertical dust distribution is Gaussian () before the dust settling and it is assumed that most of dust particles settle down to our simulation box with , the averaged dust-to-gas ratio of our simulation box is enhanced by a factor of five from the initial dust-to-gas ratio of the whole disk.
In the models for dust growth in turbulent eddies proposed by other authors, high collision velocity between the dust particles excited by the turbulence may result in fragmentation rather than coalescence, which is not favored for planetesimal formation. However, in our model, MRI turbulence is almost terminated after it transforms the gas flow to the quasi-steady state with the pressure bump, so that the collision velocities between dust particles are as small as – at –, which can avoid fragmentation at mutual collisions.
Radially non-uniform excitation of MRI is an essential point for the emergence of the pressure bump in our model. The growth rate of MRI depends on the strength of the magnetic field and resistivity. In Paper II, we found non-uniform resistivity produces the same quasi-steady state as non-uniform magnetic field that we assume in this paper. In section 1, we raised a possibility of formation of the active zone radially sandwiched by dead zones due to non-uniform resistivity near the snow line. However, the location of the snow line and dead zones are coupled with disk evolution due to viscous diffusion and photoevaporation and also with growth, fragmentation and migration of dust particles. Thus, to evaluate the possibility of radially ”local” planetesimal formation proposed by this paper, full-scale coupled evolution of the snow line, the dead zone, the disk gas ionization degree and dust growth needs to be studied theoretically and by observation with ALMA.
References
- Bai & Stone (2010a) Bai, X.-N. & Stone, J. M. 2010, ApJ, 722, 143
- Bai & Stone (2010b) Bai, X.-N. & Stone, J. M. 2010, ApJ, 722, L220
- Bai & Stone (2010c) Bai, X.-N. & Stone, J. M. 2010, ApJS, 190, 297
- Balbus & Hawley (1998) Balbus, S. A., & Hawley, J. F. 1998, Reviews of Modern Physics, 70, 1
- Barge & Sommeria (1995) Barge, P., & Sommeria, J. 1996, A&A, 295, 1
- Barranco (2009) Barranco, J. 2009, ApJ, 691, 907
- Bulm and Wurm (2008) Bulm, J., & Wurm, G. 2008, ARA&A, 46, 21
- Brauer et al. (2008) Brauer, F., Henning, Th., & Dullemond, C. P. 2008, A&A, 487, L1
- Chavanis (2000) Chavanis, P. H. 2000, A&A, 356, 1089
- Chiang (2008) Chiang, E. I. 2009, ApJ, 675, 1549
- Chiang & Murray-Clay (2007) Chiang, E. I., & Murray-Cley, R. A. 2007, Nature Phys., 3, 604
- Cuzzi et al. (1993) Cuzzi, J. N., Dobrovolskis, A. R. & Champney, J. M. 1993, Icarus, 106, 102
- Cuzzi & Zahnle (2008) Cuzzi, J. N., & Zahnle, K. J. 2008, ApJ, 614, 490
- Dominik & Tielens (1997) Dominik, C., & Tielens, A. G. G. M. 1997, ApJ, 480, 647
- Dzyurkevich et al. (2010) Dzyurkevich, N., Frock, M., Turner, N. J., Klahr, H., & Henning, Th. 2010, A&A, 515, A70
- Fleming et al. (2000) Fleming, T. P., Stone, J. M., & Hawley, J. F. 2000, ApJ, 530, 464
- Fromang & Papaloizou (2007) Fromang, S., & Papaloizou, J. 2007, A&A, 476, 1113
- Gammie (1996) Gammie, C. F. 1996, ApJ, 457, 355
- Goldreich & Ward (1973) Goldreich, P., & Ward, W. R. 1973, ApJ, 183, 1051
- Güttler et al. (2009) Güttler, C., Blum, J., Zsom, A., Ormel, C. W., & Dullemond, C. P. 2009, A&A, 513, A56
- Hayashi (1981) Hayashi, C., 1981, Prog. Theor. Phys. Suppl. 70, 35
- Hawley et al. (1995) Hawley, J. F., Gammie, C. F., & Balbus, S. A. 1995, ApJ, 440, 742
- Ida & Lin (2004) Ida, S., & Lin, D. N. C. 2004, ApJ, 604, 388
- Ida & Lin (2008) Ida, S., & Lin, D. N. C. 2008, ApJ, 673, 487
- Igea & Glassgold (1999) Igea, J., & Glassgold, A. E. 1999, ApJ, 518, 848
- Inaba & Barge (2006) Inaba, S., & Barge, P. 2006, ApJ, 649,415
- Ishitsu & Sekiya (2003) Sekiya, M. & Ishitsu, N. 2003, Icarus, 165, 181
- Jin (1996) Jin, L. 1996, ApJ, 457, 798
- Johansen et al. (2004) Johansen, A., Andersen, A. C., & Brandenburg, A. 2004, A&A, 417, 361
- Johansen et al. (2006a) Johansen, A., Klahr, H., & Henning, Th. 2006, ApJ, 636, 1121
- Johansen et al. (2007) Johansen, A., Oishi, J. S., Mac Low, M,-M., Klahr, H., Henning, Th., & Youdin, A. 2007, Nature, 448, 1022
- Johansen & Youdin (2007) Johansen, A., & Youdin, A. N. 2007, ApJ, 662, 627
- Johansen et al. (2009) Johansen, A., Youdin, A., & Low, M. 2009, ApJ, 704, L75
- Johansen et al. (2010) Johansen, A., Klarhr, H., & Henning, Th. 2010, arXiv1010.4757J
- Kato et al. (2009) Kato, M. T., Nakamura, K., Tandokoro, R., Fujimoto, M., & Ida, S. 2009, ApJ, 691, 1697 (Paper I)
- Kato et al. (2010) Kato, M. T., Fujimoto, M., & Ida, S. 2010, ApJ, 714, 1155 (Paper II)
- Kokubo & Ida (1998) Kokubo, E., & Ida, S. 1998, Icarus, 77, 330
- Kretke & Lin (2007) Kretke, K. A., & Lin, D. N. C. 2007, ApJ, 664, L55
- Lee et al. (2010a) Lee, A. T., Chiang, E., Asay-Davis, X. & Barranco, J. 2010, ApJ718, 1367L
- Lee et al. (2010b) Lee, A. T., Chiang, E., Asay-Davis, X. & Barranco, J. 2010, ApJ725, 1937L
- Malhotra (1993) Malhotra, R. 1993, Nature, 365, 819
- Morbidelli et al. (2009) Morbidelli, A., Bottke, W. F., Nesvorny, D., & Levison, F. 2009, Icarus, 204, 558
- Nakagawa et al. (1981) Nakagawa, Y., Nakazawa, K. & Hayashi, C. 1981, Icarus, 45, 517
- Safronov (1969) Safronov, V. S. 1969, Evolution of the Protoplanetary Cloud and the Planets, NASA Tech. Transl. F-677
- Saito & Sirono (2011) Saito, E., & Sirono, S. 2011, ApJ, 728, 20
- Sano et al. (1998) Sano, T., Inutsuka, S., & Miyama, S. M. 1998, ApJ, 506, L57
- Sano & Miyama (1999) Sano, T., & Miyama,S. M. 1999, ApJ, 515, 776
- Sano et al. (2000) Sano, T., Miyama, S. M., Umebayashi, T., & Nakano, T. 2000, ApJ, 543, 486
- Schräpler & Henning (2004) Schräpler, R., & Henning, Th. 2004, ApJ, 614, 960
- Sekiya (1983) Sekiya, M. 1983, Prg. Theor. Phys., 69, 1116
- Sekiya (1998) Sekiya, M. 1998, Icarus, 133, 298
- Shu et al. (1987) Shu, F. H., Adams, F. C., & Lizano, S. 1987, ARA&A, 25, 23
- Stepinski (1992) Stepinski, T. F. 1992, Icarus, 97, 130
- Stone & Norman (1992) Stone, J. M., & Norman, M. L. 1992a, ApJS, 80, 753, 1992b, ApJS, 80, 791
- Toomre (1964) Toomre, A. 1964, ApJ, 139, 1217
- Umebayashi (1983) Umebayashi, T. 1983, Prog. Theor. Phys., 69, 480
- Weidenschilling (1977) Weidenschilling, S. J. 1977, MNRAS, 180, 57
- Weidenschilling (1980) Weidenschilling, S. J. 1980, Icarus, 44, 172
- Wetherill & Steward (1989) Wetherill, G. W., & Steward, G. R., 1989, Icarus, 77, 330
- Wisdom & Tremaine (1988) Wisdom, J., & Tremaine, S. 1988, AJ, 95, 925
- Yabe & Aoki (1991) Yabe, T., & Aoki, T. 1991, Comput. Phys. Comm., 66, 219
- Youdin & Chiang (2004) Youdin, A. N. & Chiang, E. I. 2004, ApJ, 601, 1109
- Youdin & Shu (2002) Youdin, A. N. & Shu, F. 2002, ApJ, 580, 494
- Youdin & Goodman (2005) Youdin, A. N., & Goodman, J. 2005, ApJ, 662, 613
- Youdin & Johansen (2007) Youdin, A. N., & Johansen, A. 2007, ApJ, 662, 613
- Zsom et al. (2010) Zsom, A., Ormel, C. W., Güttler, C., Blum, J., & Dullemond, C. P. 2010, A&A, 513, A57
| Run | self-gravity | |||
|---|---|---|---|---|
| model-s40-t10-e010 | 4.0 | 1.0 | 0.10 | off and on |
| -t10-e001 | 4.0 | 1.0 | 0.01 | off and on |
| -t10-test | 4.0 | 1.0 | 0.0 | off |
| -t01-e010 | 4.0 | 0.1 | 0.10 | off |
| -t01-test | 4.0 | 0.1 | 0.0 | off |
| model-s05-t10-e010 | 0.55 | 1.0 | 0.10 | off |
| -t10-test | 0.55 | 1.0 | 0.0 | off |