Pressure-induced Phonon Softenings and the Structural and Magnetic Transitions in CrO2
Abstract
To investigate the pressure-induced structural transitions of chromium dioxide (CrO2), phonon dispersions and total energy band structures are calculated as a function of pressure. The first structural transition has been confirmed at P 10 GPa from the ground state tetragonal CrO2 (t-CrO2) of rutile type to orthorhombic CrO2 (o-CrO2) of CaCl2 type. The half-metallic property is found to be preserved in o-CrO2. The softening of Raman-active B1g phonon mode, which is responsible for this structural transition, is demonstrated. The second structural transition is found to occur for P 61.1 GPa from ferromagnetic (FM) o-CrO2 to nonmagnetic (NM) monoclinic CrO2 (m-CrO2) of MoO2 type, which is related to the softening mode at q = R(,0,). The third structural transition has been newly identified at P= 88.8 GPa from m-CrO2 to cubic CrO2 of CaF2 type that is a FM insulator.
pacs:
61.50.Ks, 63.20.dk, 71.15.Rf, 74.25.KcI Introduction
Chromium dioxide (CrO2), which crystallizes in the tetragonal structure of rutile-type, is a well-known material because of its half-metallic nature with K.Schwarz86 The origin of the ferromagnetic (FM) and half-metallic property of CrO2 was explained in terms of the double-exchange model.Korotin98 ; Katsnelson08 Due to the crystal field of distorted (flattened) Cr-O6 octahedra, Cr states are split into lower dxy and higher dxz/dyz states. Out of two electrons of Cr4+, one occupies the lower dxy that is localized, while the other occupies the higher dxz/dyz that are delocalized near the Fermi level () due to the hybridization with O states. Then the double-exchange interaction arises from the Hund coupling between localized dxy and delocalized half-filled dxz/dyz states, so as to produce the FM and half-metallic properties.
In contrast to numerous reports on electronic and magnetic properties of CrO2, there have been relatively small number of studies on structural and lattice dynamical properties of CrO2. Especially, there is no experimental or theoretical report on the phonon dispersion curve for CrO2, except for a few Raman studies.Maddox06 ; Iliev99 ; Yu03 Under the pressure, CrO2 is known to undergo the structural transition from the ground state tetragonal CrO2 (t-CrO2) to the orthorhombic CrO2 (o-CrO2) of CaCl2-type at P = 12-14 Gpa.Maddox06 ; Kuznetsov06 The question followed is whether there will an additional structural transitions from o-CrO2 at higher pressure. In fact, this question is not just for CrO2 but also relevant to the structural stability issue of transition-metal (TM) dioxides (TMO2). Note that TMO2s show diverse structures depending on the TM elements.Matteiss76 ; Pynn76 ; Eyert00 ; Eyert02 Furthermore, magnetic properties of CrO2 under the pressure are intriguing, such as (i) whether the half-metallic nature is preserved, and (ii) when CrO2 becomes non-magnetic.
In this work, to investigate the pressure-induced structural transitions of CrO2, we have studied phonon dispersions and total energies of relevant CrO2 structures as a function of pressure. Based on the calculated phonon dispersions and the total energies, we have found three possible structural transitions with increasing pressure. The first transition is consistent with the known transition from t-CrO2 to o-CrO2. At this transition, FM and half-metallic properties are preserved, in agreement with previous reports of literature.Maddox06 ; Kuznetsov06 The second transition is from o-CrO2 to monoclinic CrO2 (m-CrO2) of MoO2 type, which is nonmagnetic (NM). The third transition is identified from m-CrO2 to cubic CrO2 (c-CrO2) of CaF2-type. Interestingly, c-CrO2 is a FM insulator even at the high pressure of P 88.8 GPa. Note that the second and third structural transitions are our new findings for CrO2 under the high pressure.
II Computational Details
Band structures and phonon dispersions of CrO2 were obtained by employing the pseudo-potential band method and the linear response method, respectively, implemented in the Quantum ESPRESSO code.Giannozzi09 ; Comp The generalized gradient approximation (GGA) is utilized for the exchange-correlation potential. Self-consistent electron and phonon band calculations were carried out after the full-relaxation of internal atomic positions and lattice parameters.
We have considered various structures of CrO2. At the ambient pressure, the stable phase is t-CrO2 of rutile-type (P42/mnm), in which Cr atoms are positioned at (0,0,0) and (, , ), while O atoms at (u, u, 0) and (+u, u, ). Initial lattice constants and atomic positions adopted before the full-relaxation are a=b=4.421, c=2.916, and u=0.3043.Xue-Wei07 For the high pressure phase of o-CrO2 of CaCl2-type (Pnnm), we have adopted a=4.3874, b=4.2818, c=2.8779, ux =0.299, and uy=0.272.Maddox06 For candidate structural phases at the higher pressure, we considered m-CrO2 of MoO2 type (P21/c)Eyert00 ; Eyert02 and c-CrO2 of CaF2-type (Fmm).Srivastava08 In the latter, a Cr atom is positioned at (0, 0, 0), and O atoms at (0.25, 0.25, 0.25), (0.25, 0.25, 0.75).
III Results
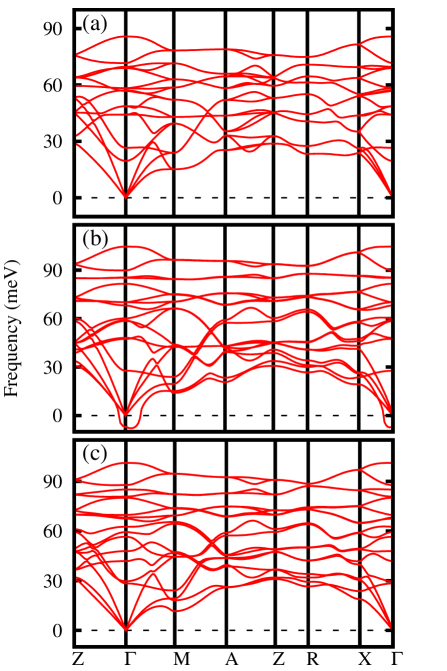
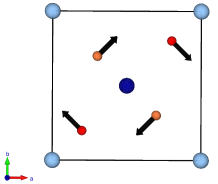
Figure 1 shows the phonon dispersions of t-CrO2 and o-CrO2 at the ambient and high pressures. As shown in Fig. 1(a), t-CrO2 at the ambient pressure has regular phonon dispersions, reflecting the stable phase of t-CrO2 at the ambient pressure. In contrast, t-CrO2 at P=34.0 GPa in Fig. 1(b) has a softening phonon mode at q=, indicating the structural instability of t-CrO2 at this pressure. The softened mode corresponds to B1g mode that is Raman-active. As shown in Fig. 2, B1g mode generates the rotating motions of oxygen ions. The resulting lattice displacements induce the structural transformation from t-CrO2 of rutile type to o-CrO2 of CaCl2 type. Figure 1(c) provides the phonon dispersion of o-CrO2 at P=34.1 GPa. The phonon dispersion is regular, implying that o-CrO2 is stable at this pressure. Therefore, Fig. 1 clearly demonstrates that there is a structural transition from t-CrO2 to o-CrO2 at the pressure of P GPa.
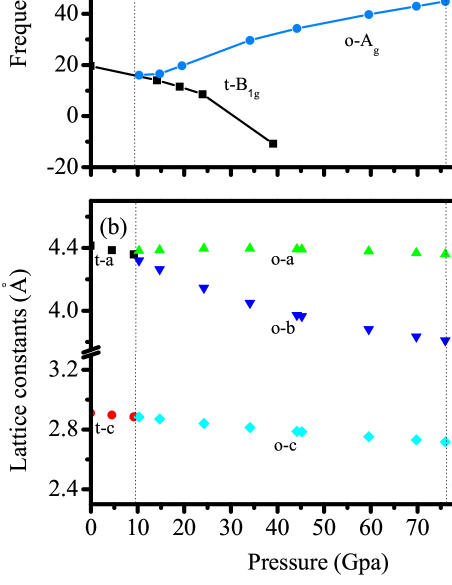
In Fig. 3(a), we plotted the calculated Raman-active phonons of t-CrO2 and o-CrO2 as a function of pressure. There are four Raman modes (B1g, Eg, A1g, B2g) for t-CrO2, and six Raman modes (Ag, B1g, B2g, B3g, Ag, B1g) for o-CrO2.Iliev99 ; Rosenblum97 ; Weber90 Our data are consistent with experimental data up to P Gpa.Maddox06 With increasing the pressure, one can clearly see the softening of B1g mode of t-CrO2, which indicates the structural instability of t-CrO2. One can also notice two transition points. The first one corresponds to the transition from t-CrO2 to o-CrO2 at P=9.8 GPa. At this transition, CrO2 keeps its FM and half-metallic properties.Maddox06 ; Kuznetsov06 ; Srivastava08 . The second one corresponds to the transition at P=76.0 GPa. The stable structure for P has not been identified yet.
The phonon anomalies at two transition points are also revealed in the variation of lattice constants of CrO2 under the pressure. In Fig. 3(b), the lattice constants are plotted as a function of pressure. One can see anomalous behaviors of the lattice constants at the two transition points that are coincident with those in Fig. 3(a).
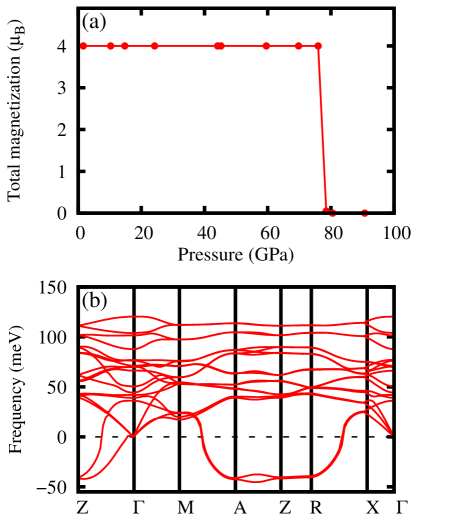
To investigate the second structural transition in more detail, we have examined the behavior of magnetic moment. Srivastava et al.Srivastava08 once reported that there would be a magnetic transition in t-CrO2 from half-metallic to NM at P GPa. However, as discussed above, there occurs a structural transition from t-CrO2 to o-CrO2 at the low pressure of about P=10 GPa. Hence, in Fig. 4(a), we have examined the magnetic moment behavior for o-CrO2. It is seen that there is a FM to NM transition at P=76.0 GPa, which is close to the second structural transition point.
The magnetic moment of o-CrO2 suddenly drops at this transition point. The half-metallic property persists up to this pressure. This magnetic transition was also observed by Kuznetsov et al.Kuznetsov06 , who obtained the transition pressure of P=53 GPa based on the pseudo-potential band method implemented in the VASP code.
It is thus tempting to conjecture that the second transition observed in Fig. 3(a) corresponds to the magnetic transition in o-CrO2. However, the phonon dispersion curve in Fig. 4(b) for NM o-CrO2 at P=80.5 GPa shows the strong phonon softenings, indicating that even NM o-CrO2 is unstable at the pressure of P GPa. Therefore, it is not possible that FM o-CrO2 changes into NM o-CrO2 with increasing the pressure. There might be an additional structural transition in this pressure range.
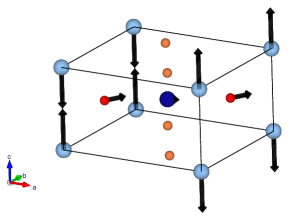
Two candidate structures after the transition are m-CrO2 of MoO2 type and c-CrO2 of CaF2 type. The monoclinic structure of MoO2 type is chosen from the expectation that, with increasing pressure, two electrons of Cr become itinerant, and the local environment becomes similar to that of MoO2. In a similar system VO2, a softening of phonon frequency was observed at q=R (, 0, ), which corresponds to the atomic movements from the tetragonal structure of rutile-type to the monoclinic structure.Gervais85 Indeed, the softening mode at q = R in Fig. 4(b) is related to this structural transition, because the orthorhombic structure of CaCl2 type is nothing but the distorted rutile-type structure. Figure 5 depicts the normal mode of the softened phonon mode at q = R. The displacements generate Cr-Cr dimerization along the c-axis, which is consistent with the main distortions of the transition from the rutile-type to the monoclinic structure. It is thus reasonable to expect the second transition to be from o-CrO2 of CaCl2 type to m-CrO2 of MoO2 type. Concerning another candidate, c-CrO2 of CaF2 type, there were previous reports predicting the structural transitions from CaCl2 type to CaF2 type structure for CrO2Srivastava08 and RuO2.Haines93 Also, CaF2 type is a typical structure of TMO2. For example, ZrO2 and HfO2, which have relatively large cations, crystallize in CaF2 type structure at high temperature. Munoz-Paez94
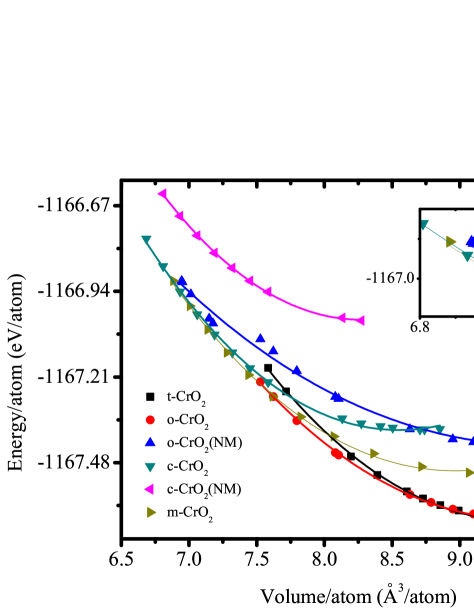
To identify the additional structural transition at the higher pressure, we have compared the total energies of candidate structures in Fig. 6. From the total energy versus volume curves in Fig. 6, one can identify three structural phase transitions. The first one is from FM t-CrO2 to FM o-CrO2 at the estimated pressure of P=12.2 GPa, which is consistent with phonon calculation in Fig. 3. For P 61.1 GPa, NM m-CrO2 becomes the most stable, which corresponds to the second transition from o-CrO2 to m-CrO2, as discussed in the phonon study of Fig. 4. For P 88.8 GPa, c-CrO2, which is a FM insulator, becomes the most stable. The more stable FM and insulating phase than the NM metallic phase of c-CrO2 at this high pressure is extraordinary. The magnetic moment of c-CrO2 amounts to B/Cr, which is close to those in t-CrO2 and o-CrO2. Note, however, that c-CrO2 is an insulator not a half-metal. We have confirmed this result by employing the all-electron full potential linearized augmented plane wave method (FLAPW) band methodFLAPW implemented in WIEN2k package too.wien2k The present result is different from that by Srivastava et al.,Srivastava08 who obtained the stable NM metallic phase of c-CrO2 for P90 GPa. The different result is likely to come from their use of a simple tight-binding LMTO band method.
The transition from m-CrO2 to c-CrO2 is thought to originate from the increasing packing ratio. There are six and eight oxygens around Cr in m-CrO2 and c-CrO2, respectively. Haines et al.Haines93 proposed several possible paths of structural transition from rutile to CaF2 type structure in TMO2. Interestingly, one of the paths is the same as the present structural transition path, rutile-type (P42/mnm) CaCl2-type (Pnnm) MoO2-type (P21/c) CaF2-type (Fmm). But they did not take into account the magnetic state.
IV Conclusion
We have studied the pressure effect on the structural properties of CrO2 by performing the phonon dispersion and total energy band structure calculations. Combining two analysis methods, we have found that there are three structural transitions with increasing pressure up to 100 GPa. The first one is the transition from t-CrO2 of rutile type to o-CrO2 of CaCl2 type at P 10 GPa (9.8 GPa from phonon dispersion analysis, while 12.2 GPa from total energy study). The FM and half-metallic properties of CrO2 are preserved at this transition. The second structural transition is from FM o-CrO2 to NM m-CrO2, which corresponds to the lattice displacement of the phonon softening at R in o-CrO2. The transition pressure is P=76.0 GPa from the phonon dispersion analysis, whereas P=61.1 GPa from the total energy study. The third structural transition is from NM m-CrO2 to FM c-CrO2 at P= 88.8 GPa, which is accompanied by the metal to insulator transition.
Acknowledgements.
This work was supported by the NRF (No.2009-0079947), and the KISTI supercomputing center (No. KSC-2011-C2-36).References
- (1) K. Schwarz, J. Phys. F: Met. Phys. 16, L211 (1986).
- (2) M. A. Korotin, V. I. Anisimov, D. I. Khomskii, and G. A. Sawatzky, Phys. Rev. Lett. 80, 4305 (1998).
- (3) M. Katsnelson, V. Irkhin, L. Chioncel, A. Lichtenstein, and R. de Groot, Rev. Mod. Phys. 80, 315 (2008).
- (4) B. R. Maddox, C. S. Yoo, D. Kasinathan, W. E. Pickett, and R. T. Scalettar, Phys. Rev. B 73, 144111 (2006).
- (5) T. Yu, Z. X. Shen, W. X. Sun, J. Y. Lin, and J. Ding, J. Phys.: Condens. Matter 15, L213 (2003).
- (6) M. N. Iliev, A. P. Litvinchuk, H.-G. Lee, C. W. Chu, A. Barry, and J. M. D. Coey, Phys. Rev. B 60, 33 (1999).
- (7) A. Y. Kuznetsov, J. S. de Almeida, L. Dubrovinsky, R. Ahuja, S. K. Kwon, I. Kantor, A. Kantor, and N. Guignot, J. Appl. Phys. 99, 053909 (2006).
- (8) L. Mattheiss, Phys. Rev. B 13, 2433 (1976).
- (9) R. Pynn, J. Axe, and R. Thomas, Phys. Rev. B 13, 2965 (1976).
- (10) V. Eyert, R. Horny, K. Hock, and S. Horn, J. Phys.: Condens. Matter 12, 4923 (2000).
- (11) V. Eyert, Ann. Phys. (Leipzig) 11, 650 (2002).
- (12) Quantum ESPRESSO (opEn-Source Package for Research in Electronic Structure, Simulation, and Optimization). P. Giannozzi et al., J. Phys.: Condens. Matter 21, 395502 (2009). http://www.quantum-espresso.org.
- (13) We have used the kinetic energy cutoff for wave functions of 400 eV. We have selected k-point samplings such that 888 for t-CrO2 and o-CrO2, 775 for m-CrO2, and 12128 for c-CrO2 in the Monkhorst-Pack grid to set similar k-point density in the Brillouin zone of each structure.
- (14) W. Xue-Wei, N. Dong-Lin, and L. Xiao-Jun, Chinese Phys. Lett. 24, 3509 (2007).
- (15) V. Srivastava, M. Rajagopalan, and S.P. Sanyal, The European Phys. J. B 61, 131 (2008).
- (16) S. S. Rosenblum, W. H. Weber, and B. L. Chamberland, Phys. Rev. B 56, 529 (1997).
- (17) W. H. Weber, G. W. Graham, and J. R. McBride, Phys. Rev. B 42, 10969 (1990).
- (18) F. Gervais and W. Kress, Phys. Rev. B 31, 4809 (1985).
- (19) J. Haines and J. M. Léger, Phys. Rev. B 48, 13344 (1993).
- (20) A. Muñoz-Páez, J. Chem. Edu. 71, 381 (1994).
- (21) B. I. Min, H. J. F. Jansen, and A. J. Freeman, Phys. Rev. B 33, 6383 (1986).
- (22) B. Blaha, K. Schwarz, G. K. H. Madsen, D. Kvasnicka, and J. Luitz, WIEN2K (Technische Universität Wien, Austria, 2001).