The circumnuclear environment of IRAS 205514250:
a case study of AGN/Starburst connection for JWST
Abstract
We present a general review of the current knowledge of IRAS 205514250 and its circumnuclear environment. This Ultraluminous Infrared Galaxy is one of the most puzzling sources of its class in the nearby Universe: the near-IR spectrum is typical of a galaxy experiencing a very intense starburst, but a highly obscured active nucleus is identified beyond 5 m and possibly dominates the mid-IR energy output of the system. At longer wavelengths star formation is again the main driver of the global spectral shape and features. We interpret all the available IR diagnostics in the framework of simultaneous black hole growth and star formation, and discuss the key properties that make this source an ideal laboratory for the forthcoming James Webb Space Telescope.
1 Introduction
Two main physical processes characterize the nuclear regions of active galaxies: intense star formation
at rates of 102–103 M⊙ yr-1 (starburst, SB) and accretion on to a supermassive
black hole (active galactic nucleus, AGN). The issue of SB and AGN connection in both local and distant
galaxies is critical for a proper understanding of galaxy formation and evolution, of star formation
history and metal enrichment of the Universe, and of the origin of the extragalactic background at low
and high energies. There is indeed increasing evidence of a strong link between the starburst and AGN
mechanisms in active systems. The empirical correlation between the mass of black holes (BHs) located at
the centre of nearby galaxies (both active and passive/quiescent) and the mass of their spheroids (see Sani
et al. 2011 [1] and references therein) suggests that the formation of bulges and the growth of the central
BHs are tightly connected. Also the presence of circumnuclear star formation in a substantial fraction of
local AGN (Genzel et al. 1998 [2], Cid Fernandes et al. 2004 [3], Schweitzer et al. 2006 [4], Sani et
al. 2010 [5]) hints at the relation between the two phenomena. The overall conclusion of these studies
is that in 30–50% of the cases the accreting supermassive BHs are associated with young (i.e. of age
less than a few 100 Myr) star-forming regions, with clear evidence of an enhanced star
formation rate (reaching up to starburst intensities) in most AGN. However, this does not necessarily
imply any causal connection between the two physical processes. It could be simply the natural
consequence of massive gas fuelling into the nuclear regions, due to either interactions/mergers or
secular evolution such as bar-driven inflows. Both star formation and nuclear accretion, in fact, are
triggered and subsequently fed by this gas reservoir.
In the local Universe, the optimal targets to study the AGN/SB interplay are the so-called Ultraluminous
Infrared Galaxies (ULIRGs; Sanders & Mirabel 1996 [6]). These sources are the result of major mergers, during
which the redistribution of the gaseous component drives vigorous starburst events and obscured nuclear
accretion. It is now well established that ULIRGs are usually powered by a combination of both processes,
giving rise to their huge luminosities (). However, since
the primary radiation field is reprocessed by dust, the identification of the dominant energy supply is often
unclear. The simultaneous presence of star formation and AGN signatures in the mid-IR makes this a really
favourable band to disentangle the AGN and SB components and explore their environment.
In particular, (i) the available spectra of bona fide starburst-dominated and, respectively,
unobscured AGN-dominated sources are widely different, and show little dispersion within the separate classes
(Risaliti et al. 2006 [7], Brandl et al. 2006 [8]; Netzer et al. 2007 [9], Nardini et al. 2008 [10]).
This allowed us to reproduce the AGN/SB contributions with fixed templates, especially
over the the 3–8 m spectral interval. (ii) For a given bolometric luminosity, the mid-IR AGN emission is higher than that of a starburst
by a factor that rapidly declines with wavelength, ranging from 100 at 3–4 m [7] to 25 at
5–8 m (Nardini et al. 2009 [11]). Such a large difference is due to the key contribution of the hot dust
layers directly exposed to the AGN radiation field. Together with the relatively low dust extinction at these
wavelengths, this allows the detection of an AGN even when it is heavily obscured and/or its total luminosity is
small compared with the SB counterpart. Based on the above points, we successfully fitted the observed ULIRG
spectra with a two-component analytical model, with only two free parameters: the relative AGN/SB contribution
and the optical depth of the screen-like obscuration (if any) affecting the compact AGN component.
To understand whether the link between star formation and nuclear activity is a matter of nature (i.e.
feedback processes) or nurture (i.e. host environments), here we investigate the circumnuclear
structure of IRAS 205514250, an ideal laboratory thanks to its unique physical properties (in terms of both relative
AGN/SB contribution and AGN obscuration), and to the fairly large multiwavelength dataset available.
The paper is organized as follows: in Section 2 we review the present knowledge of the mid-IR properties of
IRAS 205514250. The dust extinction law and gas column density are dealt with in Section 3. A possible general
picture and the feasibility of future observations with James Webb Space Telescope (JWST) are
discussed in Section 4. In Section 5 we summarize our findings and draw the conclusions. Throughout this work we
adopt a standard cosmology ( km/s/Mpc, , ).
2 IRAS 205514250: general properties
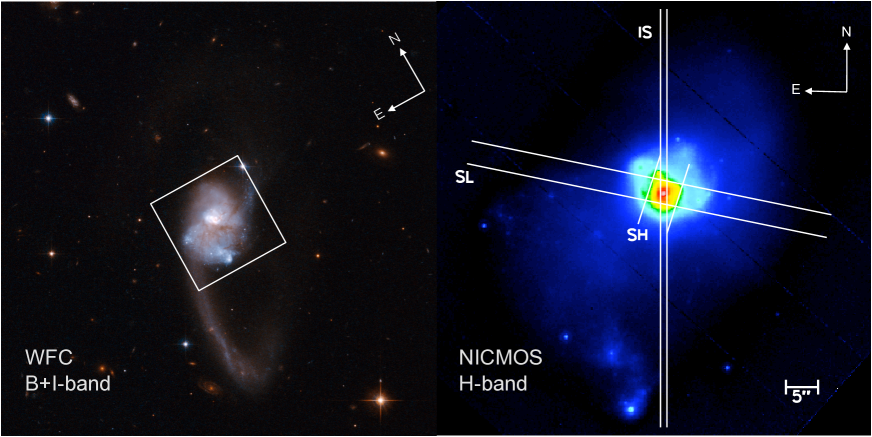
IRAS 205514250 is a nearby () ULIRG lying in the luminosity range of IR quasars, with L erg/s. It mostly lacks of targeted studies, none the less in literature there are several related measurements among the statistical analyses of the local ULIRG population. IRAS 205514250 is a merging system in a fairly advanced state (Fig 1, left panel), characterized by a single nucleus with a prominent tidal tail and a slightly disturbed core, likely caused by a minor merger or strong secular evolution effects. From the high resolution near-IR data Haan et al. (2011) [12] ascribe the large ratio of nuclear excess to bulge luminosity (see also Fig. 1, right panel) to the possible presence of AGN with BH mass . The spectral classification changes significantly with the observed waveband. It is optically classified as a H ii region (Kewley et al. [13]), while in the mid-IR it resembles a SB galaxy [2]. However, diagnostic methods exclusively based on emission lines, as the ones mentioned above, suffer from limited extensibility to faint sources and fail in identifying the heavily absorbed AGN detected in the hard X-rays. Indeed, the hard X-rays emission of IRAS 205514250 is clearly dominated by an obscured AGN, with luminosity erg and column density N cm-2 (Franceschini et al. 2003 [14]). According to all these pieces of observational evidence, the relative AGN contribution to the bolometric luminosity is uncertain, but probably highly significant, while the circumnuclear environment is still poorly characterized. The first quantitative determination of the AGN contribution to the mid-IR emission of IRAS 205514250 was obtained by Farrah et al. (2007, [15]) thanks to a series of effective diagnostics based on fine-structure lines. Their analysis of Spitzer/IRS high-resolution spectra suggests a moderate AGN contribution, even though a peculiar geometry and/or extreme optical depth are responsible for the lack of typical AGN tracers (e.g. [Ne v], [O iv]).
2.1 L- and M-band spectroscopy
Risaliti, Imanishi & Sani [16] obtained L-band observations of ULIRGs with 8-m class telescopes (VLT and
Subaru).
The resulting high-quality spectra have revealed the great power of L-band diagnostics in characterizing AGN and SB components inside ULIRGs.
The main results of these studies are summarized in the following.
(1) A large ( nm) equivalent width (EW) of the 3.3 m polycyclic aromatic hydrocarbon
(PAH) emission feature is typical of SB-dominated sources, while the strong radiation field of an AGN, extending
up to the X-ray domain, partially or completely destroys the PAH carriers.
(2) A strong () absorption feature at 3.4 m due to aliphatic hydrocarbon grains is
an indicator of an obscured AGN; indeed, such a deep absorption requires the presence of a bright, point-like
source behind a screen of dusty gas.
(3) A steep continuum ( when describing the flux density as a power law
) hints at the presence of a highly-obscured AGN. Again, a large value of
implies the strong dust reddening of a compact source.
The L-band spectrum of IRAS 205514250 shows somewhat puzzling properties [7]: a strong 3.3 m emission
feature (EW 90 nm) suggests a dominant starburst contribution.
On the other hand, the steep observed slope () and the detection of the 3.4-m absorption
feature point to the presence of a significant AGN affecting the continuum emission.
Sani and co-authors [17] added the M-band (4–5 m) data to better determine the continuum trend
and analyse the broad CO absorption band near m.
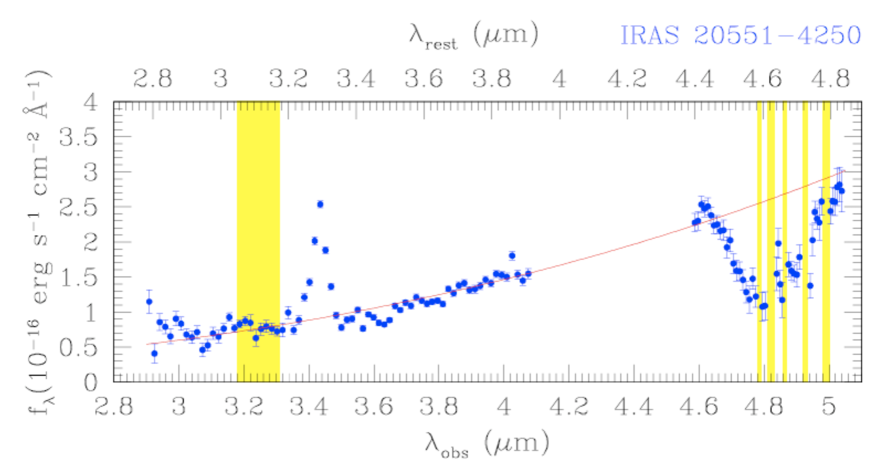
By combining the L- and M-band data (as shown in Fig 2), we estimated a very large AGN contribution at 3.5 m, exceeding 90% once corrected for extinction (see [7] for the analytical details). The observed AGN component, however, is heavily obscured and shows extreme dust reddening. The large optical depth (, assuming the extinction law of Draine 1989 [18]) is necessary to reconcile the apparently contradictory observational results, i.e. the high equivalent width of the 3.3-m PAH feature and the steep, intense continuum. The presence of a dust and gas screen absorbing the AGN emission is also revealed by the deep absorption profiles due to aliphatic hydrocarbons () and gaseous CO (). This step-wise correlation between continuum reddening and absorption features appears to be a general property of ULIRGs hosting an obscured AGN [11,17]. Anyhow, this does not hold under a quantitative point of view: no tight correlation is found among the values of the optical depth, not even between the two absorption features themselves. This suggest a non-uniform dust composition among ULIRGs. The implications on the shape of the extinction law are discussed in the following section.
2.2 Spitzer/IRS spectroscopy
In a series of papers [10,11] we have shown that the high quality of Spitzer-IRS data allows a very effective quantitative determination of the AGN/SB components around 5–8 m;
this method is much more accurate than those possible in other bands in spite of the lower AGN over SB
brightness ratio, which rapidly declines with wavelength.
Summarizing, once applied to large, virtually complete samples of local ULIRGs, the 5–8 m analysis yields
the main results listed below:
(1) The large variations in the observed spectral shape of ULIRGs can be successfully explained in
terms of the relative AGN contribution and its degree of obscuration.
(2) Although the larger fraction of ULIRG bolometric energy output is associated with the intense SB
events, the AGN contribution is non-negligible (25–30%) and increases with both the total IR
luminosity of the host galaxy and, possibly, with the merger stage (Nardini et al. 2010 [19]).
(3) The apparent lack of continuum reddening and the simultaneous detection of deep absorption
troughs in some of the most obscured sources (when a step-wise correlation is generally found, as mentioned
earlier) suggests that the extinction of the AGN component in a ULIRG environment is not universal. Both a
power-law and a quasi-grey behaviour of the optical depth as a function of wavelength are necessary to account
for the emission of different objects and seem to be involved among ULIRGs.

Consistently with the 3–4 m analysis, also the 5-8 m spectrum of IRAS 205514250 (in Figs. 3 and
4) shows remarkable properties:
the AGN continuum can be hardly determined due to strong absorption around 6 and 6.85 m, respectively
attributed to a mixture of ices and hydrogenated amorphous carbons (HAC). The standard spectral decomposition
yields again a very bright but strongly reddened AGN, with a mid-IR intrinsic contribution of 90% and a
6-m optical depth (following the same extinction law introduced before [18]).
Although The starburst dominates the bolometric luminosity, the AGN contribution is significant (263%).
At longer wavelengths ( m), the huge silicate absorption troughs at 9.7 and 18 m require the nuclear source to be deeply embedded in a smooth distribution of dust, both geometrically and
optically thick. Ground-based imaging at 18 m reveals a compact unresolved source ( pc) with high
surface brightness and large Si optical depth (), in agreement with a buried AGN interpretation
(Imanishi et al. 2011 [20]). It is also worth noting that can be combined with the EW of the
6.2-m PAH feature in a diagnostic diagram that provides not only a direct classification, but also possible
indications on the evolutionary path of a source, by probing the age of the SB and the geometrical structure of
the dust (Spoon et al. 2007 [21]). The location of IRAS 205514250 in such a diagram is typical of an intermediate
stage between a fully obscured AGN and an unobscured nuclear starburst.
| Mid-IR emission lines | ||||||||
|---|---|---|---|---|---|---|---|---|
| Line | H2S(3) | H2S(2) | [Ne II] | [Ne III] | H2S(1) | [S III] | H2S(0) | [S III] |
| ( m) | 9.662 | 12.275 | 12.814 | 15.555 | 17.030 | 18.713 | 28.219 | 33.481 |
| Eion(eV) | - | - | 21.6 | 41.0 | - | 23.3 | - | 23.3 |
| Flux ( W/cm2) | 5.360.15 | 3.060.17 | 13.00.4 | 2.60.3 | 6.90.2 | 5.70.6 | 3.80.8 | 8.00.3 |
As mentioned before, in IRAS 205514250 also fine-structure lines from highly-ionized atoms are detected, as well as
H2 pure vibrational transitions (Fig. 3).
Our new measurements of the mid-IR line fluxes are listed in Tab. 1.
Notably, the standard coronal lines produced by the hard AGN photons, such as [Ne v]
(14.3 m) and [O iv] (25.9 m), are not detected
(only upper limits are reported also in [15]); moreover, the [Ne iii]/[Ne ii] line
ratio of 0.2 is well consistent with a SB-dominated radiation field.
As a result, taking into account only mid-IR emission lines would lead to a misclassification of IRAS 205514250 as a
pure SB source. The lack of high-ionization
lines and low [Ne iii]/[Ne ii] ratio can be actually reconciled with the presence of a deeply
obscured AGN by allowing for a peculiar geometry of the gaseous/dusty absorber. Indeed, a large covering factor
of the putative torus predicted by AGN unification models (Antonucci 1993 [22]) can even prevent the formation
of the narrow-line region and the production of high-ionization species. The geometrical properties of the
absorber in a ULIRG is likely much more complicated, and a cocoon-like structure can be reasonably expected.
Also the other standard diagnostic ratio [S iii](18.71)/[S ii](33.48) has
an intermediate value among ULIRGs (0.7), and tends to confirm the latter interpretation.
Four lines from pure rotational transitions of warm H2 are clearly detected (see Fig. 3, Tab. 1
and [15]):
0-0S(3) 9.67 m, 0-0S(2) 12.28 m, 0-0S(1) 17.04 m and 0-0S(0) 28.22 m.
The upper levels of these transitions are populated via UV pumping, formation of H2 in excited states or collisional
excitation; therefore these lines directly probe the warm component of the molecular gas.
A standard ortho-to-para ratio of 3 is found for gas with typical temperature T K.
The heating mechanisms can be associated to either the SB [e.g. in photo-dissociation regions (PDRs),
shocks/outflows in supernova remnants (SNRs)] or the AGN (due to the X-ray heating). From the line ratios and
excitation temperatures measured among ULIRGs (including IRAS 205514250) Higdon et al. 2006 [23] ascribed the warm H2 component to PDRs associated with massive SB. A more detailed investigation of the physical parameters of the
H2 gas is presented in Section 3.2.
3 The circumnuclear medium
The combined analysis of 3–8 m data gives the immediate advantage to trace the co-existing AGN and SB environments. Indeed, after the review of all the mid-IR spectral properties the presence of a heavily absorbed AGN combined with a vigorous SB in IRAS 205514250 is well established. None the less, a comprehensive interpretation of all the observables (AGN hot-dust emission, continuum reddening, absorption features, PAH strength) is not straightforward. The general picture is complicated by the different spatial extent of the nuclear region that has been explored in the works mentioned above. In fact, there can be some aperture effects related to the slit widths, as the nuclear emission is quite diffuse and has a large surface brightness. The slit widths and orientations of the main instruments considered in this work are shown in the right panel of Fig. 1. IRAS 205514250 presents a very small fraction (%) of extended emission in the 13.2-m continuum, which can be mainly associated with the compact, unresolved hot/warm dust component in proximity of the AGN (Díaz-Santos et al. 2010 [24]). Conversely, the extra-nuclear emission is substantial for both the 7.7-m PAH feature and the [Ne ii] line at 12.8 m (40 and 25% respectively; Díaz-Santos et al. 2011 [25]), which are obviously related to the circumnuclear SB. Here, in order to further investigate the physical conditions responsible for reddening/absorption we try (i) to fit simultaneously the L-band and 5–8 m data, and (ii) to measure the column density of the circumnuclear gas for both the atomic and molecular components.
3.1 The extinction law
Fig. 4 shows the observed spectrum of IRAS 205514250 between 3 and 8 m once the ground-based VLT data are combined with the first part of the Short-Low Spitzer/IRS orders. We did not apply any cross scaling factor, since it would be a very complex task and we are confident about the reliability of the absolute flux calibrations, which are affected only by small relative errors (10%; [7,11,17]).
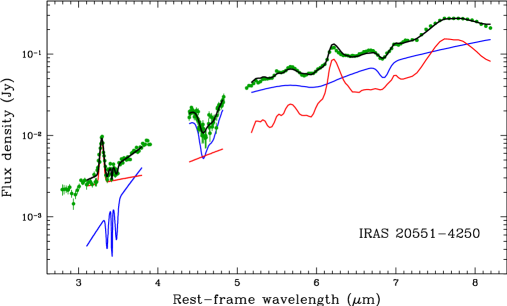
From a visual inspection of the three spectra it is clear that the observed continuum slope, which is
expected to be heavily shaped by the AGN contribution, cannot be reproduced with a single spectral index
over the whole range under investigation. In our separate L-band and 5–8 m studies we have assumed
an intrinsic slope of for the AGN hot-dust continuum, and then applied a power-law extinction of
the form [18]. This screen-like absorption is
possibly due to colder dust in the outer layers of the putative torus, or it might be associated with
some star-formation region in the circumnuclear environment of the host galaxy. It is now evident that
the latter assumptions do not allow us to reproduce simultaneously the AGN emission for the different
data-sets. In fact, by extending the best-fitting AGN model from the L-band to longer wavelengths we
largely overestimate the 8-m observed flux. Of course, it is possible that the intrinsic
AGN spectrum is more complex than the one adopted in our spectral decomposition. A more detailed
analysis should allow for different dust components with individual temperature and emissivity, and
also radiative transfer effects need to be taken into account. However, a broken power-law trend
seems to describe with fairly good precision the observed spectral curvature. Interestingly, we can
try to obtain some empirical (a posteriori) indication about the extinction suffered by the AGN
hot-dust emission. Virtually all the available extinction curves in this wavelength range, in fact, are derived
from lines of sight within our own Galaxy, while the composition of the interstellar medium (ISM) in active
galaxies is expected to be very different, as proved e.g. by the dust-to-gas ratios estimated through
a comparison between the mid-IR dust obscuration and the gas column density in the X-rays of these
objects (Maiolino et al. 2001 [26]; Nardini & Risaliti 2011 [27]).
We have therefore fitted all the three bands allowing for different slopes of the observed AGN continuum.
The M-band is clearly
poorly constrained and the value of is frozen to give a smooth connection among the spectral intervals
for both the AGN and SB templates. We have then computed the trend of the extinction law by making
the easiest assumption about the intrinsic shape of the hot-dust emission, i.e. the simple
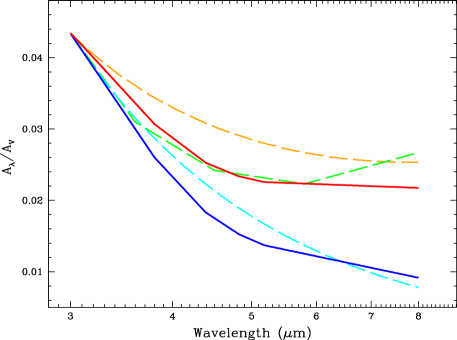
power-law dependence of the flux density from wavelength. Fig. 5 shows the comparison
between two possible extinction laws,
corresponding to different values of the intrinsic , and three standard Galactic curves.
Although no conclusive indication can be drawn, the similarity is quite remarkable, and suggests
that the dust extinction law and the AGN intrinsic continuum are partially degenerate. This anyway
does not affect the quantitative results of our analysis, as the AGN and SB 6 m to bolometric corrections
are averaged over large samples and this systematic effect is greatly reduced (see also the discussion on
the AGN template and dust extinction in [11]).
| Extinction estimates | |||||
|---|---|---|---|---|---|
| Band | NH | expected AV | |||
| cm-2 | mag | ||||
| 3 m [9] | 8 | 220 | |||
| 6 m [15] | 1.2 | 110 | |||
| 3.4 m [9] | 1.5 | 450 | |||
| 2-10 keV [11] | 420 | ||||
3.2 Gas and dust content
To further constrain the absorbing/emitting medium in IRAS 205514250, we attempted at estimating the gas column density by means of a multi-wavelength approach. We start by assuming a Galactic gas-to-dust ratio [31],
| (1) |
with and . We then employ the following estimates:
(a) the column density of the gas absorbing the X-ray radiation directly measured in the 2–10 keV
energy range [14]; (b) the L-band and 6 m optical depth assessed through the continuum
reddening in our decomposition method [11]; (c) the optical depth of the 3.4 m hydrocarbon
feature [7]. The corresponding visual extinction values are listed in Tab. 2.
From a comparison among these independent predictions, we can draw four main considerations.
(1) Independently from the adopted proxy, we infer a huge extinction in the visual band, which
naturally explains the optical misclassification of IRAS 205514250.
(2) As discussed in the previous section, a flatter extinction law over the 3–8 m range with
respect to a steep power-law trend [18] seems to be more appropriate to reproduce the observed AGN emission.
Otherwise, the values of derived from the 3-m and 6-m reddening differ by a factor of two.
(3) By using the depth of the hydrocarbon feature to de-absorb the continuum, following the
Galactic relation (Pendleton et al. 1994 [32]), the resulting AGN intrinsic luminosity
would exceed the source bolometric emission. The abundance of hydrocarbons dust grains is therefore higher in
IRAS 205514250 than in the Galactic ISM.
(4) The X-ray column density corresponds to an at least a factor of two larger than that
expected from our mid-IR modelling (). Irrespectively of the actual dust extinction law, any
reasonable value of the mid-IR optical depth implies a lower dust-to-gas ratio than in the Milky Way ISM.
As a ULIRG is by definition a dust-rich system, this apparent inconsistency can be explained in two ways, which
are in part complementary: (i) due to orientation effects, our line of sight pierces through the regions
of highest column density in the circumnuclear absorber. (ii) There is little coupling between the dust
and gas components because the bulk of X-ray absorption occurs close to the central engine, in a region
comparable in size with the dust sublimation radius.
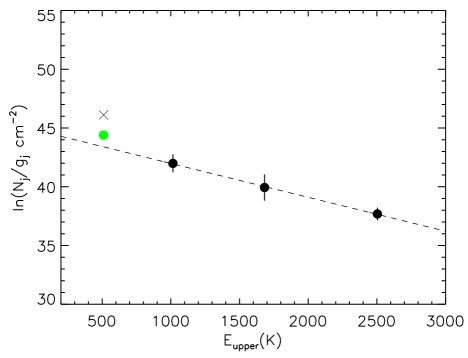
Another line of investigation into the physical properties of the circumnuclear medium relies on the rotation diagram of the warm molecular hydrogen, from which we can derive the temperature, column density and mass of the gas. To this purpose, the observed fluxes listed in Tab. 1 are converted into column densities of the th state () assuming the LTE regime, an ortho-to-para ratio of 3, a point-like source, and no extinction [23] (see also Veilleux et al. 2009 [33]). While Higdon and collaborators [23] construct the rotation diagram for IRAS 205514250 using only the H2 S(1) and S(3) transitions detected in the low-resolution mode, here we make use of high-resolution detections and add the S(0) and S(2) lines. In this way, the parameters derived from the linear fitting in Fig. 6 are more reliable and accurate. Clearly a single temperature model applies to the S(1), S(2) and S(3) transitions, with the excitation temperature () given by minus the reciprocal of the slope, while the total H2 column density (N) depends from the fit normalization and the partition functions of the populations. We thus obtain K, cm-2 and a corresponding H2 mass of .111Uncertainties on and are estimated by re-fitting the data while varying the S(1) and S(3) fluxes within their errors. Our estimate gives a higher temperature () and correspondingly lower gas mass with respect to [23]. The inclusion of the S(0) line require some caution, as it is detected with the IRS-LH slit, much larger () than the SH one () that samples the previous fluxes. For completeness, we plot in Fig. 6 the observed S(0) value as a cross and the value corrected for the relative slit apertures SH/LH as a green point. Including also the corrected S(0) significantly steepens the linear regression and leads to a lower temperature T K, hence doubling the column density and mass. As a matter of fact, a single-temperature component is not suitable to properly reproduce complex systems such as IRAS 205514250, and a multi-temperature model should be adopted [23,33]. Unfortunately the non-detection of higher level transitions [e.g. from S(4) to S(7)], or their blending with PAH features, prevents us from modelling a hot ( K) H2 component. None the less, as an exercise, we can exclude the S(3) point and adopt the corrected S(0) in the linear regression. We now trace a colder H2 component with K, characterized by a huge, likely unphysical222A mass for the molecular hydrogen larger than would correspond to enormous star formation rates, with an IR radiation even greater than IRAS 205514250 bolometric luminosity. gas mass (). We remind that ortho-H2 exists only in states of odd rotational quantum number, while para-H2 is represented only by states of even , therefore the S(1)/S(3) line ratio is independent from the ortho-to-para ratio. The measured S(1)/S(3) is , in agreement with the theoretical value of 1.23 computed for no extinction and K. From this, we conclude that the obscuring material along the line of sight producing the continuum reddening, deep features and X-ray absorption lies in between the AGN and molecular H2 clouds and is possibly associated with the SB region.
4 Discussion
We can now compile all the different aspects of the previous analysis in order to construct a comprehensive
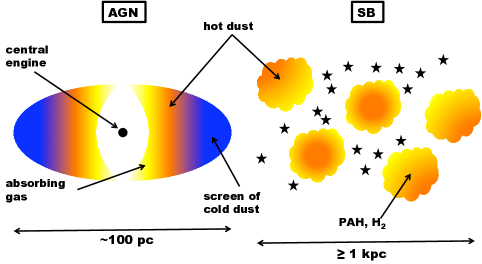
picture of the absorbing/emitting medium in IRAS 205514250. A stratified structure of the circumnuclear material,
involving the different spatial scales (see Fig. 1), can well explain all the observational
evidence. The basic ingredients are summarized as follows: (i) the hot dust component, where the
grains are transiently heated to temperatures close to the sublimation limit, can be associated
with both the inner surface of the AGN torus and the starburst environment; however, due to the different
spatial concentration of the hot dust in the two cases, the resulting nearly power-law continuum is much more
intense for an AGN. (ii) A cold dust component and a large amount of gas are required to produce the
continuum reddening, the deep absorption features (aliphatic hydrocarbon, CO, HAC, silicates), as well as the
X-ray absorption. Consequently, the inferred properties of the circumnuclear absorber point to an optically
thick screen along the line of sight towards a point-like source such as a bright AGN, rather than to a diffuse
dust distribution spatially mixed with the energy source (as in a starburst). Moreover, this dust screen must
be geometrically thick, since a large covering factor would be consistent with the absence of high-ionization
coronal lines (e.g. [Ne v], [O iv]). These properties are typical of the AGN putative torus,
which is located at the spatial scales ranging from a few pc to several tens of pc from the central engine.
The obscuring medium is also expected to be sufficiently close to the central AGN (i.e. with the inner edge of
the torus falling within the dust sublimation radius) to allow for the observed gas over-abundance.
On farther scales (several hundreds to a few thousands pc), molecular clouds are associated with the starburst
event. Here, in addition to warm thermal dust, the PAH grains can survive and give rise to the typical set of
emission features usually employed as SF tracers. Furthermore, with the increasing optical depth within the
individual star-forming clouds, photo-dissociation becomes eventually slow and inefficient, so that hydrogen
also appears in the molecular state. This explains the unextincted H2 pure rotational lines detectd in the
mid-IR. A cartoon of the circmunuclear environment is shown in Fig. 7.
Of course, the qualitative considerations driven by the mid-IR spectral properties are not sufficient to
fully understand the multiple physical conditions characterizing such an extreme source. In order to probe
the nuclear enviroment and its surroundings, a detailed spectral analysis at different wavelengths is needed,
possibly resolving and disentangling the different spatial scale. This would make it possible to address the
problems connected to the uncertain shape of both the intrinsic and the observed AGN continuum, and therefore
to better constrain the actual extinction law. At present, even the joint modelling of the 2–20 m spectral energy distribution (SED) is frustrated by the spread of the signal-to-noise ratio (S/N )and the
relative flux calibration among ground-based and space facilities involved in the observations. The forthcoming
James Webb Space Telescope (JWST) is the ideal instrument to probe the mid-IR SED of local
ULIRGs, offering the opportunity of high-quality data obtained with relatively short exposures. For example,
a high-resolution () observation of IRAS 205514250 with NIRspec (Bagnasco et al. 2007 [35]) centred
at 3.5 m requires only
300 sec of exposure time333We used the exposure time calculator available at
http://jwstetc.stsci.edu/etc/input/nirspec/spectroscopic/ with the following settings: G395H grating plus
F290LP filter, average thermal background and zodiacal light. to reach a S/N per resolution element.
At longer wavelengths, the medium-resolution spectrometer MIRI (Wright et al. 2004 [36]) will ensure similarly
high performances.
Besides the unique settings available (among which integral field unit and multi-shutter array), JWST
will fully cover the 1–25 m range, allowing us to detect and resolve even faint and/or blended
features. In this context, the separation of highly excited rotational levels of the CO band would be
particularly suitable to constrain the dense gas temperature, density and kinematics within the circumnuclear
environment (see e.g. Shirahata et al. [37]).
5 Conclusions and remarks
In the present work we have first reviewed the properties of IRAS 205514250 a prototypical local ULIRG observed by our group in the L- and M-band with ISAAC at the VLT. The spectral analysis also includes the 5–8 m spectrum obtained by Spitzer/IRS. According to the AGN/SB decomposition method we have developed in several previous papers [7,10,17], IRAS 205514250 turns out to be a composite source, dominated in the mid-IR by hot dust emission associated with deeply embedded BH accretion and characterized by a vigorous circumnuclear starburst which provides the main power supply to the whole system. We have then interpreted the key spectral properties of the source over the 3–20 m wavelength range (e.g. the reddening of the continuum, the presence of deep absorption features, the lack of high-ionization coronal lines and the detection of H2 rotational transitions) in the framework of dust and gas spatial distribution and physical conditions. Our main results are the following: (i) the shape of the AGN intrinsic continuum is partly degenerate with the form of the extinction law. This is mainly evident beyond 5 m. (ii) Given the gas amount inferred from X-ray observations, the central regions of IRAS 205514250 seem to have a dust-to-gas ratio much lower than the Galactic interstellar medium. (iii) Aliphatic hydrocarbon and HAC grains are over-abundant with respect to the local molecular clouds. (iv) A large covering of the nuclear engine likely prevents the ionization of the AGN narrow-line region and the excitation of fine-structure lines. Therefore, a screen of cold, dusty gas lies along the line of sight to the AGN, heavily extinguishing its spatially compact primary emission. (v) A large amount () of warm ( K) molecular hydrogen and PAH grains are associated with the starburst environment on typical scales of a few kpc. The findings have been qualitatively interpreted by means of a simple geometrical configuration as the one sketched in Fig. 7. We have finally described the great improvement in terms of sensitivity, spectral coverage and resolution that will be achieved in the near future with the advent of JWST. This will also allow us to separate the different spatial scales and explore in larger detail the connection between the AGN and SB environments and the mutual feedback between the two physical processes.
Acknowledgements
We thank the anonymous referee for the constructive comments and suggestions.
E. Sani is grateful to Dr. F. Fontani for precious discussions on the star forming environment.
This work has made use of the NASA/IPAC extagalactic database (NED).
ES acknowledges financial support from ASI under grant I/009/10/0/.
EN acknowledges financial support from NASA grants NNX11AG99G and GO0-11017X.
References
- Sani et al. (2011) [1] Sani, E., Marconi, A., Hunt, L. K., & Risaliti, G. 2011, MNRAS, 413, 1479
- Genzel et al. (1998) [2] Genzel, R., et al. 1998, ApJ, 498, 579
- Cid Fernandes et al. (2004) [3] Cid Fernandes, R., Gu, Q., Melnick, J., et al. 2004, MNRAS, 355, 273
- Schweitzer et al. (2006) [4] Schweitzer, M., Lutz, D., Sturm, E., et al. 2006, ApJ, 649, 79
- Sani et al. (2010) [5] Sani, E., Lutz, D., Risaliti, G., et al. 2010, MNRAS, 403, 1246
- Sanders & Mirabel (1996) [6] Sanders, D. B., & Mirabel, I. F. 1996, ARA&A, 34, 749
- Risaliti et al. (2006) [7] Risaliti, G., Maiolino, R., Marconi, A., et al. 2006, MNRAS, 365, 303
- Brandl et al. (2006) [8] Brandl, B. R., Bernard-Salas, J., Spoon, H. W. W., et al. 2006, ApJ, 653, 1129
- Netzer et al. (2007) [9] Netzer, H., Lutz, D., Schweitzer, M., et al. 2007, ApJ, 666, 806
- Nardini et al. (2008) [10] Nardini, E., Risaliti, G., Salvati, M., et al. 2008, MNRAS, 385, L130
- Nardini et al. (2009) [11] Nardini, E., Risaliti, G., Salvati, M., et al. 2009, MNRAS, 399, 1373
- Haan et al. (2011) [12] Haan, S., Surace, J. A., Armus, L., et al. 2011, AJ, 141, 100
- Kewley et al. (2001) [13] Kewley, L. J., Heisler, C. A., Dopita, M. A., & Lumsden, S., 2001, ApJS, 132, 37
- Franceschini et al. (2003) [14] Franceschini, A., Braito, V., Persic, M., et al. 2003, MNRAS, 343, 1181
- Farrah et al. (2007) [15] Farrah, D., Bernard-Salas, J., Spoon, H. W. W., et al. 2007, ApJ, 667, 149
- Risaliti et al. (2010) [16] Risaliti, G., Imanishi, M., & Sani, E. 2010, MNRAS, 401, 197
- Sani et al. (2008) [17] Sani, E., Risaliti, G., Salvati, M., et al. 2008, ApJ, 675, 96
- Draine (1989) [18] Draine, B. T. 1989, Infrared Spectroscopy in Astronomy, 290, 93
- Nardini et al. (2010) [19] Nardini, E., Risaliti, G., Watabe, Y., Salvati, M., & Sani, E. 2010, MNRAS, 405, 2505
- Imanishi et al. (2011) [20] Imanishi, M., Imase, K., Oi, N., & Ichikawa, K. 2011, AJ, 141, 156
- Spoon et al. (2007) [21] Spoon, H. W. W., Marshall, J. A., Houck, J. R., et al. 2007, ApJ, 654, L49
- Antonucci (1993) [22] Antonucci, R. 1993, ARA&A, 31, 473
- Higdon et al. (2006) [23] Higdon, S. J. U., Armus, L., Higdon, J. L., Soifer, B. T., & Spoon, H. W. W. 2006, ApJ, 648, 323
- Díaz-Santos et al. (2010) [24] Díaz-Santos, T., Charmandaris, V., Armus, L., et al. 2010, ApJ, 723, 993
- Díaz-Santos et al. (2011) [25] Díaz-Santos, T., Charmandaris, V., Armus, L., et al. 2011, ApJ, 741, 32
- Maiolino et al. (2001) [26] Maiolino, R., Marconi, A., Salvati, M., et al. 2001, A&A, 365, 28
- Nardini & Risaliti (2011) [27] Nardini, E., & Risaliti, G. 2011, MNRAS, 415, 619
- Chiar & Tielens (2006) [28] Chiar, J. E., & Tielens, A. G. G. M. 2006, ApJ, 637, 774
- Nishiyama et al. (2008) [29] Nishiyama, S., Nagata, T., Tamura, M., et al. 2008, ApJ, 680, 1174
- Nishiyama et al. (2009) [30] Nishiyama, S., Tamura, M., Hatano, H., et al. 2009, ApJ, 696, 1407
- Bohlin et al. (1978) [31] Bohlin, R. C., Savage, B. D., & Drake, J. F. 1978, ApJ, 224, 132
- Pendleton et al. (1994) [32] Pendleton, Y. J., Sandford, S. A., Allamandola, L. J., Tielens, A. G. G. M., & Sellgren, K. 1994, ApJ, 437, 683
- Veilleux et al. (2009) [33] Veilleux, S., Rupke, D. S. N., Kim, D.-C., et al. 2009, ApJS, 182, 628
- Nisini et al. (2010) [34] Nisini, B., Giannini, T., Neufeld, D. A., et al. 2010, ApJ, 724, 69
- Bagnasco et al. (2007) [35] Bagnasco, G., Kolm, M., Ferruit, P., et al. 2007, Proc. SPIE, 6692
- Wright et al. (2004) [36] Wright, G. S., Rieke, G. H., Colina, L., et al. 2004, Proc. SPIE, 5487, 653
- Shirahata et al. (2007) [37] Shirahata, M., Nakagawa, T., Goto, M., et al. 2007, The Central Engine of Active Galactic Nuclei, 373, 505