Suzaku X-ray Follow-up Observations of Seven Unassociated Fermi-LAT Gamma-ray Sources at High Galactic Latitudes
Abstract
We report on our second-year campaign of X-ray follow-up observations of unidentified Fermi-LAT -ray sources at high Galactic latitudes () using the X-ray Imaging Spectrometer onboard the Suzaku X-ray Observatory. In this second year of the project, seven new targets were selected from the First Fermi-LAT Catalog, and studied with ks effective Suzaku exposures. We detected an X-ray point source coincident with the position of the recently discovered millisecond pulsar PSR J2302+4442 within the confidence error circle of 1FGL J2302.8+4443. The X-ray spectrum of the detected counterpart was well fit by a blackbody model with temperature of keV, consistent with an origin of the observed X-ray photons from the surface of a rotating magnetized neutron star. For four other targets which were also recently identified with a normal pulsar (1FGL J0106.7+4853) and millisecond pulsars (1FGL J1312.6+0048, J1902.05110, and J2043.2+1709), only upper limits in the keV band were obtained at the flux levels of erg cm-2 s-1. A weak X-ray source was found in the field of 1FGL J1739.4+8717, but its association with the variable -ray emitter could not be confirmed with the available Suzaku data alone. For the remaining Fermi-LAT object 1FGL J1743.87620 no X-ray source was detected within the LAT error ellipse. We briefly discuss the general properties of the observed high Galactic-latitude Fermi-LAT objects by comparing their multiwavelength properties with those of known blazars and millisecond pulsars.
1 Introduction
Since its successful launch in 2008 June, the Large Area Telescope (LAT) onboard the Fermi Gamma-ray Space Telescope (Atwood et al., 2009) has enabled many important breakthroughs in the understanding of the origin of high energy -ray emissions of various classes of astrophysical objects. The number of detected -ray sources increased dramatically, from 271 objects listed in the 3rd EGRET Catalog (3EG; Hartman et al., 1999)111See also Casandjian & Grenier (2008) for the revised catalog of EGRET -ray sources. to 1873 in the Second Fermi-LAT Catalog (2FGL; Abdo et al., 2011). About 800 -ray sources included in 2FGL have been identified as blazars (Ackermann et al., 2011), i.e., jetted active galactic nuclei (AGN) characterized by strong relativistic beaming. Other associations included pulsars (e.g., Abdo et al., 2010a), high-mass X-ray binaries (e.g., Abdo et al., 2009b), radio galaxies (e.g., Abdo et al., 2010g), pulsar wind nebulae (e.g., Abdo et al., 2010e), supernova remnants (e.g., Abdo et al., 2010d), globular clusters (e.g., Abdo et al., 2010j), starburst galaxies (e.g., Abdo et al., 2010c), and distinct objects like the Large Magellanic Cloud (Abdo et al., 2010h). However, no obvious counterparts at longer wavelengths have been found for as much as of Fermi-LAT objects so that several hundreds of GeV sources currently remain unassociated with any known astrophysical systems. Fortunately, an improved localization error for the Fermi-LAT (typical confidence radii , and even for the brightest sources; Abdo et al., 2011), when compared to that of EGRET (typical ), allows for much more effective follow-up studies at radio, optical, and X-ray frequencies, which can help to unravel the nature of the unidentified -ray emitters.
In this context, X-ray follow-up observations of unidentified Fermi-LAT objects are of particular importance, since some classes of astrophysical sources of -rays such as AGN are strong X-ray emitters as well, while the others like most of -ray emitting pulsars are faint X-ray sources. Note that assuming the keV–to–GeV emission continuum in the form of a broad-band power-law (), which could be a relatively good zero-order approximation in the case of blazar sources but not necessarily in the case of other classes of -ray emitters, the monochromatic X-ray flux energy density scales as for a relatively flat spectral index of . Hence, if an X-ray counterpart of a bright Fermi-LAT source is characterized by, e.g., erg cm-2 s-1 and the X-ray–to–-ray power-law emission continuum with the slope , such source can be expected to be detectable with modern X-ray instruments such as Chandra, XMM-Newton, Swift, and Suzaku within reasonable exposure times. In particular, a point source search to the level of erg cm-2 s-1 is easily attainable with the X-ray Imaging Spectrometer (XIS; Koyama et al., 2007) onboard Suzaku (Mitsuda et al., 2007) with relatively short exposures of few tens of ksec (e.g., Akamatsu et al., 2011). In the case of a positive detection, correlated flux changes at X-ray and -ray frequencies provide an identification. The lack of correlated variability, or non-detection of an X-ray counterpart, provide on the other hand only circumstantial evidence regarding the nature of a studied target. Yet in many cases such evidence may be crucial, since the non-detection of an X-ray counterpart despite a long, dedicated observation of a bright Fermi-LAT object may disprove a potential association with given classes of astrophysical sources. That is because, as mentioned above, only a few established high-energy emitters are that bright in -rays but very faint in X-rays (e.g., Geminga pulsar; see the discussion in Thompson, 2004; Matsumoto et al., 2007).
Thus motivated we started a project to investigate the nature of unidentified high Galactic-latitude Fermi-LAT objects through deep X-ray follow-up observations with Suzaku XIS. The results of the first-year campaign conducted over the span of Suzaku AO4 were presented in Maeda et al. (2011). The AO4 program included four steady/weakly variable Fermi-LAT sources from the initial Fermi-LAT Bright Source List (0FGL; Abdo et al., 2009a) and can be summarized as follows. The X-ray counterpart for one of the brightest unassociated Fermi-LAT objects, 1FGL J1231.11410 (also detected by EGRET as 3EG J12341318 and EGR J12311412), was found. The X-ray spectrum of the counterpart was well fit by a blackbody model with a temperature of keV plus an additional power-law component dominating above 2 keV photon energies. This power-law component was confirmed in subsequent Swift and XMM-Newton exposures. Considering a recent identification of 1FGL J1231.11410 with the millisecond pulsar (MSP) PSR J12311411 (Ransom et al., 2011), in Maeda et al. we concluded that the detected thermal X-ray photons originate from the surface of a rotating magnetized neutron star, while the non-thermal X-ray component is most likely produced within the pulsar magnetosphere. In the case of 1FGL J1311.73429, two possibly associated X-ray point sources were discovered, one of which is now excluded from the smaller error ellipse of the GeV emitter as catalogued in the 2FGL (Abdo et al., 2011). The identification of the remaining X-ray counterparts with the respective -ray objects remain uncertain despite a robust determination of the the spectral and variability properties of the X-ray sources. In the case of 1FGL J1333.2+5056, we found several weak X-ray sources within the Fermi-LAT error circle, and speculated on the AGN nature of the target. Finally, one X-ray point source was detected at the edge of the error ellipse of 1FGL J2017.3+0603. The physical connection was however viewed as unlikely, since the X-ray source did not coincide with the location of the MSP PSR J2017+0603 discovered by the Nançay radio telescope which constituted a more highly probable association with the Fermi-LAT object (Cognard et al., 2011). The MSP identification was later indeed confirmed by the detection of the pulsed emission in the Fermi-LAT data, with the same period as the radio pulsations.
In this paper, we report the results of our second-year campaign, conducted over the span of Suzaku AO5 (2010 April to 2011 March) which included observations of seven Fermi-LAT sources located at high Galactic latitudes (). The targets were selected from the First Fermi-LAT Catalog of point sources (1FGL; Abdo et al., 2010b) as objects unidentified at the time of writing of the Suzaku AO5 proposal. Since then however, four of the selected targets have been associated with MSPs: 1FGL J1902.05110 with PSR J19025105 (Camilo et al., 2011), 1FGL J2043.2+1709 with PSR J2043+1711 (Guillemot et al., 2011), 1FGL J2302.8+4443 with PSR J2302+4442 (Cognard et al., 2011), and 1FGL J1312.6+0048 with PSR J1312+00 (Abdo et al., 2011). And moreover, 1FGL J0106.7+4853 have very recently been associated with a normal pulsar PSR J0106+4855 (Pletsch et al., 2011). The XMM-Newton and Swift satellites detected the weak X-ray counterpart of the MSP in 1FGL J2302.8+4443 (Cognard et al., 2011). In the following, our new Suzaku observations and data reduction procedure are described in section 2. The analysis results are given in section 3, and discussed further in section 4 in the context of multiwavelength studies of unidentified Fermi-LAT objects.
2 Suzaku Observations and Data Analysis
2.1 Observations and Data Reduction
We observed seven unidentified Fermi-LAT sources with the Suzaku XIS. These seven targets were chosen from the 1FGL catalog according to the following selection criteria: (i) no association claimed at the time of the submission of the Suzaku proposal, (ii) sources located more than away from the Galactic plane, and (iii) the detection significance in the LAT -ray band ( MeV) exceeding in the 1FGL catalog. The thus selected targets are listed in Table 1 together with the corresponding Suzaku observation logs and the 1FGL -ray fluxes and photon indices.
The observations were conducted with three XIS detector and the Hard X-ray Detector (HXD; Kokubun et al., 2007; Takahashi et al., 2007). The XIS detector is composed of four CCD cameras. One of the four CCD cameras (XIS1) is back-illuminated CCD and the others (XIS0, XIS2, and XIS3) are front-illuminated CCDs. The operation of XIS2 ceased in 2006 November because of the contamination by a leaked charge. Since none of the studied sources have been detected with the HXD, below we describe the analysis of only the XIS data. The XIS was operated in pointing mode and the normal clocking mode, combined with the two editing modes and for five targets, and only one editing mode for 1FGL J2302.8+4443 and 1FGL J1312.6+0048 because of the telemetry limit.
We conducted all the data reduction and analysis with HEADAS software version 6.9 and the calibration database (CALDB) released on 2010 July 30. First, we combined the cleaned event data of the two editing modes using xselect. Then we removed the data corresponding to the epoch of low-Earth elevation angles (less than ), as well periods (and 60 sec after) when the Suzaku satellite was passing through the South Atlantic Anomaly (SAA). Moreover, we also excluded the data obtained when the Suzaku satellite was passing through the low Cut-Off Rigidity (COR) of below 6 GV. Finally we removed hot and flickering pixels using sisclean (Day et al., 1998).
2.2 Data Analysis
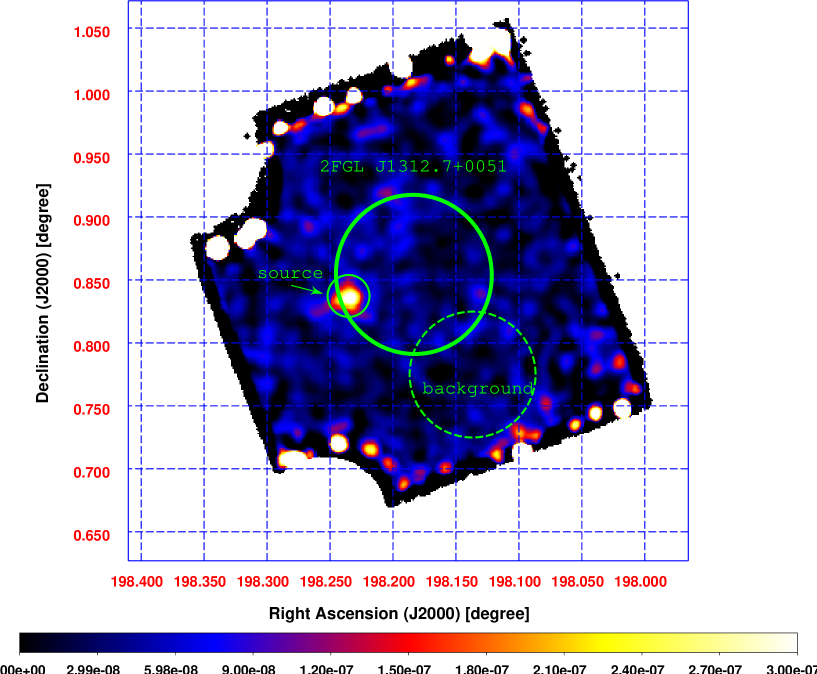
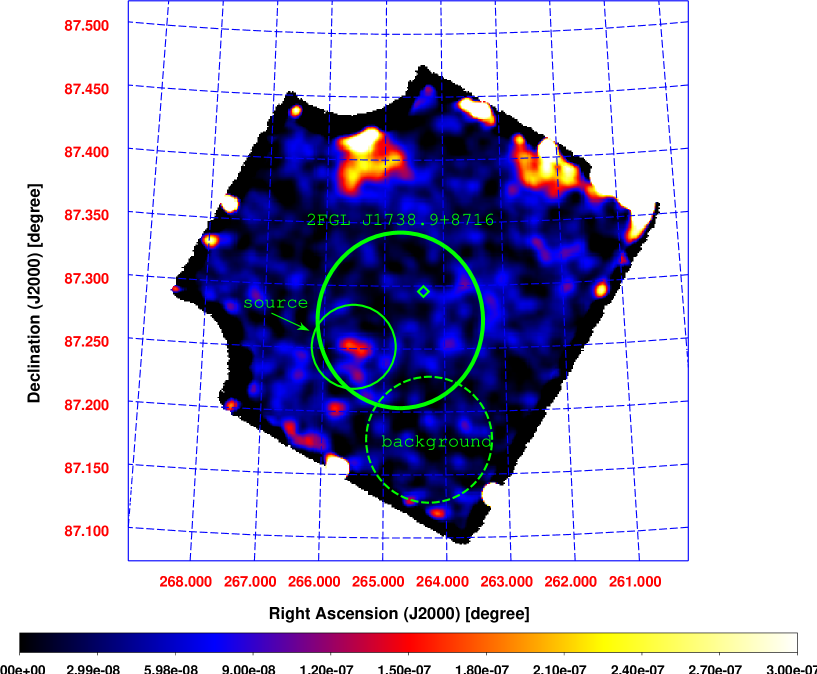
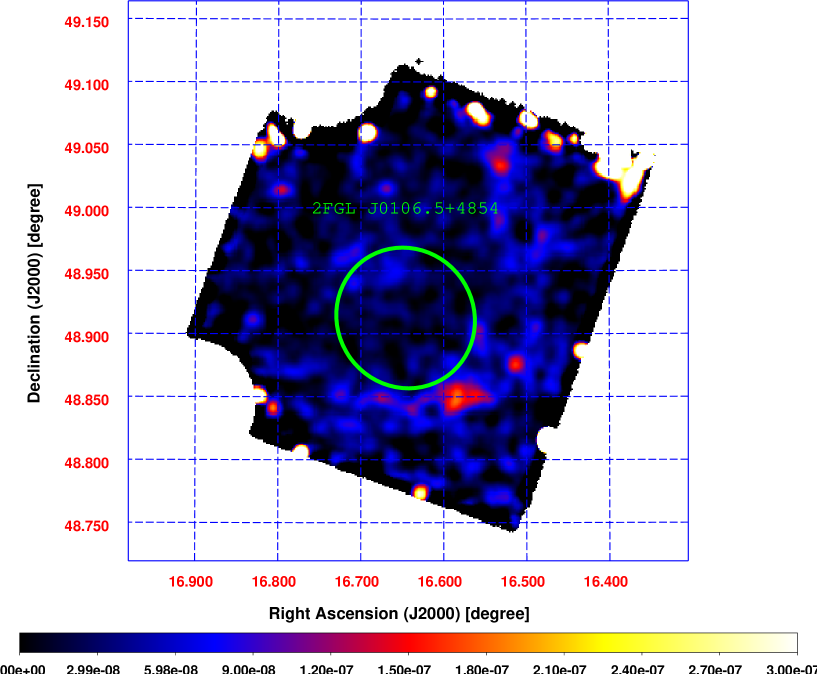
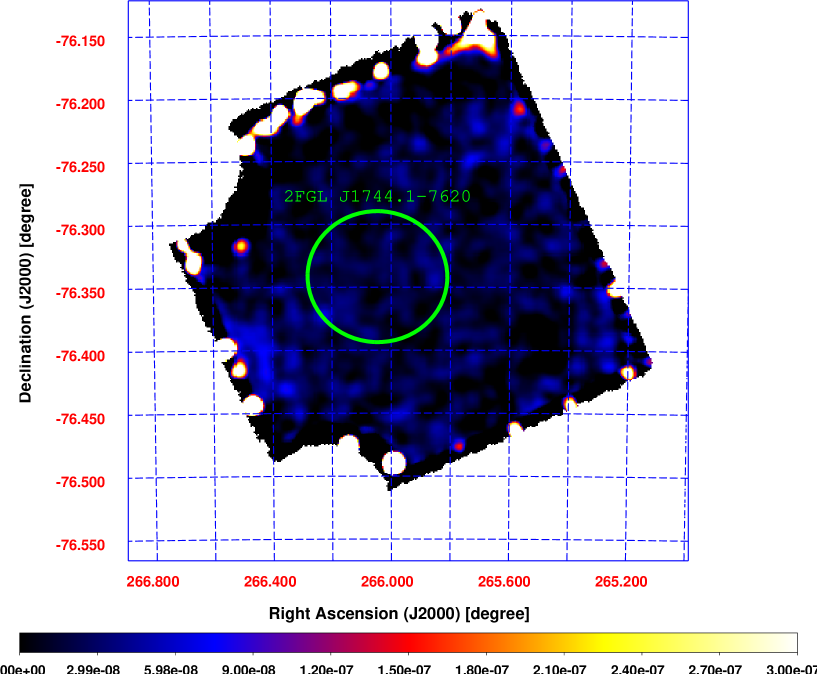
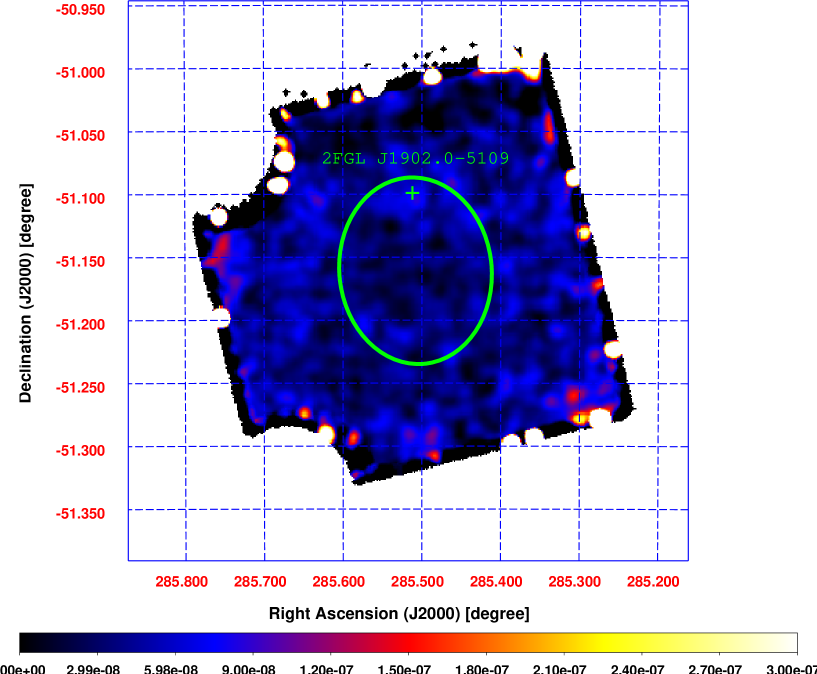
X-ray images of each target were extracted from the two operating front-illuminated CCDs (XIS0 and XIS3). In the image correction procedure we applied a ‘non X-ray background’ subtraction, an exposure correction, and a vignetting correction (for details see Maeda et al., 2011). We then combined the images from both CCDs and smoothed the thus obtained final maps using a Gaussian function with . The resulting images are presented and discussed in the next section 3. Although all the -ray targets were initially selected from the 1FGL catalog, in all the corresponding figures, thick green ellipses denote the more precise position errors from the 2FGL catalog (Abdo et al., 2011) as described in section 2.1.
For the further analysis, we selected source regions around each detected X-ray source within the 2FGL error ellipses. The radii of the source extraction regions, denoted in the figures below by thin green circles, were set as , unless otherwise stated. The corresponding background regions with radii of were taken from the low count rate area in the same XIS chips (dashed green circles). We set the detection threshold for X-ray sources at , based on the signal-to-noise ratio defined as a ratio of the excess events above a background to its standard deviation assuming a Poisson distribution. The X-ray source positions and the corresponding errors were estimated by 2D Gaussian fits, as summarized in Table 2.
For the timing analysis, light curves from the front-illuminated (XIS0, XIS3) and back-illuminated (XIS1) CCDs were combined; the corresponding backgrounds were subtracted using lcmath. The light curves constructed in this way provide the net-count rates. To quantify possible flux variations, the test was applied to each light curve using lcstats. For the X-ray spectral analysis, we generated the RMF files for the detector response and the ARF files for the effective area using xisrmfgen and xissimarfgen (Ishisaki et al., 2007). In order to improve the statistics, we added X-ray counts from the two front-illuminated CCDs, using mathpha with no error propagation so that the resulting data follow a Poisson distribution, and then combined the response files using the marfrmf and addrmf commands. In the case of the -ray targets with no detected X-ray counterparts within the 2FGL error ellipses, we calculated confidence level flux upper limits at the positions of the -ray emitters assuming an absorbed power-law model. Uncertainties of the model spectral parameters are computed at the confidence levels. The results of the spectral fitting are summarized in Table 3, and discussed below in more detail.
3 Results
In this section, we first present the results of the new Suzaku observations in the order of R.A. for the sources for which we detected X-ray counterparts, followed by the analysis results of the remaining targets with no detected X-ray counterparts. All seven targets have also recently been observed by Swift, and below we briefly compare the results of the Suzaku and Swift observations. We search for radio, infrared and optical counterparts for all the detected X-ray sources using the NRAO VLA Sky Survey (NVSS) catalog (Condon et al., 1998), the Two Micron All Sky Survey (2MASS) point source catalog (Skrutskie et al., 2006), and the USNO-B1.0 catalog (Monet et al., 2003).
3.1 1FGL J1312.6+0048
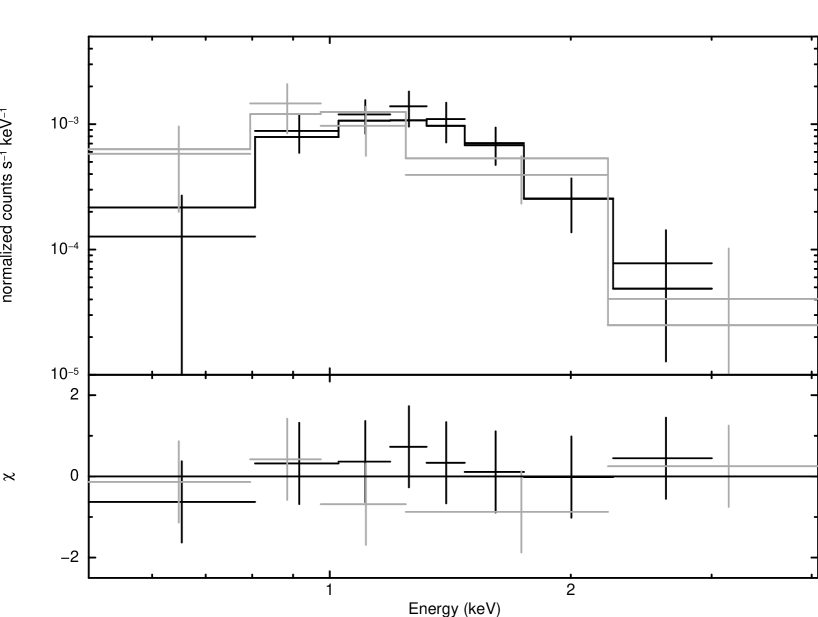
We discovered one X-ray point source inside the 2FGL error ellipse of 1FGL J1312.6+0048, at [RA, Dec]=[198∘.235(2), 0∘.835(2)], designated hereafter as Suzaku J1312+0050, with a detection significance of (total of 178 net source counts from three detectors). This X-ray source has recently been detected also by Swift X-ray Telescope (XRT; Burrows et al., 2005) at [RA, Dec] = [265.4229, 0.8348] with 90% position error radius r90% = 6′′.8. Since the position accuracy of Swift XRT222See Swift Technical Handbook (http://heasarc.nasa.gov/docs/swift/proposals/appendix_f.html) ( 5′′) is better than that of Suzaku XIS ( 19′′; Uchiyama et al., 2008), we searched for optical and radio counterparts of the X-ray source using the Swift position. We found one possibly related optical emitter USNOB 0908-0218088 at about 5′′away from the X-ray source ([RA, Dec] = [198.241972(7), 0.83448(5)], and magnitudes B2 = 19.80, R2 = 19.32, and I = 18.11), while no radio and infrared counterparts were discovered.
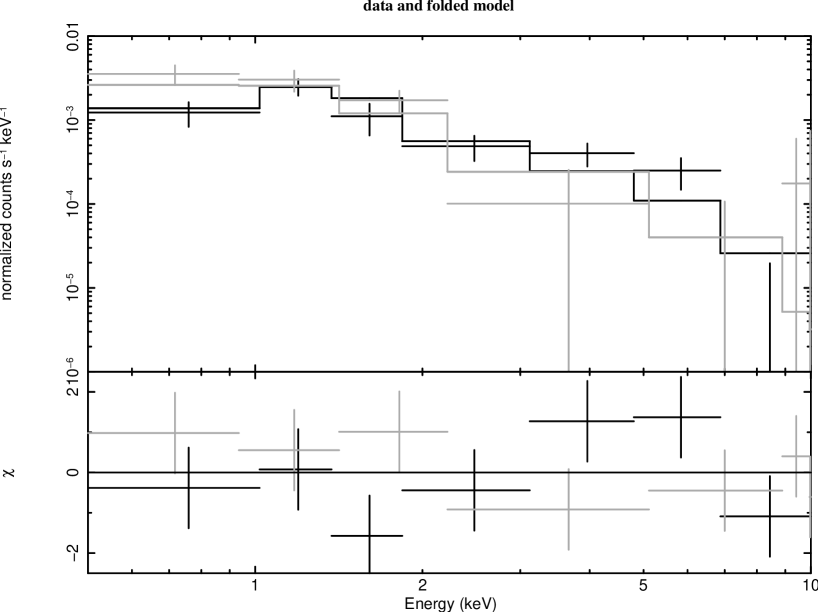
The light curve of Suzaku J1312+0050 with a time bin of 5774 s and its spectrum are presented in Figures 2 and 3, respectively. The X-ray spectrum when fitted with an absorbed power-law model returned negligible hydrogen column density. We therefore fixed and repeated a power-law fit obtaining the photon index of with /d.o.f.=9.9/13. The derived energy flux in the keV photon energy range is erg cm-2 s-1. To test for flux variability, we performed a fit with a constant count rate of ct s-1 resulting in /d.o.f. = 14.5/7. This indicates that the X-ray source is variable on the timescale of a few hours, with a probability of .
The targeted -ray object has recently been associated with the MSP PSR J1312+00 (Abdo et al., 2011). Unfortunately, the position of the radio pulsar is still not available publicly, and hence at this moment we cannot claim nor reject the coincidence of PSR J1312+00 with the detected X-ray source. The variability revealed by the Suzaku data, along with the presence of an optical counterpart, implies however that the detected X-ray source is not likely associated with the MSP PSR J1312+00. For this reason we have evaluated the confidence upper limit to the keV and keV fluxes at a random position within the 2FGL error ellipse of 1FGL J1312.6+0048 (excluding Suzaku J1312+0050), which should correspond (at least roughly) to the upper limits for the X-ray emission of PSR J1312+00. Assuming an absorbed power-law model with = 2.1 (this value is taken from the LAB Survey of Galactic HI; Kalberla et al., 2005) and photon index , these read as erg cm-2 s-1 ( keV) and erg cm-2 s-1 ( keV), respectively. The implied ratio of the GeV and keV fluxes 211 would be then in agreement with the pulsar association of 1FGL J1312.6+0048 (see Marelli et al., 2011).
3.2 1FGL J1739.4+8717
We detected one X-ray source within the 2FGL error ellipse of 1FGL J1739.4+8717 (designated as Suzaku J1742+8715). The detection significance is 7 (total of 204 net source counts from three detectors). The XIS image of Suzaku J1742+8715 seems to be relatively diffuse. However, Swift XRT has detected recently the same X-ray emitter as a point source at [RA, Dec] = [265.430, 87.245] with 90% position error radius r90% = 6′′.9. Hence we conclude that in a relatively short Suzaku exposure (16.7 ksec) the apparently diffuse structure of the object is just an artifact of a low photon statistics. We found several weak optical sources coinciding positionally with the X-ray source, but no radio counterpart.
We extracted the source photons from a radius circle around Suzaku J1742+8715 and the background photons from a radius circle. The resulting X-ray spectrum and X-ray light curve with the time bin of 5760 s are shown in Figures 5 and 6, respectively. A constant fit to the light curve of the X-ray source returned /d.o.f. = 1.9/6, indicating that the flux was steady during the Suzaku exposure with the probability of . The spectrum was initially fitted by an absorbed power-law model (/d.o.f. = 11.4/12) and this model returned = 0. We then refit the spectrum after fixing the value to zero and obtained a photon index of and the unabsorbed keV flux erg cm-2 s-1.
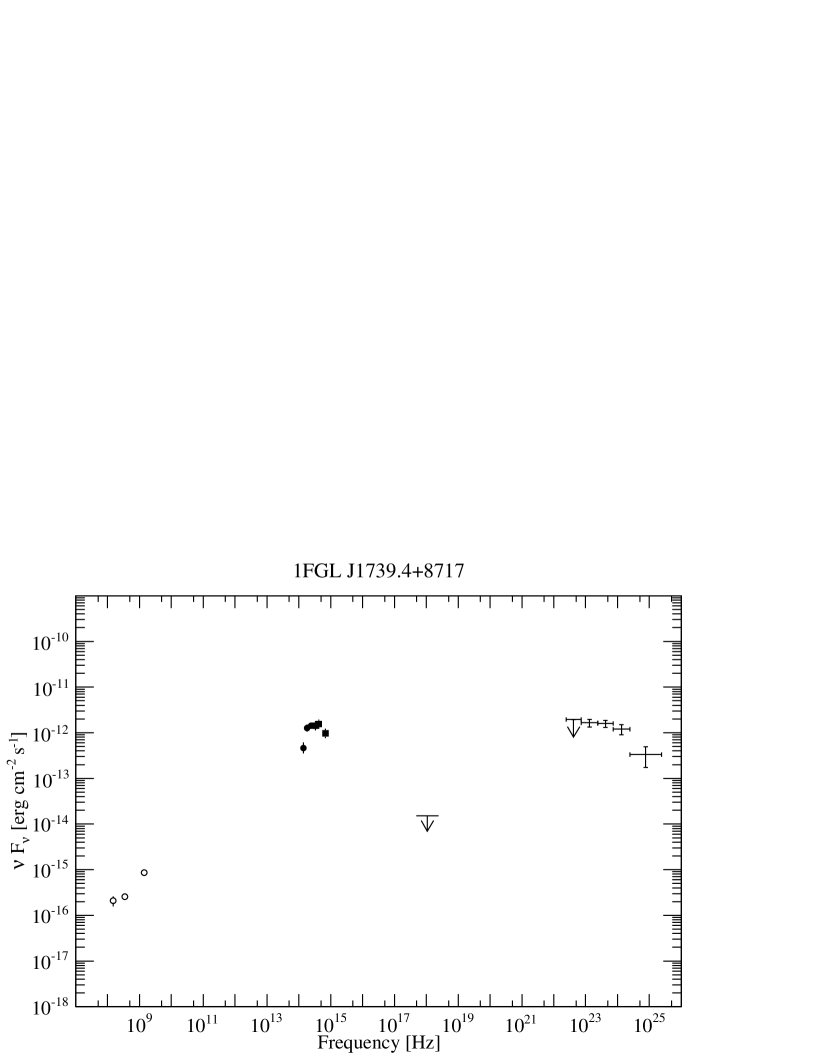
We found one relatively bright radio source inside the 2FGL error region of 1FGL J1739.4+8717, namely NVSS J173722+871744 ( mJy at 1.4 GHz). Its position is marked with a green rhombus in Figure 4. This radio source is detected at several frequencies (151 MHz and 325 MHz; see Baldwin et al., 1985; Rengelink et al., 1997, respectively), but has no obvious X-ray counterpart in our Suzaku data. Assuming a power-law form of the radio continuum (), we calculate the spectral index of NVSS J173722+871744 as 0.1 from the archival data. This is, in fact, a typical radio spectral index for blazar sources (e.g., Sowards-Emmerd et al., 2005). Moreover, we also found an optical and infrared counterpart, USNOB 1772-0020476 ([RA, Dec] = [264.35499(2), 87.29532(2)]), which is located only 2′′.2 away from the NVSS source with optical magnitudes, B2 = 19.30, R2 = 17.61, and I = 17.07, and 2MASS J17372480+8717433 ([RA, Dec] = [264.3533(1), 87.2953(1)], and magnitudes J = 16.2, H = 15.5, and K = 15.8). This allowed us to calculate radio-to-optical and optical-to-X-ray spectral indices as 0.01 and , with the latter utilizing the X-ray flux upper limit (see Figure 16). These indices are consistent with those of so-called intermediate synchrotron peaked blazars (see Fig. 7 in Ackermann et al., 2011).
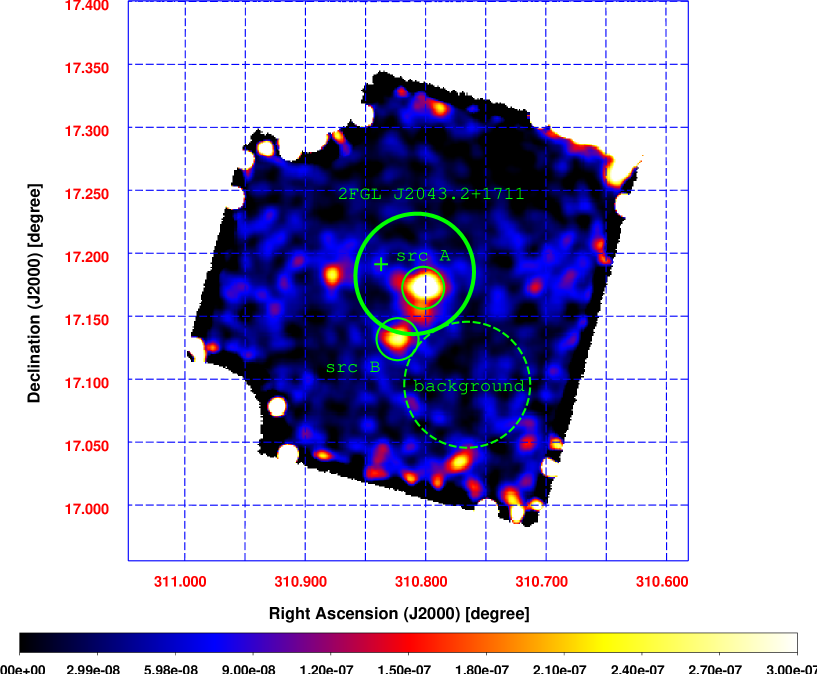
3.3 1FGL J2043.2+1709
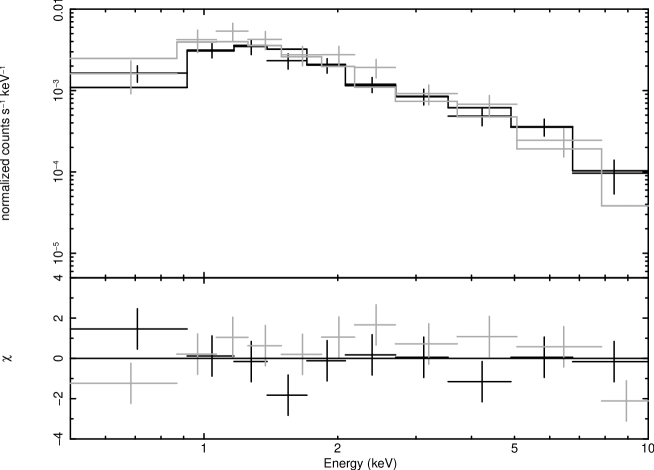
We found one X-ray point source within the 2FGL error ellipse of 1FGL J2043.2+1709 at the respective position [RA, Dec]=[310∘.801(2), 17∘.171(2)], designated as Suzaku J2043+1710, and a second source located on the edge of the ellipse at [RA, Dec]=[310∘.822(3), 17∘.133(3)], designated as Suzaku J2043+1707 (hereafter srcA and srcB for short, respectively). These two X-ray objects are not recorded in any available X-ray source catalogs. Swift XRT has also detected the same two X-ray emitters. Moreover, Swift Ultraviolet/Optical Telescope (UVOT; Roming et al., 2005) discovered a possible UV counterpart of srcA at [RA, Dec] = [310.80314(6), 17.17286(7)], for which we found an association with the optical source USNOB 1071-0645302 ([RA, Dec] = [310.80315(7), 17.17300(4)], and magnitudes B2 = 19.89, R2 = 20.6). No radio and infrared counterparts for srcA or srcB were found. The X-ray image of the targeted field is shown in Figure 7. The radio position of the MSP PSR J2043+1711 recently associated with the 1FGL J2043.2+1709 is marked in the figure with a green cross centered at [RA,Dec]=[310∘.8370129(2), 17∘.1913744(3)].
To extract the spectra and light curves of the detected X-ray sources, we set the source regions and the background region as indicated in Figure 7. The detection significances of both sources were calculated to be (total of 397 net source counts from three detectors) and (total of 155 net source counts from three detectors), respectively. No X-ray counterpart of PSR J2043+1711 was detected in our Suzaku exposure. The light curves of srcA and srcB with time bins of 5760 s are given in Figure 8, and the corresponding spectra are presented in Figure 9. Both light curves can be well fit by constant count rates (/d.o.f. = 8.5/9 and /d.o.f. = 2.6/9 for srcA and srcB, respectively).
An absorbed power-law model provided the best fit to the spectrum of srcA, returning the photon index and /d.o.f = 20.419. In the fit, the value of was frozen at the Galactic value in the direction of the target taken from the LAB Survey of Galactic HI, i.e., cm-2 (Kalberla et al., 2005). We note that the fit with the absorption column density set free returned the value for consistent with the Galactic one. The derived unabsorbed X-ray flux of srcA in the keV photon energy range is erg cm-2 s-1. Similarly, the X-ray spectrum of srcB was initially fitted with an absorbed power-law model. However, this model fit returned negligible value of and therefore we fixed = 0. The best fit model with /d.o.f. = 8.6/10 returned then the photon index and the unabsorbed keV flux erg cm-2 s-1.
Assuming a power-law model with photon index , we calculated upper limits ( confidence) in the keV and keV bands at the position of PSR J2043+1711 as erg cm-2 s-1 and erg cm-2 s-1, respectively. This gives the ratio of the GeV and keV fluxes 864 which is consistent with the values claimed for the GeV-detected MSP (Marelli et al., 2011).
3.4 1FGL J2302.8+4443
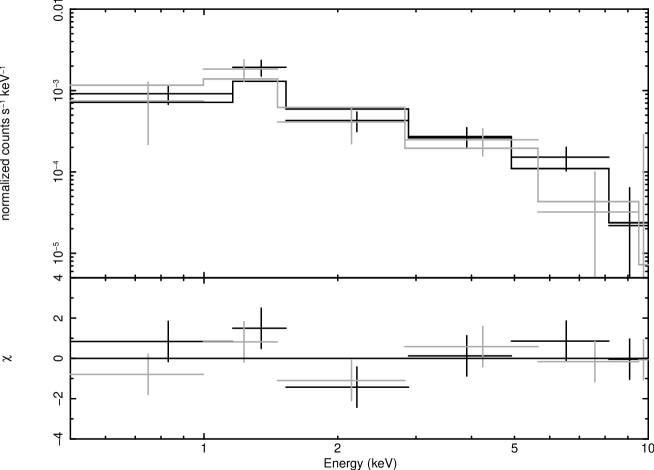
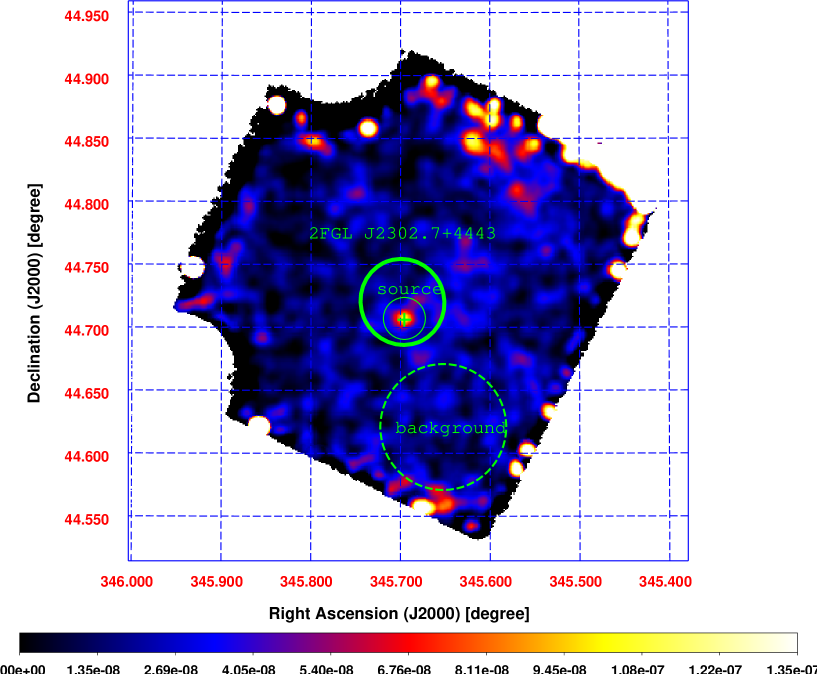
One X-ray point source was discovered inside the 2FGL error ellipse of 1FGL J2302.8+4443 at the position of [RA, Dec]=[345∘.695(3), 44∘.707(2)] (designated as Suzaku J2302+4442). The detection significance of this X-ray source was calculated as (total of 121 net source counts from three detectors). As shown in Figure 10, the detected X-ray source coincides with the radio position of the MSP PSR J2302+4442 (green cross centered at [RA, Dec]=[345∘.695748(3), 44∘.706136(1)]). This MSP was recently claimed to be associated with 1FGL J2302.8+4443. No optical and infrared counterparts of the pulsar were found. In the analysis of the Suzaku data, the source and the background regions were set as indicated in the Figure. The light curve of the X-ray counterpart with the time bin of 11520 s is presented in Figure 11. The applied test assuming a constant count rate gave /d.o.f= 4.98/5, indicating that the X-ray flux was steady during the Suzaku exposure.
The XIS spectrum of the detected X-ray source is shown in Figure 12. Initially, we fitted the spectrum with an absorbed power-law model. This model returned an extremely soft continuum characterized by a photon index of , and a rather high value of cm-2. This absorption value is in excess of the Galactic column density in the direction of the target, namely cm-2, as determined by Kalberla et al. (2005) from the LAB survey of Galactic HI. Next we applied an absorbed black body model but the model fit returned consistent with zero. We therefore fixed and obtained the best-fit (/d.o.f. = 3.0/11) temperature of keV (see Figure 12). The observed X-ray flux of the source is erg cm-2 s-1 in the keV range and 3.3 erg cm-2 s-1 in the keV range. The ratio between -ray and keV fluxes for 1FGL J2302.8+4443/Suzaku J2302+4442 reads as 14531. This ratio is relatively high but still consistent with those of Fermi-LAT /LAT pulsars reported in Marelli et al. (2011).
3.5 Other Sources
No X-ray sources were detected in our Suzaku exposures inside the 2FGL error ellipses of the remaining -ray objects: 1FGL J0106.7+4853, 1FGL J1743.87620, and 1FGL J1902.05110. The corresponding X-ray images of the targets are shown in Figures 13, 14, and 15. Out of these three sources, 1FGL J1902.05110 has been recently associated with the MSP PSR J19025105. Even more recently, after the submission of this paper, also 1FGL J0106.7+4853 has been identified with a new -ray pulsar PSR J0106+4855 (Pletsch et al., 2011). Thus only 1FGL J1743.87620 remains at the moment unassociated. We calculated an X-ray upper limit in the keV band for the latter source assuming X-ray emission from a point source located at the center of 2FGL error region, obtaining in this way the energy flux erg cm-2 s-1. In the case of 1FGL J1902.05110, we set the X-ray extraction region as a radius circle around the radio position of PSR J19025105. The resulting X-ray upper limits are calculated as erg cm-2 s-1 ( keV) and erg cm-2 s-1 ( keV) by assuming an absorbed power-law model with photon index . Finally, X-ray upper limits for 1FGL J0106.7+4853 were calculated for a circular extraction region with radius 1’ around the position of PSR J0106+4855, obtaining 10-15 erg cm-2 s-1 ( keV) and 10-14 erg cm-2 s-1 ( keV). For these two pulsars, the ratio of the GeV and keV fluxes are 976 and 2640, respectively. These flux ratios are consistent with the ratios of Fermi-LAT pulsars reported in Marelli et al. (2011). The results of the Swift observations of all of the three targeted -ray emitters are consistent with the Suzaku results.
4 Discussion and Conclusions
In this paper, we report on the results of X-ray follow-up observations of seven bright Fermi-LAT sources at high Galactic latitudes () using Suzaku XIS. We discovered the X-ray counterpart of 1FGL J2302.8+4443 coinciding with the position of the MSP PSR J2302+4442 recently claimed to be associated with the -ray emitter. We did not however, detect X-ray counterparts for the other four Fermi-LAT objects similarly identified with a normal pulsar (1FGL J0106.7+4853) and MSPs, namely for 1FGL J1312.6+0048, 1FGL J1902.05110 and 1FGL J2043.2+1709. (In a few cases the X-rays sources have been detected within the 2FGL error ellipses, but none at the positions of the pulsars.) A relatively weak X-ray source was found inside the 2FGL error region of 1FGL J1739.4+8717. Finally, no candidate for the X-ray counterpart was detected for the remaining object 1FGL J1743.87620.
Including our previous observations of 1FGL J1231.11410, 1FGL J1311.73429, 1FGL J1333.2+5056, and 1FGL J2017.3+0603 reported in Maeda et al. (2011), our sample of high Galactic-latitude Fermi-LAT objects initially selected as unidentified and studied with Suzaku consists now of eleven targets. For eight of these, we have detected single or multiple X-ray sources within the LAT error ellipses. Over the time period when the Suzaku observations were being obtained, six targets from the -ray sample were found to be associated with MSPs, one target (1FGL J0106.7+4853) has been associated with a normal pulsar, and one source (1FGL J1333.2+5056) has been classified as an AGN candidate, all in agreement with the gathered X-ray data. Still, four objects from the list remain unidentified. As argued below, one of these four, 1FGL J1739.4+8717, is quite likely a high-redshift blazar.
The source 1FGL J1739.4+8717 was characterized by an enhanced flux level within the LAT photon energy range during the the first seven months of Fermi-LAT operation333http://heasarc.gsfc.nasa.gov/FTP/fermi/data/lat/catalogs/source/lightcurves/2FGLJ1738.9+8716.png. After that time, the activity of the -ray emitter decreased. The photon index in the LAT energy band is = 2.1 0.1 (where dN/dE E is the differential photon flux; Abdo et al., 2011), which is a typical value for the -ray spectra of BL Lac type blazars (see Ackermann et al., 2011). Importantly, as written in section 3.2 one relatively bright radio source, NVSS J173722+871744, is located inside the 2FGL error region of 1FGL J1739.4+8717 (see Figure 4). With a typical radio spectral index for blazar sources and radio-to-optical and optical-to-X-ray spectral indices that are consistent with blazar broadband spectrum, it is quite likely that 1FGL J1739.4+8717 is indeed associated with a distant blazar currently characterized by an activity level low enough so that its X-ray emission was below the detection limit of the XIS instrument ( erg cm-2 s-1) at the time of the performed Suzaku observations.
In general, unidentified sources constituted a large fraction of the population of -ray emitters detected by EGRET ( in 3EG), and at present about 31 of Fermi-LAT sources in 2FGL catalog remain unassociated (specifically 273 sources at high Galactic latitudes () and 303 sources at low Galactic latitudes ). Those located at the lowest Galactic latitudes () are most widely expected to be associated with local systems such as molecular clouds, supernova remnants, massive stars, high-mass X-ray binaries, radio quiet pulsars, and pulsar wind nebulae (e.g., Kaaret & Cottam, 1996; Yadigaroglu & Romani, 1997; Romero et al., 1999). In particular, half a dozen of the brightest 3EG sources in the Galactic plane were identified as young pulsars (Thompson et al., 1999), despite the relatively poor localization of the EGRET sources and the source confusion complicated substantially the identification procedure. On the other hand, most of the unassociated 3EG sources at high Galactic latitudes () were later identified as blazars (Sowards-Emmerd et al., 2003, 2004). Pulsars were therefore expected to be found mainly among GeV emitters at low Galactic latitudes, while blazars were supposed to constitute the main population of GeV emitters at high Galactic latitudes. But the -ray–bright pulsars were also expected to be found at intermediate Galactic latitudes (; Crawford et al., 2006). The identification of a number of Fermi-LAT objects located above the Galactic plane () with such systems (predominantly with MSPs) confirmed these expectations (see, e.g., Ransom & Pulsar Search Consortium, 2010, and the discussion in Maeda et al. 2011).
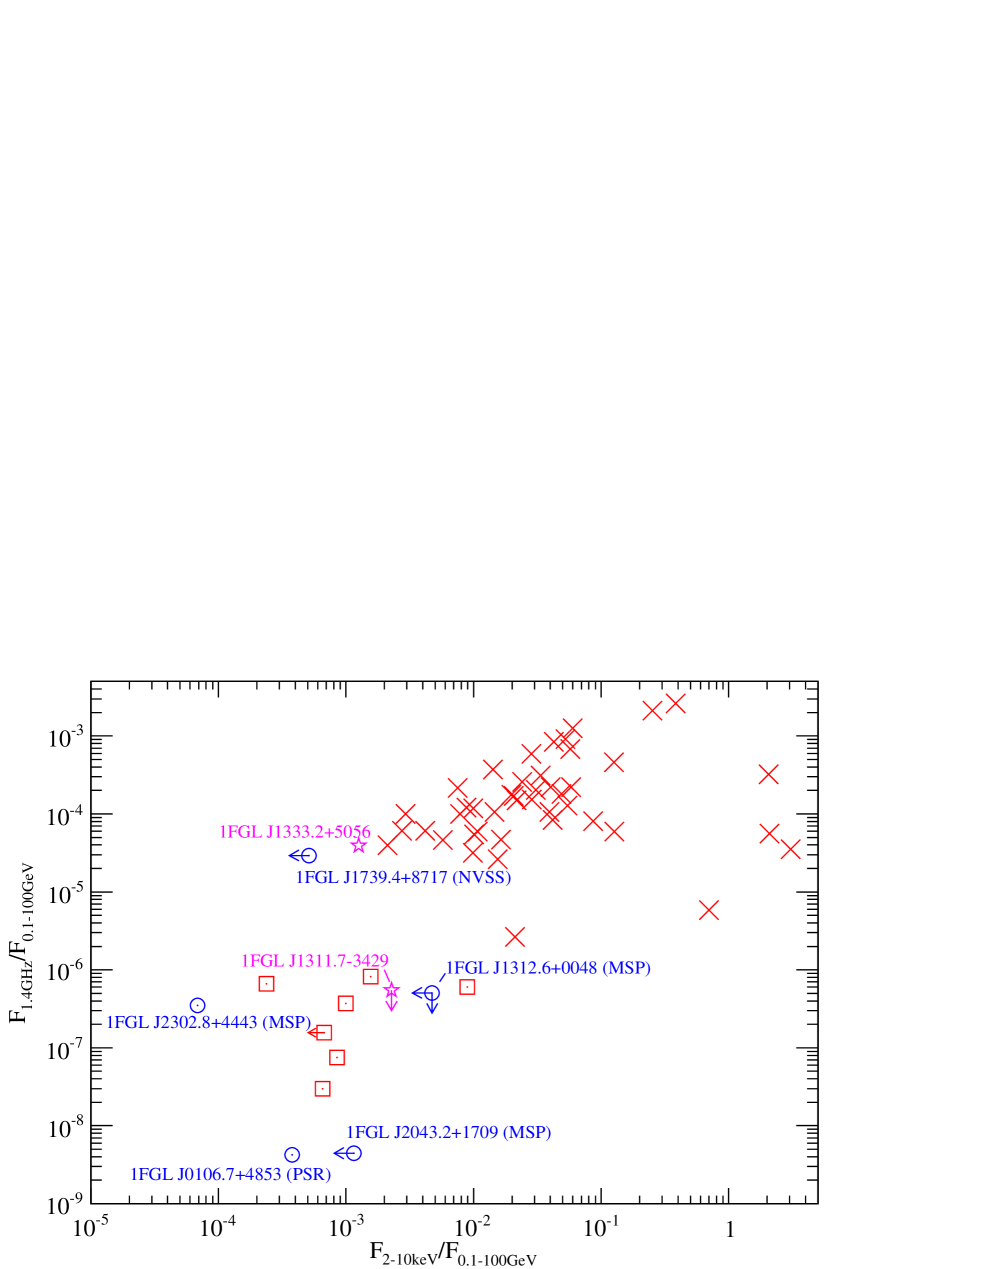
In Figure 17 we plot the X-ray–to–-ray energy flux density ratios () versus radio–to–-ray energy flux density ratios () for the Fermi-LAT objects from our Suzaku sample discussed here (blue circles) with the radio data available in the literature (Abdo et al., 2010b; Condon et al., 1998, see Table 3). These can be compared with the analogous ratios evaluated for bright Fermi-LAT objects identified with blazars and MSPs (denoted in the figure by red crosses and squares, respectively). We remind the reader that the blazar class includes flat spectrum radio quasars (FSRQs) and BL Lacertae objects (BL Lacs). In addition, in the figure we plot the two targets discussed in Maeda et al. (2011), namely 1FGL J1333.2+5056 most likely associated with an AGN, and a peculiar object 1FGL J1311.73429 (pink stars). As shown, the blazar and MSP populations are clearly separated in the constructed flux ratio plane. Also, four objects from our sample which have recently been associated with a normal pulsar (1FGL J0106.7+4853) and MSPs (1FGL J1312.6+0048, 1FGL J2043.2+1709, and 1FGL J2302.8+4443) occupy the same region in the analyzed parameter space as the previously known MSPs detected in the GeV range444In the case of 1FGL J1312.6+0048, the X-ray–to–-ray energy flux density ratio shown in Figure 17 is evaluated assuming the association of the -ray sources with the MSP PSR J1312+00. That is, the Suzaku XIS upper limit derived at the position of the pulsar is considered, and not the X-ray flux of the Suzaku source detected within 2FGL error region.. On the other hand, in the case of 1FGL J1739.4+8717 the evaluated energy flux density ratios — which are very similar to those characterizing 1FGL J1333.2+5056 — are consistent with the blazar identification proposed above, if only NVSS J173722+871744 is considered as the true counterpart of the -ray emitter.
In all, we conclude that the gathered Suzaku XIS data together with the broad-band properties of the analyzed Fermi-LAT objects are in agreement with the identification of most of them as MSPs. Yet a few cases in the analyzed sample (1FGL J1739.4+8717, 1FGL J1333.2+5056) constitute quite probable associations with AGN (high-redshift blazars). Finally, the nature of the remaining few targets (like 1FGL J1311.73429) is still an open question, although, as inferred from Figure 17, the MSP identification seems more viable than the blazar one. In the near future, we are further continuing our X-ray studies during the Suzaku AO6 cycle, focusing on both new targets (1FGL J0103.1+4840, 1FGL J1946.75404, and 1FGL J2339.70531), but also performing ultra-deep exposures on particularly intriguing sources like 1FGL J1311.7-3429.
Finally, let us comment in more detail on the case of 1FGL J2302.8+4443. This object, as already mentioned above, has recently been associated with the millisecond pulsar PSR J2302+4442 discovered by the Nançay radio telescope (Cognard et al., 2011). The rotation period of the pulsar is ms, the spin-down luminosity is erg s-1, and the characteristic age can be evaluated as Gyr. Cognard et al. (2011) reported also on the detection of the X-ray counterpart of the pulsar with XMM-Newton, with the unabsorbed keV flux of erg cm-2 s-1. This is consistent with our Suzaku detection (the re-calculated flux in the same photon energy range erg cm-2 s-1). Anticipating the distance of the pulsar kpc which was inferred from the NE2001 model of Galactic free electron density (Cordes & Lazio, 2001), the X-ray luminosity of PSR J2302+4442 can therefore be evaluated roughly as erg s-1. This, together with provided above, is then in good agreement with the scaling relation between the X-ray and spin-down luminosities established for MSPs (Becker & Truemper, 1997; Gaensler & Slane, 2006; Zhang et al., 2007), although the inferred distance of PSR J2302+4442 is indicated to be smaller by a factor of four considering an unphysically high -ray efficiency and, instead, assuming average efficiency of -ray MSPs 10 % (Cognard et al., 2011).
The spectrum of the X-ray counterpart of PSR J2302+4442/1FGL J2302.8+4443 was well fit by a blackbody model, and this is again in agreement with the idea that the observed X-ray photons originate from thermal emission from the surface of a rotating magnetized neutron star. Because of the limited photon statistics in the higher energy range of XIS, we could not however confirm the presence of a non-thermal component above 2 keV (clearly detected in the case of 1FGL J1231.11410 by Maeda et al., 2011). Interestingly, for the isolated pulsars as old as PSR J2302+4442 (characteristic age of about 6 Gyr), the surface temperature of the neutron star is expected to be K (Nomoto & Tsuruta, 1987; Page & Applegate, 1992). Our detection of the X-ray counterpart indicated keV, i.e. K instead. Some reheating process is therefore required, possibly related to the impact of relativistic particles on polar caps (Becker & Truemper, 1997, and references therein).
C.C. Cheung’s work at NRL is sponsored by NASA DPR S-15633-Y. Ł.S. is grateful for the support from Polish MNiSW through the grant N-N203-380336. We thank the anonymous referee for a careful reading of the manuscript and useful suggestion which helped to improve the paper.
References
- Abdo et al. (2009a) Abdo, A. A., Ackermann, M., Ajello, M., et al. 2009a, ApJS, 183, 46
- Abdo et al. (2009b) Abdo, A. A., Ackermann, M., Ajello, M., et al. 2009b, ApJ, 701, L123
- Abdo et al. (2010a) Abdo, A. A., Ackermann, M., Ajello, M., et al. 2010a, ApJS, 187, 460
- Abdo et al. (2010b) Abdo, A. A., Ackermann, M., Ajello, M., et al. 2010b, ApJS, 188, 405
- Abdo et al. (2010c) Abdo, A. A., Ackermann, M., Ajello, M., et al. 2010c, ApJ, 709, L152
- Abdo et al. (2010d) Abdo, A. A., Ackermann, M., Ajello, M., et al. 2010d, ApJ, 710, L92
- Abdo et al. (2010e) Abdo, A. A., Ackermann, M., Ajello, M., et al. 2010e, ApJ, 714, 927
- Abdo et al. (2010f) Abdo, A. A., Ackermann, M., Agudo, I., et al. 2010f, ApJ, 716, 30
- Abdo et al. (2010g) Abdo, A. A., Ackermann, M., Ajello, M., et al. 2010g, ApJ, 720, 912
- Abdo et al. (2010h) Abdo, A. A., Ackermann, M., Ajello, M., et al. 2010h, A&A, 512, A7
- Abdo et al. (2010i) Abdo, A. A., Ackermann, M., Ajello, M., et al. 2010i, A&A, 524, A75
- Abdo et al. (2010j) Abdo, A. A., Ackermann, M., Ajello, M., et al. 2010j, Sci, 325, 848
- Abdo et al. (2011) Abdo, A. A., Ackermann, M., Ajello, M., et al. 2011, submitted, arXiv:1108.1435
- Ackermann et al. (2011) Ackermann, M., Ajello, M., Allafort, A., et al. 2011, submitted, arXiv:1108.1420
- Akamatsu et al. (2011) Akamatsu, H., Hoshino, A., Ishisaki, Y., et al. 2011, arXiv:1106.5653
- Atwood et al. (2009) Atwood, W. B., Abdo, A. A., Ackermann, M., et al. 2009, ApJ, 697, 1071
- Bailes et al. (1997) Bailes, M., Johnston, S., Bell, J. F., et al. 1997, ApJ, 481, 386
- Baldwin et al. (1985) Baldwin, J. E., Boysen, R. C., Hales, S. E. G., et al. 1985, MNRAS, 217, 717
- Becker & Truemper (1997) Becker, W., & Truemper, J. 1997, A&A, 326, 682
- Burrows et al. (2005) Burrows D. N., Hill, J. E., Nousek, J. A., et al. 2005, Space Science Reviews, 120 165
- Casandjian & Grenier (2008) Casandjian, J.-M., & Grenier, I. A. 2008, A&A, 489, 849
- Camilo et al. (2011) Camilo, F., et al. 2011, in prep.
- Cognard et al. (2011) Cognard, I., et al. 2011, in prep.
- Condon et al. (1998) Condon, J. J., Cotton, W. D., Greisen, E. W., et al. 1998, AJ, 115, 1693
- Cordes & Lazio (2001) Cordes, J. M., & Lazio, T. J. W. 2001, ApJ, 549, 997
- Crawford et al. (2006) Crawford, F., Roberts, M. S. E., Hessels, J. W. T., et al. 2006, ApJ, 652, 1499
- Day et al. (1998) Day, C., et al. 1998, The ASCA Data Reduction Guide, Tech. Rep., (Greenbelt: NASA GSFC), v.2.0
- Gaensler & Slane (2006) Gaensler, B. M., & Slane, P. O. 2006, ARA&A, 44, 17
- Guillemot et al. (2011) Guillemot, L., Freire, P. C. C., Cognard, I., et al. 2012, MNRAS, submitted
- Hartman et al. (1999) Hartman, R. C., Bertsch, D. L., Bloom, S. D., et al. 1999, ApJS, 123, 79
- Ishisaki et al. (2007) Ishisaki, Y., Maeda, Y., Fujimoto, R., et al. 2007, PASJ, 59, 113
- Kaaret & Cottam (1996) Kaaret, P., & Cottam, J. 1996, ApJ, 462, L35
- Kalberla et al. (2005) Kalberla, P. M. W., Burton, W. B., Hartmann, D., et al. 2005, A&A, 440, 775
- Kokubun et al. (2007) Kokubun, M., Makishima, K., Takahashi, T., et al. 2007, PASJ, 59, 53
- Koyama et al. (2007) Koyama, K., Tsunemi, H., Dotani, T., et al. 2007, PASJ, 59, 23
- Lundgren et al. (1995) Lundgren, S. C., Zepka, A. F., Cordes, J. M., 1995, ApJ, 453, 419
- Maeda et al. (2011) Maeda, K., Kataoka, J., Nakamori, T., et al. 2011, ApJ, 729, 103
- Marelli et al. (2011) Marelli, M., De Luca, A., & Caraveo, P. A. 2011, ApJ, 733, 82
- Matsumoto et al. (2007) Matsumoto, H., Ueno, M., Bamba, A., et al. 2007, PASJ, 59, 199
- Mitsuda et al. (2007) Mitsuda, K., Bautz, M., Inoue, H., et al. 2007, PASJ, 59, 1
- Monet et al. (2003) Monet D. G., Levine, S. E., Canzian, B., et al. 2003, AJ, 125, 984
- Navarro et al. (1995) Navarro, J., Bruyn, A. G., Frail, D. A., et al. 1995, ApJ, 455, L55
- Nomoto & Tsuruta (1987) Nomoto, K., & Tsuruta, S. 1987, ApJ, 312, 711
- Page & Applegate (1992) Page, D., & Applegate, J. H. 1992, ApJ, 394, L17
- Pletsch et al. (2011) Pletsch, H. J., Guillemot, L., Allen, B., et al. 2011, arXiv:1111.0523
- Ransom & Pulsar Search Consortium (2010) Ransom, S. M., & Pulsar Search Consortium, F. 2010, Bulletin of the American Astronomical Society, 42, 655
- Ransom et al. (2011) Ransom, S. M., Ray, P. S., Camilo, F., et al. 2011, ApJ, 727, L16
- Rengelink et al. (1997) Rengelink, R. B., Tang, Y., de Bruyn, A. G., et al. 1997, A&AS, 124, 259
- Romero et al. (1999) Romero, G. E., Benaglia, P., & Torres, D. F. 1999, A&A, 348, 868
- Roming et al. (2005) Roming, P. W. A., Kennedy, T. E., Mason, K. O., et al. 2005, SSRv, 120, 95
- Sakurai et al. (2001) Sakurai, I., Kawai, N., Torii, K., et al. 2001, PASJ, 53, 535
- Skrutskie et al. (2006) Skrutskie, M. F., Cutri, R. M., Stiening, R., et al. 2006, AJ, 131, 1163
- Sowards-Emmerd et al. (2003) Sowards-Emmerd, D., Romani, R. W., & Michelson, P. F. 2003, ApJ, 590, 109
- Sowards-Emmerd et al. (2004) Sowards-Emmerd, D., Romani, R. W., Michelson, P. F., & Ulvestad, J. S. 2004, ApJ, 609, 564
- Sowards-Emmerd et al. (2005) Sowards-Emmerd, D., Romani, R. W., Michelson, P. F., Healey, S. E., & Nolan, P. L. 2005, ApJ, 626, 95
- Takahashi et al. (2007) Takahashi, T., Abe, K., Endo, M., et al. 2007, PASJ, 59, 35
- Thompson (2004) Thompson, D. J. 2004, Cosmic Gamma-Ray Sources, 304, 149
- Thompson et al. (1999) Thompson, D. J., Bailes, M., Bertsch, D. L., et al. 1999, ApJ, 516, 297
- Uchiyama et al. (2008) Uchiyama, Y., Maeda, Y., Ebara, M., et al. 2008, PASJ, 60, 35
- Webb et al. (2004a) Webb, N. A., Olive, J.-F., Barret, D., 2004a, A&A, 417, 181
- Webb et al. (2004b) Webb, N. A., Olive, J.-F., Barret, D., et al. 2004b, A&A, 419, 269
- Yadigaroglu & Romani (1997) Yadigaroglu, I.-A., & Romani, R. W. 1997, ApJ, 476, 347
- Zhang et al. (2007) Zhang, L., Fang, J., & Chen, S. B. 2007, ApJ, 666, 1165
| Name | OBS ID | Pointing Directiona | Observation | Effective | -ray photon | -ray fluxb | |
|---|---|---|---|---|---|---|---|
| start | exposure | indexb | |||||
| RA [deg] | DEC [deg] | (UT) | [ksec] | [erg cm-2 s-1] | |||
| 1FGL J0106.74853 | 705010010 | 16.6433 | 48.9425 | 2010/07/15 09:53:44 | 19.7 | 2.05 | 2.64 10-11 |
| 1FGL J1312.60048 | 705011010 | 198.1860 | 0.8370 | 2011/01/17 04:38:43 | 17.5 | 1.99 | 1.96 10-11 |
| 1FGL J1739.48717 | 705012010 | 264.8730 | 87.2900 | 2010/04/26 23:41:56 | 16.7 | 2.12 | 2.92 10-11 |
| 1FGL J1743.87620 | 705013010 | 265.9610 | 76.3420 | 2010/04/14 00:16:05 | 34.0 | 2.14 | 2.83 10-11 |
| 1FGL J1902.05110 | 705014010 | 285.5220 | 51.1700 | 2010/04/13 06:37:43 | 38.5 | 2.10 | 2.46 10-11 |
| 1FGL J2043.21709 | 705015010 | 310.8220 | 17.1640 | 2010/05/03 19:23:03 | 17.7 | 2.13 | 3.15 10-11 |
| 1FGL J2302.84443 | 705016010 | 345.7070 | 44.7230 | 2010/06/26 05:52:36 | 35.6 | 2.04 | 4.81 10-11 |
a The pointing directions are the values of planned target coordinates.
b These values are taken from 1FGL catalog (Abdo et al., 2010b).
| Name | Position | ||
|---|---|---|---|
| Suzaku detection | RA[deg] | DEC[deg] | |
| 1FGL J0106.7+4853 | - | - | - |
| 1FGL J1312.6+0048 | SUZAKU J1312+0050 | 198.235(2) | 0.835(2) |
| 1FGL J1739.4+8717 | sourcea | - | - |
| 1FGL J1743.87620 | - | - | - |
| 1FGL J1902.05110 | - | - | - |
| 1FGL J2043.2+1709 | SUZAKU J2043+1710 | 310.801(2) | 17.171(2) |
| SUZAKU J2043+1707 | 310.822(3) | 17.133(3) | |
| 1FGL J2302.8+4443 | PSR J2302+4442 | 345.695(3) | 44.707(2) |
aWe could not determine the exact position of the source because of extended source image (see section 3.2).
| Name | Model | Model | X-ray flux | Radio flux | ||
|---|---|---|---|---|---|---|
| parameter | F2-10keV | F1.4GHz | ||||
| [ cm-2] | [erg cm-2 s-1] | [mJy] | ||||
| 1FGL J0106.7+4853 | PSR J0106+4855 | 11.9 (fixed) | PL | =2.0 (fixed) | 1.0 10-14 | 0.008 |
| 1FGL J1312.6+0048 | source | 0.0 (fixed) | PL | =1.9 | 8.0 10-14 | 0.71 |
| off-sourcec | 2.1 (fixed) | PL | =2.0 (fixed) | 9.3 10-14 | 0.82 | |
| 1FGL J1739.4+8717 | source | 6.36 (fixed) | PL | =2.1 | 3.6 10-13 | 0.58 |
| NVSS J173722+871744 | 6.4 (fixed) | PL | =2.0 (fixed) | 1.5 10-14 | 61.3 | |
| 1FGL J1743.87620 | - | 8.13 (fixed) | PL | =2.0 (fixed) | 4.5 10-14 | - |
| 1FGL J1902.05110 | PSR J1902-5105 | 4.87 (fixed) | PL | =2.0 (fixed) | 2.5 10-14 | - |
| 1FGL J2043.2+1709 | src A | 6.63 (fixed) | PL | =1.67 | 2.1 10-13 | 1.01 |
| src B | 0.0 (fixed) | PL | =1.6 | 9.1 10-14 | 1.00 | |
| PSR J2043+1711 | 6.67 (fixed) | PL | =2.0 (fixed) | 3.6 10-14 | 0.01a | |
| 1FGL J2302.8+4443 | PSR J2302+4442 | 0.0 (fixed) | BB | =0.31 keV | 3.3 10-15 | 1.2b |
Note. —Summary of analysis results of the seven studied 1FGL sources. Unabsorbed X-ray flux and 90 confidence upper limits
in the 210 keV band for all the sources are listed. The X-ray upper limits are calculated assuming a power law model
with a photon index of 2 for the 1FGL sources with no X-ray detection. In the seventh column, radio fluxes or upper limits at 1.4 GHz
are presented. Radio fluxes and upper limits
The radio values with no footnote marks were taken either directly from the NVSS (Condon et al. 1998) catalog (for NVSS J173722+871744) or measured by us from the NVSS images (the upper limits; 90 confidence levels).
a This value is estimated by averaging the radio flux over four observations during which the pulsar was detected.
b From Cognard et al. (2011).
c The evaluated off-source X-ray upper limits expected to represent MSP PSR J1312+00.