Evolutionary properties of the low-luminosity galaxy population in the NGC 5044 Group††thanks: Based on observations collected at the European Southern Observatory, La Silla (Chile) and at the Casleo Observatory, operated under agreement between CONICET, UNLP, UNC, and UNSJ, Argentina
Abstract
With this third paper of a series we present Johnson-Gunn multicolour photometry for 79 objects, including a significant fraction of the faintest galaxies around NGC 5044, assessing group membership on the basis of apparent morphology (through accurate Sérsic profile fitting) and low-resolution () optical spectroscopy to estimate redshift for 21 objects.
Early- and late-type systems are found to clearly separate in the Sérsic parameter space, with the well-known luminosity vs. shape relation being mostly traced by different morphological types spanning different ranges in the shape parameter . A significantly blue colour is confirmed for Magellanic irregulars (Sm/Im’s), while a drift toward bluer integrated colours is also an issue for dE’s. Both features point to a moderate but pervasive star-formation activity even among nominally “quiescent” stellar systems. Together, dE’s and Im’s provide the bulk of the galaxy luminosity function, around , while the S0 and dSph components dominate, respectively, the bright and faint-end tails of the distribution. This special mix places the NGC 5044 group just “midway” between the high-density cosmic aggregation scale typical of galaxy clusters, and the low-density environment of looser galaxy clumps like our Local Group. The bright mass of the 136 member galaxies with available photometry and morphological classification, as inferred from appropriate M/L model fitting, amounts to a total of M⊙. This is one seventh of the total dynamical mass of the group, according to its X-ray emission. Current SFR within the group turns to be about 23 M⊙ yr-1, a figure that may however be slightly increased facing the evident activity among dwarf ellipticals, as shown by enhanced H emission in their spectra.
Lick narrow-band indices have been computed for 17 galaxies, probing all the relevant atomic and molecular features in the 4300-5800 Å wavelength range. Dwarf ellipticals are found to share a sub-solar metallicity () with a clear decoupling between Iron and elements, as already established also for high-mass systems. Both dE’s and dS0’s are consistent with an old age, about one Hubble time, although a possible bias, toward higher values of age, may be induced by the gas emission affecting the H strength.
keywords:
galaxies: clusters: NGC 5044 group – galaxies: dwarf – galaxies: elliptical and lenticular, cD – galaxies: photometry – galaxies: fundamental parameters1 Introduction
Low-mass and low-surface brightness (LSB) galaxies, including in this definition both dwarf ellipticals and irregulars, have since long surged to a central role in the general debate about galaxy formation and evolution. These objects, typically characterized by an absolute blue magnitude fainter than and a mean surface brightness mag arcsec-2 (Ferguson & Binggeli, 1994), display in fact a quite wide range of morphological and spectrophotometric properties (e.g. Jerjen, Kalnajs & Binggeli, 2000) such as to rise the question whether they assume an individual role as a sort of pristine building blocks to form more massive systems (as in the CDM theoretical scheme, e.g. Kaufmann et al., 1993), or they rather originate as coarse “by-products” of the formation of “standard” ellipticals and spirals (Knezek, Sembach, & Gallagher, 1999; Lisker et al., 2007).
The problem of the genetic signature of low-mass systems is not a negligible one as, although in a more silent way, dwarf galaxies display in many cases continuous star formation activity, which makes them possible efficient “engines” to enrich the interstellar medium (e.g. Arimoto, 1995). Actually, a major problem in this framework resides in the apparent dichotomy between active ongoing star formation, widely observed in LSB galaxies, and the exceedingly low metallicity of their present-day stellar populations (Arimoto & Tarrab, 1990). The most striking case in this context is surely that of IZw 18, as recently discussed by Aloisi et al. (2007). Again, while for some dwarf ellipticals we might be dealing with a somewhat quiescent evolutionary scenario, reminiscent of old globular cluster history, in other situations a “tuned” star formation could have proceeded allover the entire galaxy life (e.g. Grebel, 2005; Held, 2005) still leaving, nowadays, an important fraction of fresh (primordial?) gas (e.g. Carrasco et al., 1995; Kuzio de Naray, McGaugh, & de Blok, 2004).
As far as galaxy spatial distribution is concerned, the ubiquitous presence of LSB irregulars in the different cosmic environments (Cowie, Songaila, & Hu, 1991; Ferguson & Binggeli, 1994; Saracco et al., 1999) is clearly at odds with the morphology-density relation (Dressler, 1980), which has been proven to hold for “standard” galaxies for a wide range of densities and scales (Postman & Geller, 1984; Maia & da Costa, 1990; Helsdon & Ponman, 2003; Kelm, Focardi, & Sorrentino, 2005). A systematic observational work to map the LSB galaxy distribution in selected zones of the sky has been carried out by different teams, leading to complete surveys and morphological catalogues of some loose groups of galaxies and nearby clusters (Binggeli, Sandage, & Tammann, 1985; Karachentseva, Karachentsev, & Boerngen, 1985; Ichikawa, Wakamatsu, & Okamura, 1986; Davies et al., 1988; Ferguson, 1989; Ferguson & Sandage, 1990; Jerjen & Dressler, 1997; Secker & Harris, 1997).
These morphological surveys serve as a basic reference to any further spectrophotometric analysis of individual galaxies (Bothun & Mould, 1988; Brodie & Huchra, 1991; Cellone, Forte & Geisler, 1994; Held & Mould, 1994; Secker, Harris & Plummer, 1997; Cellone, 1999; Smith Castelli et al., 2008). However, efficient detection and accurate observation of LSB galaxies still remain a formidable task, even for HST observations (e.g. Ferrarese et al., 2006) especially when moving to distances beyond the Virgo and Fornax Clusters, the two best studied aggregates so far (e.g. Hilker et al., 1999; Drinkwater et al., 2001; Conselice, Gallagher, & Wyse, 2001; Deady et al., 2002; Mieske, Hilker, & Infante, 2004; Gavazzi et al., 2005; Sabatini et al., 2005).
A complementary view may be gained through the study of smaller groups. In fact, the wide range of densities which characterizes these aggregates makes them the natural link between galaxy clusters and the field. Detailed mapping of the distribution and nature of low-mass galaxies in small groups will fill the “void” between fully relaxed systems (like actually the case of NGC 5044 group, e.g. Forbes, 2007) to very loose and possibly unbound aggregates (Campos, Mendes de Oliveira, & Bolte, 2004; Roberts et al., 2004). Besides probing the properties of dwarf galaxies in different environments, these have the advantage that even a moderate-sized sample would be fairly representative of the whole group population. At the same time, depth effects would be minimized allowing a better analysis of distance-dependent quantities.
In this work we want to further follow up a long-range study on the low-mass LSB galaxy population of the NGC 5044 group. In particular, after assessing group morphology and membership in previous contributions (Cellone & Buzzoni, 2001, 2005), we would like to tackle here the problem of galaxy evolutionary properties, according to a multiwavelength observational approach that includes integrated and surface-brightness multicolour photometry, further complemented in most cases with a spectroscopic input. Our analysis will rely on original stellar population synthesis models, to which refer galaxy data in order to lead to a convenient and physically self-consistent picture of the galaxy evolutionary status for the NGC 5044 group.
In this framework, we will arrange our discussion by presenting the observed database in Sec. 2. Its morphological characterization will be carried out in Sec. 3 by fitting galaxy surface brightness with a Sérsic (1968) profile. These results in most cases refine our previous discussion in Cellone & Buzzoni (2005) leading also to a homogeneous morphological classification of the full galaxy population in the NGC 5044 group. Together with up-to-date redshift measurements, the revised morphological parameters proved to be a useful additional piece of information to constrain group membership and eventually assess the overall physical properties of the galaxy group as a whole. As a central step in this direction, in Sec. 4 we study galaxy distribution in different magnitude and colour domains. Starting from apparent magnitudes and morphological types, a match with the Buzzoni (2005) template galaxy models also allows us to lead to a realistic estimate of galaxy stellar mass and a reference birthrate figure for the galaxy group as a whole.
The spectroscopic properties for our sample are finally discussed in some detail in Sec. 5, where Lick narrow-band indices are derived for most of the observed galaxies. The diagnostic diagrams compare -element features, like Magnesium and Calcium, versus Iron and Balmer line stregth, also including the contribution from Carbon molecules like CH (G band) and C2. We will discuss our results and summarize our main conclusions in Sec. 6.
2 Observed database
Our galaxy sample consists of a total of 79 mostly dwarf and LSB galaxies, mainly selected from the Ferguson & Sandage (1990) catalogs, and representative of the faint galaxy population surrounding the standard elliptical NGC 5044, in the range mag,111For the NGC 5044 group a distance modulus can be estimated, according to the mean spectroscopic redshift of all group members in Cellone & Buzzoni (2005). For km s-1 Mpc-1 this leads to a value of mag, that we will adopt throughout this paper. regardless of morphology. Johnson photometry and imaging in the Gunn system (Thuan & Gunn, 1976; Wade et al., 1979; Schneider, Gunn & Hoessel, 1983), as well as mid-resolution (-1000) spectroscopy for a subsample of 24 objects have been collected during different observing runs from 1996 to 2000. Specifically, 40 objects have been observed during two observing campaigns (on the nights of Apr 16-17, 1999 and Apr 29-May 1, 2000) at the Eso 3.6m telescope of La Silla (Chile), while previous extended observations at the 2.15m telescope of the Casleo observatory, in San Juan (Argentina) were carried out along three observing runs (on the nights of May 10-13 1996, Apr 8-10 1997, and Mar 19-21 1999) providing supplementary data for 57 galaxies, 18 of which in common with the Eso sample.222Here, and throughout the paper, the prefix “N” in our name coding of galaxies stands for the catalogue number in Ferguson & Sandage (1990). A supplementary letter “A”, “B”, or “C” to the standard catalog number refers to the newly discovered LSB galaxies of Cellone (1999); Cellone & Buzzoni (2005), and this paper, maintaining the reference number of the closest bright galaxy.
2.1 Imaging
ESO observations have been carried out with EFOSC2, equipped with a Loral 2k CCD in a binned mode providing a platescale of 0.32 arcsec pixel-1. The field of view allowed in most cases to image more than one galaxy within each frame. A total of 24 fields were imaged in the bands (see Fig. 1 in Cellone & Buzzoni, 2005, for the exact location map), including 33 known low-luminosity galaxies, plus the bright SbI-II NGC 5054, NGC 5044 itself, and 6 newly discovered LSB galaxies (see Cellone & Buzzoni, 2005). Atmospheric conditions were photometric all the way, with sub-arcsec seeing during the first run, and a poorer performance (FWHM arcsec) in the 2000 run. In case of multiple exposures, a final image of the field was obtained by stacking the individual frames after all processing steps were completed. Standard stars from the lists of Schneider, Gunn & Hoessel (1983) and Jørgensen (1994) were also observed during each run for calibration purposes.
Johnson imaging at the Casleo telescope has been carried out, on the other hand, during two runs in 1996 and 1999. The telescope was equipped with a Tektronix 10241024 CCD, providing a 9 circular field of view in direct-imaging mode, with a platescale of 0.83 arcsec pixel-1. Standard stars for magnitude calibration were selected from the list of Landolt (1992). Seeing conditions were typically poorer than Eso observations, ranging between 2.0 and 2.8 arcsec. Partial results from the 1996 data have been presented in Cellone (1999).
Image processing of both Eso and Casleo data was done using iraf333IRAF is distributed by the National Optical Astronomy Observatories, which are operated by the Association of Universities for Research in Astronomy, Inc., under cooperative agreement with the National Science Foundation., complemented with a few of our own fortran routines. Each bias-corrected frame was twilight flat-fielded, while residual fringe patterns on Eso and images were corrected, mostly within a final % accuracy level, by subtraction of the appropriate templates (see Cellone & Buzzoni, 2005, for more details on the procedure). Cosmic rays were cleaned up using the iraf task cosmicrays, and the sky background, fitted with a tilted plane, was finally subtracted to obtain the final images of each field.
The photometric reduction procedure yielded a nominal figure ( mag) for the internal magnitude uncertainty of bright galaxies, being the total photometric error dominated throughout by the external uncertainty in the zero-point calibration. Overall, for a galaxy we estimate a full magnitude uncertainty of the order of mag, a figure that may raise to mag for the faintest () objects ( mag for Casleo data).
A check of internal self-consistency of the photometry has been made possible by the combined observations of galaxies N49 () and N83A (), in common to the 1996 and 1999 runs. For the first bright object, the coincidence was excellent, as both and isophotal magnitudes and surface brightness have been reproduced within mag, and mag arcsec-2, respectively. Much poorer is the match of N83A, instead, a very faint dSph galaxy. In the latter case, in fact, repeated photometry resulted in a nearly negligible offset of 0.06 mag, that raised however to 0.35 mag for the band. A similar figure has been found for the surface-brightness measurements, with a difference of 0.002 and 0.45 mag arcsec-2 in and , respectively. This warns of the fact that photometric parameters of very faint galaxies may actually show considerable errors.
2.1.1 Johnson to Gunn magnitude conversion
In order to ease a more homogenous discussion of the whole galaxy sample one would like to convert Casleo photometry into Eso Gunn system. To this aim we took advantage of the 18 galaxies in common between the two subsamples, as summarized in Table 1. For these galaxies, integrated magnitudes within one -effective radius, as identified by the Sérsic fitting profile (see Table 9), have been computed matching Casleo and Eso photometry.
The linear fit to these data is reported in Table 2. One has to remark, however, that the strong clustering of the data in the colour domain (see Fig. 1), poorly constrains the relations of transformation. Alternatively, more standard sets of empirical conversion relationships can be found in the literature, mainly relying on the observation of stellar grids. This is the case, for instance, of the works by Jørgensen (1994) and Kent (1985), also reported in Table 2. A further set of fully theoretical conversion equations has been considered in the table, relying on the Buzzoni (2005) template galaxy models. The latter calibration may in principle be more suitable for our aims, as it better accounts for the slightly different locus of stars and galaxies in the colour domain, given the “broader” spectral energy distribution (SED) of the latter.
| Name | Aperture magnitude | ||||
|---|---|---|---|---|---|
| [arcsec] | g | r | V | B | |
| N30 | 10.90 | 15.939 | 15.526 | 15.835 | 16.712 |
| N34 | 7.19 | 16.829 | 16.496 | 16.684 | 17.595 |
| N42 | 17.49 | 15.723 | 15.435 | 15.508 | 16.342 |
| N49 | 8.11 | 16.472 | 16.422 | 16.479 | 16.861 |
| N50 | 7.16 | 15.938 | 15.524 | 15.811 | 16.588 |
| N54 | 18.36 | 16.487 | 16.214 | 16.404 | 17.269 |
| N54A | 4.32 | 21.569 | 21.310 | 21.388 | 22.389 |
| N55 | 5.26 | 20.151 | 19.757 | 20.021 | 20.636 |
| N56 | 7.07 | 19.481 | 19.182 | 19.291 | 20.196 |
| N62 | 7.76 | 19.840 | 19.470 | 19.261 | 20.429 |
| N70 | 10.76 | 17.810 | 17.428 | 17.711 | 18.680 |
| N70A | 5.45 | 20.997 | 20.587 | 20.837 | 21.527 |
| N75 | 7.74 | 16.009 | 15.652 | 15.915 | 16.825 |
| N83 | 12.52 | 17.300 | 16.901 | 17.094 | 18.120 |
| N83A | 7.20 | 20.356 | 20.086 | 20.170 | 21.039 |
| N109 | 7.30 | 18.301 | 18.066 | 18.207 | 18.916 |
| N153 | 12.04 | 15.475 | 15.061 | 15.308 | 16.206 |
| B3 | 2.41 | 18.346 | 17.755 | 18.226 | 19.741 |
| Least-square fit to the 18 galaxies in common | |
|---|---|
| g–r = 0.33 (B–V) +0.05 | () = (0.08 mag, 0.68) |
| B–g = 0.78 (B–V) +0.03 | () = (0.10 mag, 0.86) |
| Buzzoni (2005) | |
| g–r = 0.78 (B–V) –0.25 | () = (–0.10 mag, 0.13 mag) |
| B–g = 0.78 (B–V) –0.02 | () = (0.05 mag, 0.11 mag) |
| Jørgensen (1994) | |
| g–r = 1.01 (B–V) –0.52 | () = (–0.03 mag, 0.18 mag) |
| B–g = 0.50 (B–V) +0.23 | () = (0.06 mag, 0.13 mag) |
| Kent (1985) | |
| g–r = 0.98 (B–V) –0.53 | () = (0.00 mag, 0.17 mag) |
| B–g = 0.59 (B–V) +0.19 | () = (0.01 mag, 0.12 mag) |
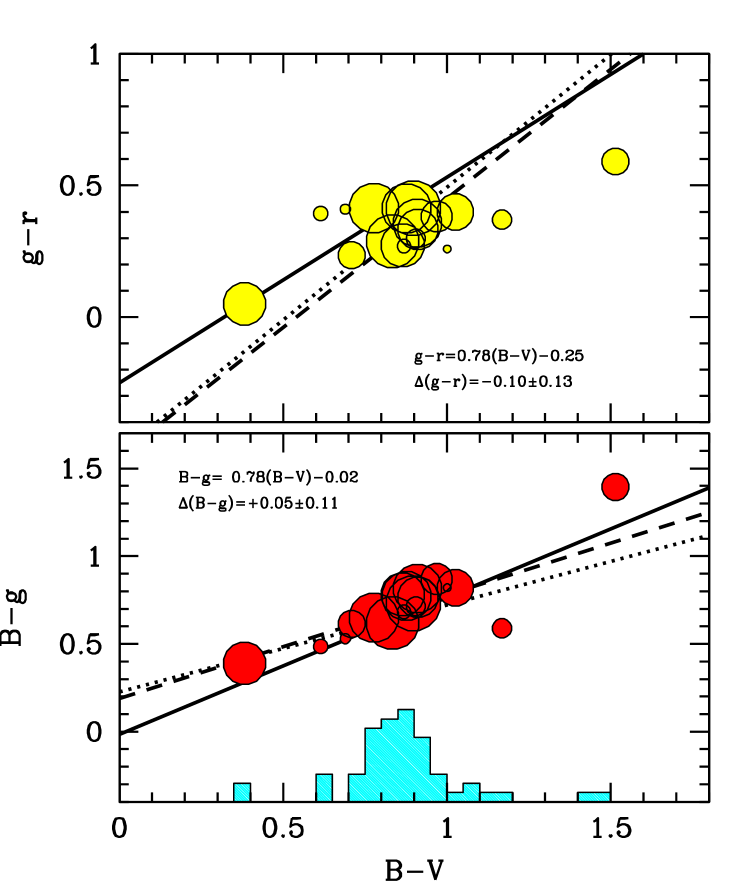
The output of the different transformation sets is compared with our galaxy distribution in Fig. 1. None of the literature relations seems to suitably account for galaxy conversion along the entire colour range. On the other hand, one has also to consider that the bunching group of common objects in Table 1 is fairly representative of the bulk of Casleo galaxies, as well (see the overplotted histogram in the lower panel of Fig. 1), and the few deviating targets at the most extreme colour edges are in fact among the faintest objects in the sample, possibly with highest internal uncertainty. To a closer analysis, and within the large scatter of the observations, one can notice a marginally more consistent match with the Buzzoni (2005) calibration, and we eventually decided to adopt this equation set for our Casleo sample to be converted to Gunn magnitudes. According to Fig. 1, the (unweighted) external uncertainty provided by the Buzzoni (2005) conversion equations (in the sense “observed” – “predicted”) amounts to and mag.
2.2 Spectroscopy
EFOSC2 has also been used in spectroscopic mode for Eso mid-resolution observations for a sub-sample of 24 galaxies (including NGC 5044 itself, the central galaxy of the group). Spectra along the 4300-6400 Å wavelength interval were obtained through a 1 arcsec longslit with Eso grism #8 and a 6 Å FWHM resolution () sampled at a scale of 2.1 Å pixel-1. When possible, a second target galaxy was included on the same spectrum frame of the main object. When no catalogued galaxy could be used as second target, we considered any likely background galaxy within the slit; six such objects were observed in this way (see Cellone & Buzzoni, 2005, for details).
The Eso sample includes virtually all (three out of four) galaxies observed at Casleo during the 1997 run in spectroscopic mode. The Casleo observations were carried out with a Boller & Chivens spectrograph equipped with a 300 line mm-1 dispersor grid, providing a FWHM resolution of 9.5 Å () along a bluer wavelength range (namely, from 3500–5700 Å) compared to Eso, sampled at bins of 4.4 Å pixel-1.
Each 2-D spectrum in our galaxy sample was bias-subtracted and flat-fielded via calibration spectra of an halogen lamp. One-dimensional spectra were extracted using iraf standard routines, and wavelength-calibrated by means of He-Ne-Ar lamp technical exposures. Flux calibration of Casleo and Eso (1999 run) spectra were carried out by means of the observation of spectrophotometric standard stars from the Baldwin & Stone (1984) catalog. Calibration of Eso 2000 observations relied instead on standard stars from the list of Gutiérrez-Moreno et al. (1988).
Finally, individual 1-D spectra were coadded to obtain the fiducial spectrum of each target. Cross-correlation with the spectrum of NGC 5044, used as a template, provided eventually a measure of the redshift of each object in the ESO sample, as we already discussed in Cellone & Buzzoni (2005). A redshift of km s-1 was derived, independently, for galaxy N29, the only one observed at Casleo with no Eso counterpart.
3 Morphological parameters
An accurate morphological study for 33 galaxies in our sample has already been undertaken in Cellone & Buzzoni (2005), providing a (re)classification and membership estimate of most objects on the basis of their image properties and, wherever possible, of the available spectroscopic redshift. Taking previous analysis as a reference, we want here to complete our review for the whole galaxy set.
We took advantage for our classification of the “objective” shape parameters, as provided by a Sérsic (1968) fit of radial surface brightness profile (), i.e.
| (1) |
In this scheme, three parameters constrain galaxy morphology, namely a central surface brightness (), a scale radius (), and a “shape index” (being, as a reference, for the standard de Vaucouleurs profile), which discriminates between “spiky” () and “cored” () galaxies. While many bright dE/dS0 do show composite structure (i.e. “bulge”+“disk”, see Cellone, 1999; Cellone & Buzzoni, 2001), we did not attempt here to make any profile decomposition; Sérsic shape parameter thus traces the global morphology of each galaxy. All the calculations made use of the -band or the -band observations for the Eso and Casleo subsamples, respectively.
Given the different PSFs between the Eso and Casleo observations, instead of trying to correct for seeing effects, we chose a simpler —and safer— approach, following Cellone (1999), who showed that seeing induced errors on the fitted Sersic parameters tend to be negligible when an inner cutoff radius FWHM is used for the fits (see also Gavazzi et al., 2005). An outer cutoff at a radius where prevents against systematic errors due to an imperfect sky subtraction. While the choice for the inner cutoff turned out to have no impact on the Eso data, thanks to their superior seeing, some limitation might be expected, in principle, for the fit of Casleo galaxies, one third of which being comprised with their scale radius within FWHM.
A summary of the results for the whole galaxy sample is displayed in Tables 9 and 10.444Note that among the Casleo galaxies, a more careful inspection of the observed fields also led us to discover 6 more LSB galaxies (all consistent with a dSph morphology), not reported ever. For reader’s better convenience, their coordinates are summarized in Table 11 of the Appendix.
In addition to the fitting morphological parameters (, and appear, respectively in col. 8, 9, and 10 of the tables), we also provided a more direct estimate of galaxy size, assumed to coincide with the isophotal radius () at mag arcsec-2, and of effective radius (), which encircles 50% of the luminosity within (see cols. 6 and 7 in the tables, respectively).555The aproximation of with might lead of course to a slightly underestimated galaxy total luminosity, an effect mostly contained within mag, as shown by Cellone & Buzzoni (2005, see Fig. 5 therein).
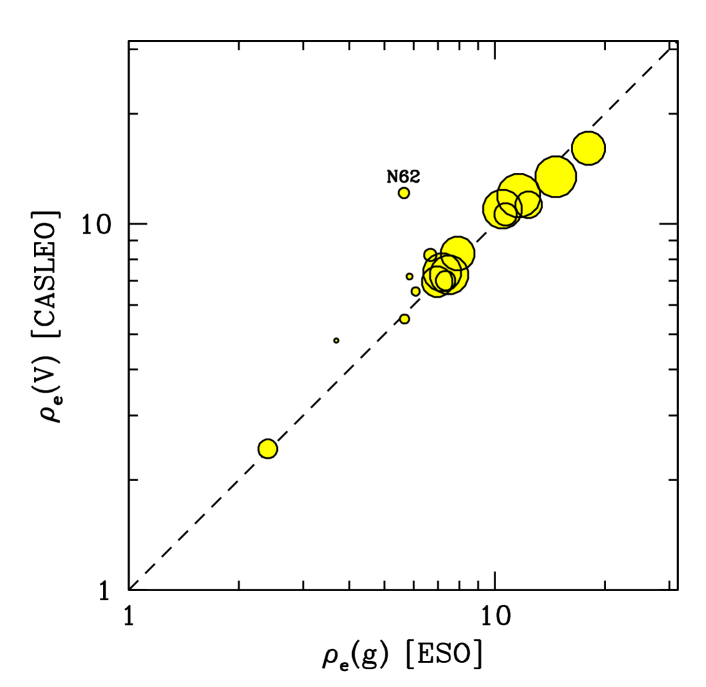
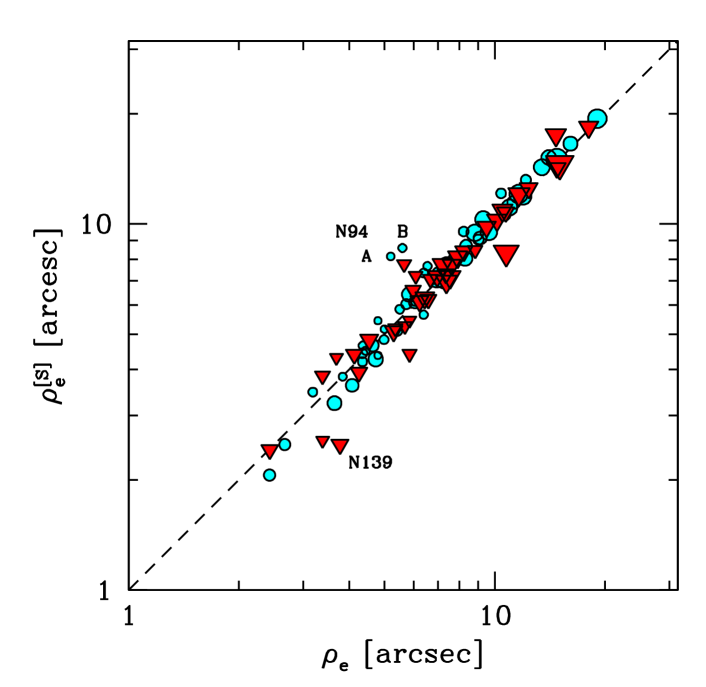
The 18 galaxies in common between the Eso and Casleo subsamples provided a useful cross-check, allowing us to consistently compare the vs. fits. For the measured values of , this is shown in the upper panel of Fig. 2, where one can appreciate a nice relationship in place between the two sets of observations with just one evident outlier, that is galaxy N62 among the faintest and most vanishing objects in the sample (see Fig. 2 in Cellone & Buzzoni, 2005). After rejecting this object, we have that Casleo effective radii match the corresponding Eso figures within a % relative uncertainty. An external check of the accuracy in the fitting procedure can be obtained from the analysis of the lower panel of Fig. 2, where the “observed” value of is matched with the corresponding parameter inferred from the Sérsic fit ().666Given a Sérsic scale length parameter, , the fitting effective radius can be defined as , where the parameter comes from the (numerical) solution of the relevant relation , with and being respectively the complete and incomplete Gamma functions. The two estimates agree within a % relative scatter, after a 3- rejection of three relevant outliers, namely the two dSph galaxies N94A and B (from the Casleo sample) and the (background?) elliptical N139 (from the Eso sample), as singled out in the figure. Regarding the shape parameter , which is particularly sensible to differing seeing conditions and sky-subtraction errors, we also obtain a good agreement () between Eso-Casleo samples when the 12 brighter () galaxies are considered, while a poorer match () is attained for the 6 fainter systems.
It is of special interest to explore the -index distribution across the Hubble/de Vaucouleurs morphological type of our galaxies. The latter has been inferred from a careful “eye-driven” standard classification of the original images, complementing the previous Cellone & Buzzoni (2005) results (see the “CB05” column in Tables 9 and 10). Given a better observing material, our types refine and update, in most cases, the original scheme by Ferguson & Sandage (1990) (column “FS90” in the tables). At the same time, our revised morphological classification led membership re-assessment for galaxies with no redshift available (see Cellone & Buzzoni, 2007). A new set of radial velocity measurements, recently provided by Mendel et al. (2008), raised to 45 the number of galaxies with available redshift in our sample. In most cases, the morphologically assigned membership status (see the corresponding code, , in col. 2 of Tables 9 and 10) was confirmed by the new redshifts, while just for three galaxies it had to be changed (from to ), leading also to changes in their respective morphological types (as from col. 5 of Tables 9 and 10).
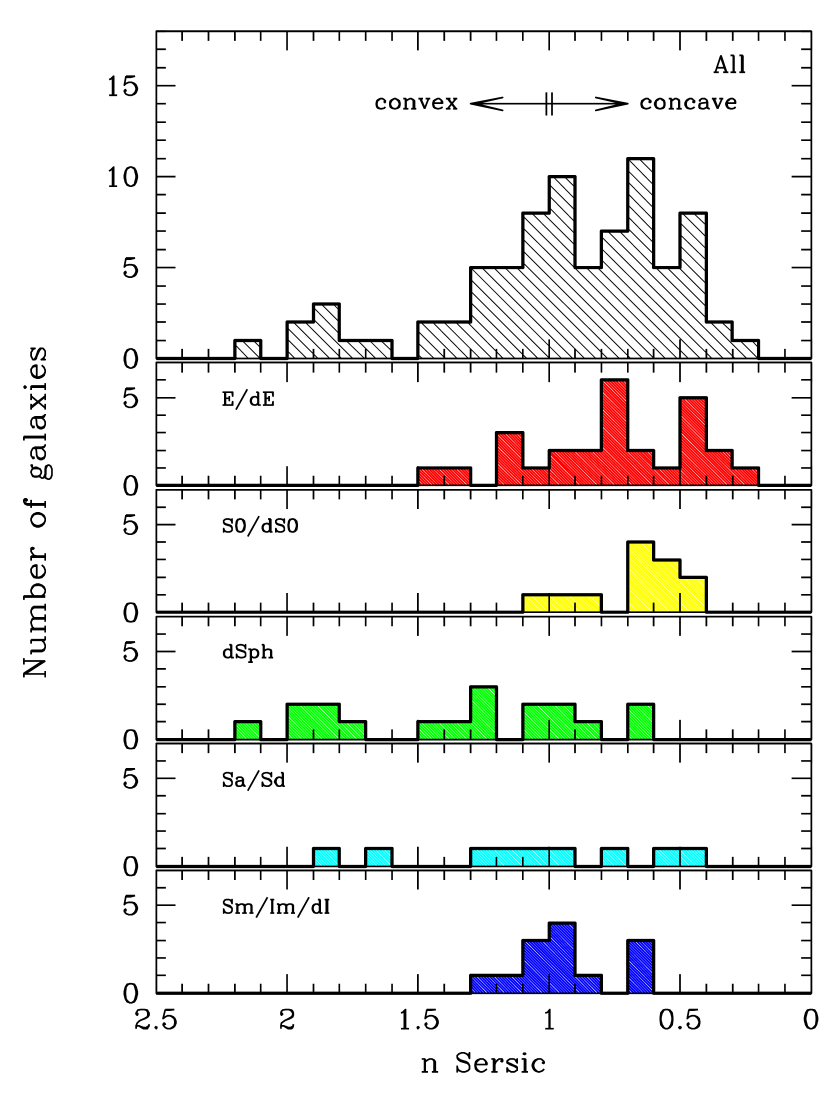
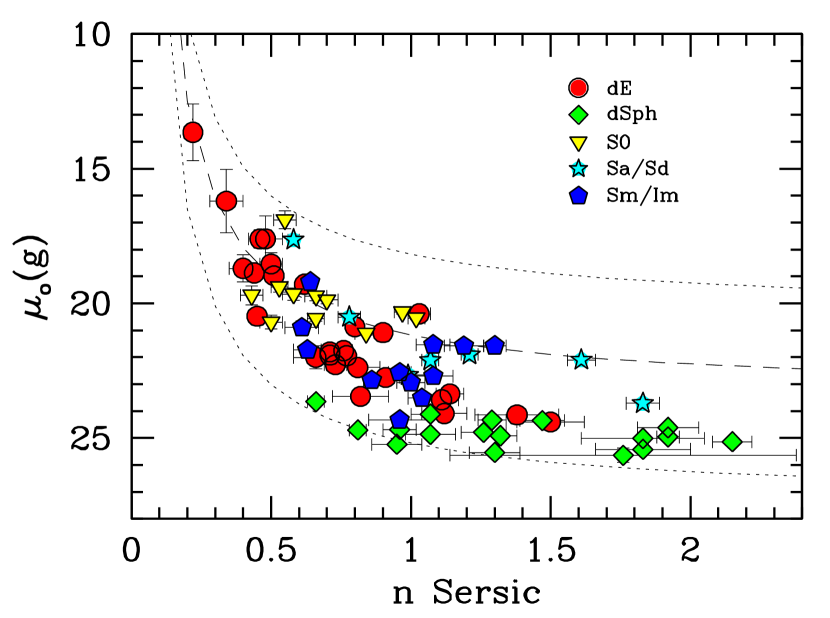
The match of the refined morphological types with the Sérsic shape index is summarized in Fig. 3. As expected, the -index properly accounts for the disk vs. bulge relative contribution to galaxy luminosity. In particular, bulge-dominated systems (E/dE+S0/dS0) are shown to display, on average, a “concave” () surface-brightness profile, while disk-dominated systems (Sa/Sd) span the full range of the index according to a wider disk/bulge luminosity partition. A shallower brightness profile also characterizes dwarf spheroidal (dSph) systems, where a cored structure likely leads to a “convex” () shape index. A pure exponential profile () is, on the contrary, the distinctive feature of later-type galaxies (Im/dI), that lack any clear nuclear condensation. To much extent, such a morphological segregation for the Sérsic shape index is the ultimate responsible for the observed trend of with galaxy luminosity (e.g. Cellone, 1999). As we will see in the next section, in fact, early-type (low-) systems are among the brightest group members, while dSph (high-) galaxies preferentially populate the faint-end tail of the group luminosity function. On a similar argument, the same effect neatly stems, as well, from a study of the vs. Sérsic parameters, like in Fig. 4.
The plot shows, in addition, that early-type profiles actually tend to smoothly match the standard de Vaucouleurs case () as far as galaxy luminosity (and accordingly ) brightens up reaching the distinctive range of “standard” ellipticals, as confirmed by the straight observed relationship. At the faint end, dSph’s display a wide range in , while their central surface brightnesses remain almost constant at mag arcsec-2.
4 Photometric properties
The Gunn magnitudes and the Johnson photometry provide a minimal but effective set of measures to probe galaxy SEDs along the 4400-9000 Å wavelength range. In addition to the morphological piece of information, in fact, a multicolour study of integrated luminosity of our targets, as well as of their surface brightness distributions could provide us with important clues to tackle the distinctive evolutionary properties of the galaxy population in the NGC 5044 group.
Again, our final results are collected in Table 9 and 10, respectively for the Eso and Casleo observations.777In spite of the higher internal uncertainty (see Sec. 2), note that magnitudes and colours in Tables 9 and 10 are given with a nominal 3-digit precision simply for graphical purposes. In both tables, the total apparent magnitude (encircled within the mag arcsec-2 isophote in the and bands, respectively) is reported in col. 11, together with the mean surface brightness within the same isophotal radius, and within one effective radius (cols. 12 and 13, respectively) according to the corresponding values of and . Our output is finally completed with the colours (cols. 14 to 19 in Table 9) and (cols. 14 and 15 in Table 10) across the same relevant apertures. Unless explicitely stated, note that no correction for Galactic reddening has been introduced. According to Burstein & Heiles (1982), the colour excess in the sky region around NGC 5044 amounts to mag, a figure that may raise to mag according to the Schlegel, Finkbeiner, & Davis (1998) reddening map.
| Eso+Casleo sample | ||
| Type | no. of | |
| galaxies | ||
| dE | 0.401 | 22 |
| S0 | 0.408 | 11 |
| dSph | 0.352 | 16 |
| Sa/Sd | 0.327 | 2 |
| Sm/Im | 0.203 | 8 |
| All | 0.360 | 59 |
| (a) Only likely member galaxies are considered (i.e. with membership code in Table 9 and 10). No correction for Galactic reddening has been applied. | ||
| (b) Mean colour within the mag arcsec-2 isophote. | ||
4.1 Colour and magnitude distribution
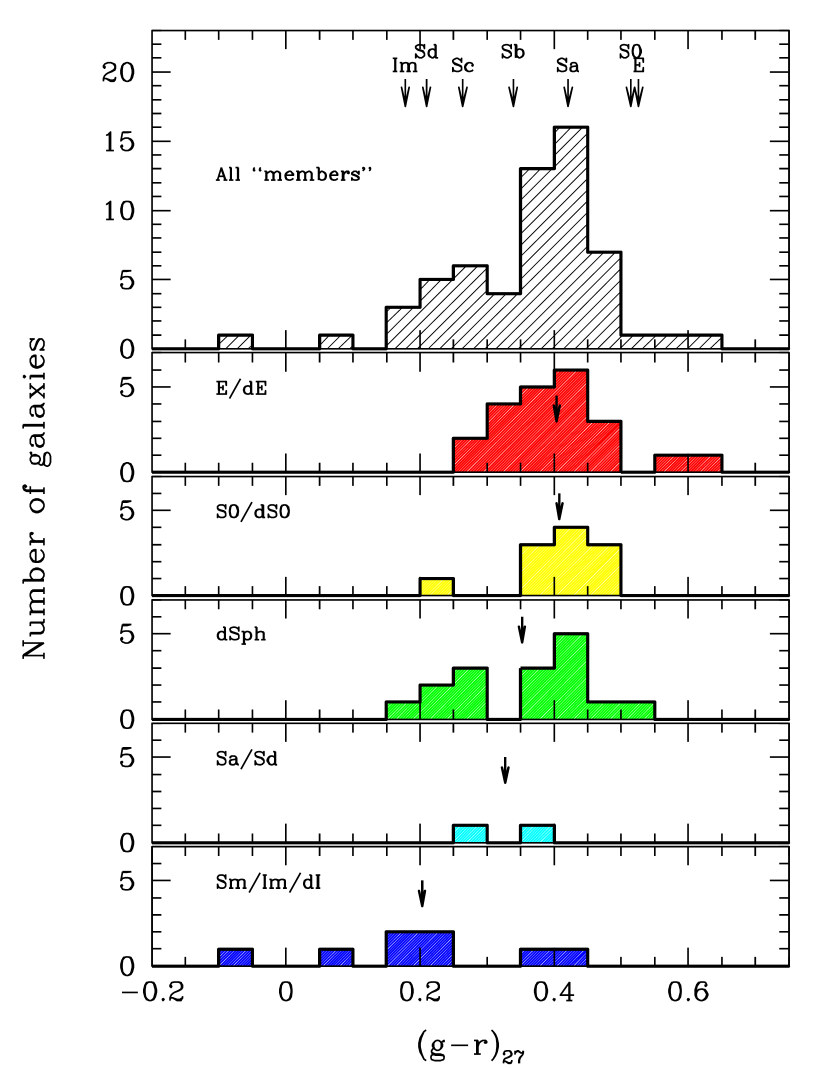
The colour distribution in the plane of integrated for the whole sample of 59 “likely member” (membership code in Tables 9 and 10) galaxies with available colours is displayed in the upper panel of Fig. 5. In the other panels of the figure we also disaggregated the galaxy distribution according to homogenous morphology groups. Again, a clean overall trend can be recognized, with a colour shift from “red” to “blue” systems along the morphological sequence dE dS0 dSph Sabc dI. The mean colours, according to Table 3, are also marked in each panel, and consistently compare with the theoretical predictions from Buzzoni (2005) (the arrow sequence in the upper panel of the figure) once considering the reddening shift.
Whithin the whole colour distribution of Fig. 5, one has to notice the key location of dwarf spheroidals, largely overlapping the apparent colour range of spirals and ellipticals but with slightly bluer colours compared to S0 systems. Like for the Local Group counterparts (see, e.g. Tolstoy, Hill, & Tosi, 2009, for an updated review), this feature actually accounts for the “bivalent” nature of these systems, bridging the morphological look of bulge-dominated systems and the composite photometric properties of disk-dominated galaxies, certainly reminiscent of a complex star formation history.
The galaxy distribution across the vs. c-m diagram is displayed in Fig. 6. The full sample (79 galaxies) has been plotted, marking however with solid symbols only the likely member galaxies (membership code in Tables 9 and 10). In order to reach a better sampling of the overall luminosity function of the cluster, we also picked up from the Ferguson & Sandage (1990) (50 galaxies) and Mendel et al. (2008) (46 galaxies) catalogs all the other likely or confirmed member galaxies (see Table 6 for their identification) not included in our observations. For these galaxies we converted the published photometry into magnitudes, according to our Table 2 calibration. As no direct colour information is available for this subsample, we framed these galaxies in Fig. 6 together with the five Casleo objects lacking information.888For magnitude transformation of Casleo, Ferguson & Sandage (1990) and Mendel et al. (2008) galaxies we adopted a reference . This reflects into a magnitude uncertainty of roughly 0.3 mag in the framed points of Fig. 6.
Once considering the extended sample of all the Ferguson & Sandage (1990) and Mendel et al. (2008) galaxies, the diagram shows an evident morphology/luminosity segregation within the different galaxy groups. As for the two leading systems (namely NGC 5044 itself, of type E, and the Sb spiral NGC 5054), the bright tail of the galaxy population actually consists of a balanced mix of standard spirals and ellipticals, while a prevailing S0 population appears at absolute magnitudes around . Dwarf ellipticals follow at fainter magnitudes, sharing the bulk of the galaxy population at intermediate luminosity () with dwarf irregulars. Definitely, the low-luminosity tail of galaxy distribution coincides with a bunch of dwarf spheroidals, by definition, all fainter than and also standing out for their extremely low surface brightness ( mag arcsec-2, see Fig. 4). The dSph’s clearly extend the colour-magnitude relation traced by early-type members down to , with a scatter that is just mildly larger (likely due to their larger photometric errors) than the scatter at brighter magnitudes (see Smith Castelli et al., 2011, for an in-depth discussion on this topic).
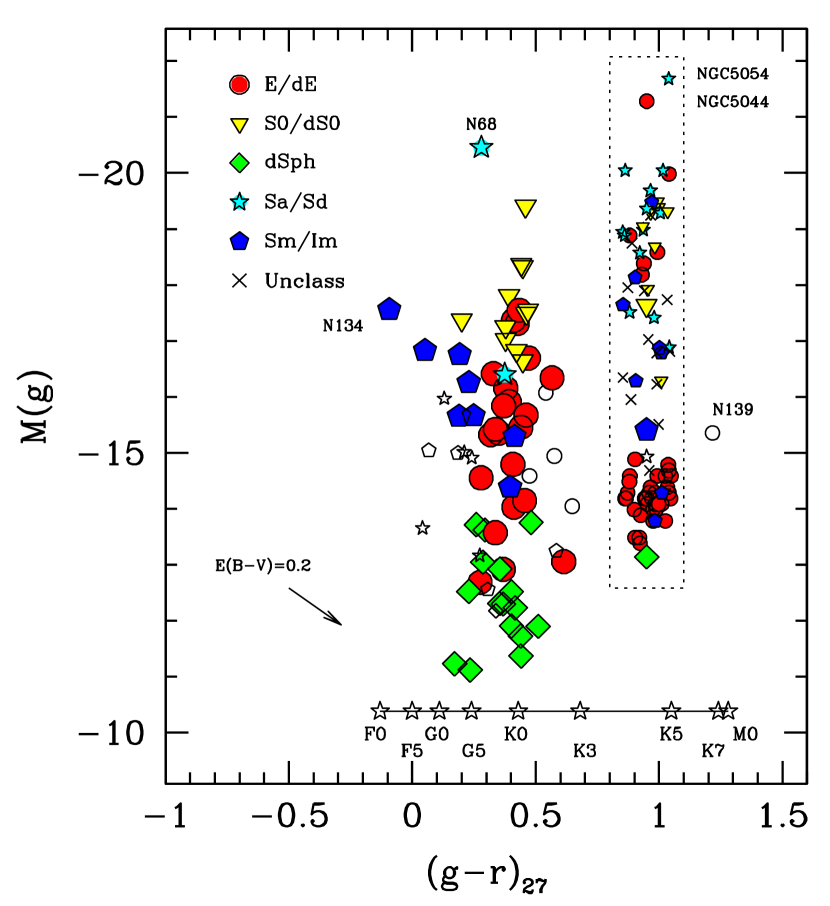
Just on the basis of their location in the c-m diagram of Fig. 6, it is interesting to note that most of the “possible” ( entries in Table 9 and 10) group members might in fact genuinely belong to the system. If confirmed by spectroscopy, then the dE/Im/dSph component of the cluster could even further increase. However, this can certainly not be the case for galaxy N139, a clear outlier in the plot and more likely a background standard elliptical placed at according to its expected k-corrected colours (e.g. Buzzoni, 1995).
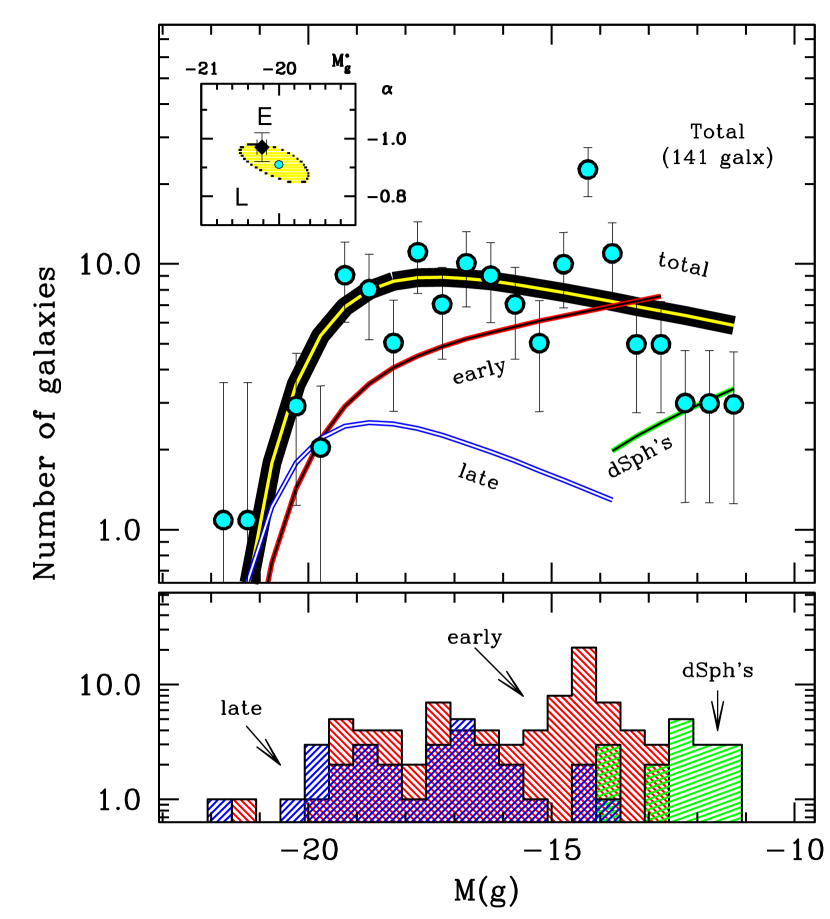
The distinctive features about the group galaxy population more clearly emerge as far as the whole population of 141 bona fide member galaxies is considered to build up the group luminosity function, as displayed in Fig. 7. The tick solid line in the upper panel of the figure represents the global Schechter (1976) fit derived with the STY method (Sandage, Tammann, & Yahil, 1979). This leads to a value for the estimated parameters of
| (2) |
As a guideline, the nominal fits to the early- and late-type galaxy populations, as well as to the dSph component are also added to the panel, although within a much larger formal uncertainty, given the lower sample size.
The Schechter parameters derived for the total sample are well in agreement with the results of Zandivarez & Martinez (2011), who derived the luminosity function of galaxies in groups from the SDSS Data Release 7. In their work, these authors report the multicolour Schechter parameters for groups of different mass. After converting their SDSS magnitudes in the appropriate mass range to our magnitude system, according to Blanton & Roweis (2007), and rescaling consistently to our value, we obtain
| (3) |
in fairly good agreement (within ) with our result. The main contribution to the bright end of the luminosity function comes from standard spirals and ellipticals, while dEs and dSphs dominate the faint-end tail.
| Morph. | b(b) | M/L(B) | M/L(V) | M/L(g) | |||
| Type | [M⊙/L⊙] | ||||||
| E | 0.919 | 4.140 | 0.456 | 0.0 | 17.87 | 14.08 | 10.17 |
| S0 | 0.908 | 4.077 | 0.444 | 0.0 | 16.47 | 13.11 | 9.49 |
| Sa | 0.762 | 3.774 | 0.351 | 0.2 | 10.08 | 9.18 | 6.82 |
| Sb | 0.649 | 3.455 | 0.269 | 0.5 | 6.07 | 6.13 | 4.66 |
| Sc | 0.555 | 3.188 | 0.194 | 0.9 | 3.33 | 3.67 | 2.84 |
| Sd | 0.493 | 2.990 | 0.140 | 1.3 | 1.77 | 2.06 | 1.62 |
| Im | 0.457 | 2.876 | 0.108 | 1.8 | 1.08 | 1.30 | 1.03 |
| (a) At the reference age of 15 Gyr | |||||||
| (b) Birthrate, . | |||||||
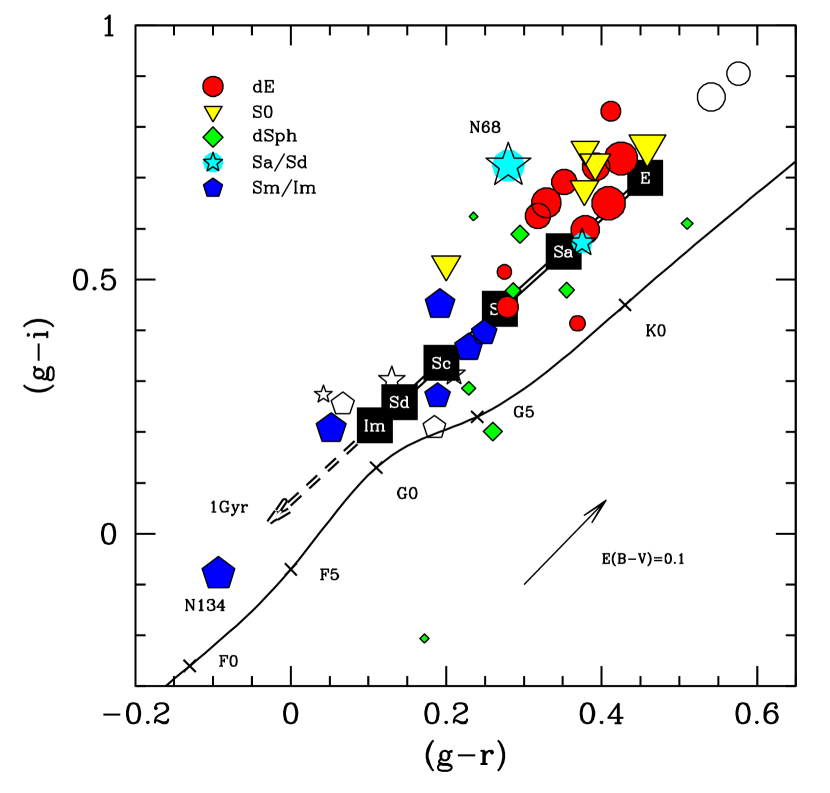
An additional view of the distinctive spectrophotometric properties of the galaxy population, although restrained to the 40 galaxies of the Eso sample, can be gained through a two-colour diagnostic, like the vs. diagram of Fig. 8. The galaxy distribution, according to the different morphological types, is compared with the Buzzoni (2005) template galaxy models and with the empirical stellar locus as derived from the Vilnius spectral catalog (Straizys & Sviderskiene, 1972). Again, only likely members are plotted with solid markers. As expected, galaxies univocally discriminate with respect to stars displaying a “redder” colour for fixed value of (due to the red-giant stellar component contributing to the galaxy SED). Early-type galaxies (both dEs and S0s) fairly well match the Buzzoni (2005) theoretical locus for ellipticals, although displaying slightly bluer colours, as expected by their lower mass compared to “standard” systems (the same effect can also be easily recognized in the histograms of Fig. 5). In a few cases, however, the excursion toward even bluer colours, more appropriate to intermediate-type spirals, makes evident some star-formation activity among the dEs of lowest mass. Direct evidence in this sense has been collected for N50 (Cellone & Buzzoni, 2001) displaying several blue knotty regions around its core. This may also be the case for N55, N93C, and N138, among the faintest dwarf ellipticals easily recognized also in Fig. 6 as “embedded” in the dSph region of the c-m diagram. Similarly, the case of N42, a relatively bright S0, seems worth of special attention for its exceedingly blue colours (see next section on this regard, and Cellone et al. 2011, in preparation, for an in-depth spectral analysis of this galaxy).
As far as the “magellanic” galaxy component (namely types Sm/Im) is concerned, one has to report its large colour spread in Fig. 8, a feature that clearly calls for a wide range of star-formation scenarios. The striking case of galaxy N134, the bluest and brightest () object within this group, is worth of mention in this regard. Its colours are consistent with those of F-type stars, a feature that calls for a very young ( Gyr) age, when compared with template galaxy models of this morphology. N134 lies at 2.6 arcmin ( kpc) projected distance from the centre of NGC 5054, partially overlapping the north arm of this luminous three-armed spiral. One could guess that the likely interaction between both galaxies may be the trigger for the intense star forming activity in N134; whether or not this interaction is also responsible for the peculiar arm morphology of NGC 5054 may still be matter of debate (e.g. Sandage & Bedke, 1994; Eskridge et al., 2002).
In spite of the fairly bunched distribution in the c-m diagram, the population of dSphs stands out in Fig. 8 for its extreme colour spread, that largely encompasses the full theoretical locus for the different morphological types. Part of this peculiar distribution has certainly to be advocated to the large photometric uncertainties, given the very faint magnitude of these galaxies. The low mass of these systems also makes the integrated colours to be more easily biased by a few outstanding stars inside each galaxy, consequent to fresh star formation. This may also give reason, for instance, of the bridging distribution of these galaxies across the stellar locus, as evident in Fig. 8. In any case, it is once more confirmed the puzzling essence of dwarf spheroidals, as multifaceted stellar systems able to easily change their distinctive look such as to escape any obvious classification within the reference evolutionary framework.
4.2 Inferred mass distribution and stellar birthrate
As a further step in our analysis, one could take advantage of the accurate distance to the group (Cellone & Buzzoni, 2005), and a full morphological and photometric characterization of its galaxy members, to try a direct estimate of galaxy stellar mass and therefrom assess other fundamental physical properties of the group as a whole, such as its total bright mass and current stellar birthrate.
This can be done by matching our observed galaxy magnitudes with the appropriate stellar ratio, as proposed by theoretical models. For its better accuracy, and photometry has been taken as a reference for the Eso and Casleo samples, respectively. Again, the Buzzoni (2005) models provide the set of relevant quantities, as summarized in Table 4. As we previously discussed, the dSph case is hard to fit within the canonical scenario of standard morphological types. However, according to the observed colour distribution for these galaxies (see, again Fig. 5 and 8) one could envisage a composite stellar population vaguely resembling that of Sb spirals.
To consistently scale Gunn magnitudes to solar units we assumed for the Sun a colour obtained by convolving a (Straizys & Sviderskiene, 1972) spectrum for a G2V star with the relevant and filters. Recalling, in addition, that and (Portinari, Sommer-Larsen, & Tantalo, 2004), then . Apparent magnitudes for our Eso galaxies eventually translate into solar luminosities as
| (4) |
while, for the Casleo magnitudes, we have
| (5) |
If one wants to further complete the sample with the supplementary bona fide member galaxies comprised in the Ferguson & Sandage (1990) and Mendel et al. (2008) catalogs, then from their photometry we can write,
| (6) |
Galaxy bright mass simply follows either as
| (7) |
providing to chose the appropriate ratio from Table 4 according to galaxy morphology.
| ESO sample | Casleo sample | |||||
| Name | T | Name | T | |||
| N17 | 0 | 9.76 | N18 | 1 | 10.68 | |
| N20 | -5 | 8.59 | N19 | 9 | 8.25 | |
| N24 | 9 | 8.25 | N29 | -5 | 10.17 | |
| N30 | -5 | 9.90 | N38 | -5 | 9.43 | |
| N31 | 10 | 8.49 | N46A | -4 | 7.88 | |
| N32 | 0 | 10.71 | N49A | -4 | 7.66 | |
| N34 | -5 | 9.54 | N51 | 0 | 9.78 | |
| N42 | 0 | 9.90 | N53 | -5 | 9.70 | |
| N49 | 10 | 8.72 | N57 | -5 | 8.81 | |
| N50 | -5 | 9.92 | N58 | 10 | 7.87 | |
| N54 | 10 | 8.69 | N61 | -4 | 7.97 | |
| N54A | -4 | 7.13 | N63 | 0 | 10.47 | |
| N55 | -5 | 8.15 | N66 | -5 | 9.48 | |
| N56 | -4 | 8.13 | N72A | -4 | 7.86 | |
| N62 | -4 | 7.81 | N76 | -5 | 9.84 | |
| N64A | -4 | 7.86 | N79 | 0 | 9.85 | |
| N68 | 2 | 10.99 | N80 | -5 | 8.40 | |
| N70 | -5 | 9.12 | N82 | 0 | 10.45 | |
| N70A | -4 | 7.40 | N82A | -4 | 7.52 | |
| N71 | -5 | 9.44 | N94 | 0 | 10.15 | |
| N75 | 0 | 9.85 | N94A | -4 | 7.73 | |
| N83 | -5 | 9.34 | N94B | -4 | 7.88 | |
| N83A | -4 | 7.65 | N95 | -5 | 9.07 | |
| N89 | -5 | 9.11 | N95A | -4 | 8.47 | |
| N93A | -4 | 8.09 | N108 | -5 | 9.34 | |
| N93B | -4 | 7.09 | N116 | -5 | 8.57 | |
| N93C | -5 | 8.05 | N117 | 0 | 10.12 | |
| N134 | 9 | 9.01 | N122 | -5 | 9.31 | |
| N138 | -5 | 8.80 | N131 | 0 | 10.14 | |
| N153 | 0 | 10.07 | N131A | -4 | 8.19 | |
| N155 | 2 | 9.37 | N149 | 10 | 8.24 | |
| N156 | 10 | 8.25 | ||||
| (a) Only likely member galaxies (code in Table 9 and 10) are considered. Galaxy stellar mass in solar units from the assumed ratio and absolute magnitude, according to eq. (7). | ||||||
| Confirmed () members | Confirmed members | ||||||||
| in Ferguson & Sandage (1990) | in Mendel et al. (2008)(a) | ||||||||
| Name | T | B | Name | T | B(b) | K | |||
| N1 | -5 | 18.4 | 9.10 | N3 | 3 | 14.3 | 9.34 | 10.28 | |
| N5 | -5 | 13.2 | 11.18 | N45 | 10 | 18.9 | … | 7.69 | |
| N7 | -5 | 19.2 | 8.78 | N69 | -5 | 18.7 | … | 8.98 | |
| N9 | 0 | 14.5 | 10.63 | N96 | … | 18.5 | … | … | |
| N11 | 0 | 18.9 | 8.87 | N146 | -5 | 19.1 | … | 8.82 | |
| N15 | -5 | 14.6 | 10.62 | N158 | 0 | 16.9 | 13.15 | 9.67 | |
| N16 | 10 | 19.4 | 7.49 | 2MASX:J13085477-1636106 | … | 16.37 | 12.97 | … | |
| N22 | -5 | 18.9 | 8.90 | 2MASX:J13094408-1636077 | 0 | 13.87 | 9.75 | 10.88 | |
| N25 | -5 | 19.0 | 8.86 | 2MASX:J13091671-1653115 | … | 16.40 | 12.83 | … | |
| N26 | -5 | 18.9 | 8.90 | 2MASX:J13095347-1631018 | 0 | 15.6: | 11.52 | 10.19 | |
| N27 | 4 | 14.2 | 10.32 | 2MASX:J13100952-1616458 | … | 17.23 | 12.34 | … | |
| N36 | -5 | 19.1 | 8.82 | 2MASX:J13102493-1655578 | … | 13.94 | 10.11 | … | |
| N40 | 5 | 16.3 | 9.21 | 2MASX:J13114576-1915421 | 1 | 13.2: | 9.44 | 10.94 | |
| N41 | -5 | 18.8 | 8.94 | 2MASX:J13114703-1847312 | 4 | 15.67 | 12.93 | 9.73 | |
| N48 | -5 | 19.7 | 8.58 | 2MASX:J13115849-1644541 | … | 15.29 | 11.96 | … | |
| N60 | -5 | 18.9 | 8.90 | 2MASX:J13123543-1732326 | 5 | 13.14 | 8.85 | 10.48 | |
| N64 | 1 | 13.9 | 10.66 | 2MASX:J13133433-1525554 | 8 | 13.71 | 10.85 | 9.98 | |
| N67 | -5 | 19.3 | 8.74 | 2MASX:J13143041-1732009 | … | 15.23 | 11.54 | … | |
| N72 | 0 | 13.9 | 10.87 | 2MASX:J13151278-1758006 | 7 | 14.61 | 12.32 | 9.62 | |
| N74 | -5 | 19.4 | 8.70 | 2MASX:J13153736-1452209 | … | … | 11.24 | … | |
| N77 | -5 | 19.7 | 8.58 | 2MASX:J13164875-1620397 | … | 15.45 | 11.60 | … | |
| N78 | -5 | 15.0 | 10.46 | 2MASX:J13165533-1756417 | 0 | 15.26 | 11.94 | 10.32 | |
| N81 | -5 | 19.1 | 8.82 | MASX:J13171239-1715162 | 4 | 14.24 | 10.24 | 10.30 | |
| N84(c) | -5 | 11.9 | 11.70 | 2MASX:J13182685-1545599 | 3 | 15.0: | 11.57 | ||
| N87 | -5 | 19.1 | 8.82 | 2MASX:J13183034-1436319 | 5 | 13.7: | 10.48 | 10.25 | |
| N91 | -5 | 19.8 | 8.54 | 2MASX:J13184125-1904476 | 1 | 15.77 | 12.06 | 9.91 | |
| N97 | -5 | 19.0 | 8.86 | 2MASX:J13185909-1835167 | 0 | 14.14 | 10.12 | 10.77 | |
| N100 | -5 | 14.3 | 10.74 | 2MASX:J13191752-1509252 | … | … | 10.85 | … | |
| N102 | 0 | 13.7 | 10.95 | 2MASX:J13192062-1450402 | 5 | 13.14 | 9.16 | 10.48 | |
| N103 | -5 | 19.2 | 8.78 | 2MASX:J13192221-1509232 | … | … | 13.16 | … | |
| N104 | -5 | 18.9 | 8.90 | 2MASX:J13201698-1448455 | … | … | 11.33 | … | |
| N105 | -5 | 19.0 | 8.86 | 2MASXi:J1320185-163215 | … | 14.44 | 11.13 | … | |
| N107 | 0 | 13.8 | 10.91 | 6dF:j1311150-180610 | … | 16.16 | 13.80 | … | |
| N112 | -5 | 18.8 | 8.94 | 6dF:j1313501-173048 | … | 16.84 | … | … | |
| N113 | -5 | 19.0 | 8.86 | GEMS_N5044_5 | … | … | … | … | |
| N121 | -5 | 18.6 | 9.02 | GEMS_N5044_14 | … | … | … | … | |
| N123 | -5 | 18.3 | 9.14 | GEMS_N5044_7 | … | 17.68 | 13.62 | … | |
| N126 | -5 | 19.1 | 8.82 | GEMS_N5044_18 | … | … | … | … | |
| N127 | -5 | 18.6 | 9.02 | GEMS_N5044_1 | … | … | … | … | |
| N128 | -5 | 19.0 | 8.86 | PGC:045257 | 9 | 15.05 | … | 9.23 | |
| N133 | -5 | 18.6 | 9.02 | PGC:046242 | … | 16.96 | … | … | |
| N135 | -5 | 18.6 | 9.02 | PGC:046402 | 9 | 16.31 | … | 8.72 | |
| N137(d) | 3 | 11.5 | 11.40 | PGC:046494 | 8 | 15.54 | … | 9.24 | |
| N141 | 5 | 13.5 | 10.33 | HIPASS:J1312-15 | … | … | … | … | |
| N142 | -5 | 18.5 | 9.06 | HIPASS:J1320-14 | … | … | … | … | |
| N144 | -5 | 14.8 | 10.54 | FGC1563 | 8 | 16.4 | 13.23 | 8.90 | |
| N147 | -5 | 19.2 | 8.78 | ||||||
| N151 | -5 | 19.0 | 8.86 | ||||||
| N154 | -5 | 19.4 | 8.70 | ||||||
| N162 | 9 | 16.9 | 8.49 | ||||||
| (a) This includes six entries originally classified as by Ferguson & Sandage (1990), whose membership | |||||||||
| has been spectroscopically confirmed, on the contrary, by Mendel et al. (2008). | |||||||||
| (b) Entries in italics estimated from magnitudes, according to the reference colour of | |||||||||
| theoretical templates from Table 4 | |||||||||
| (c) N84 NGC 5044. | |||||||||
| (d) N137 NGC 5054. | |||||||||
| Galaxy stellar mass in solar unit from the assumed ratio and absolute (or, in lack, ) magnitude, | |||||||||
| according to eq. (7) and Table 4 colours. | |||||||||
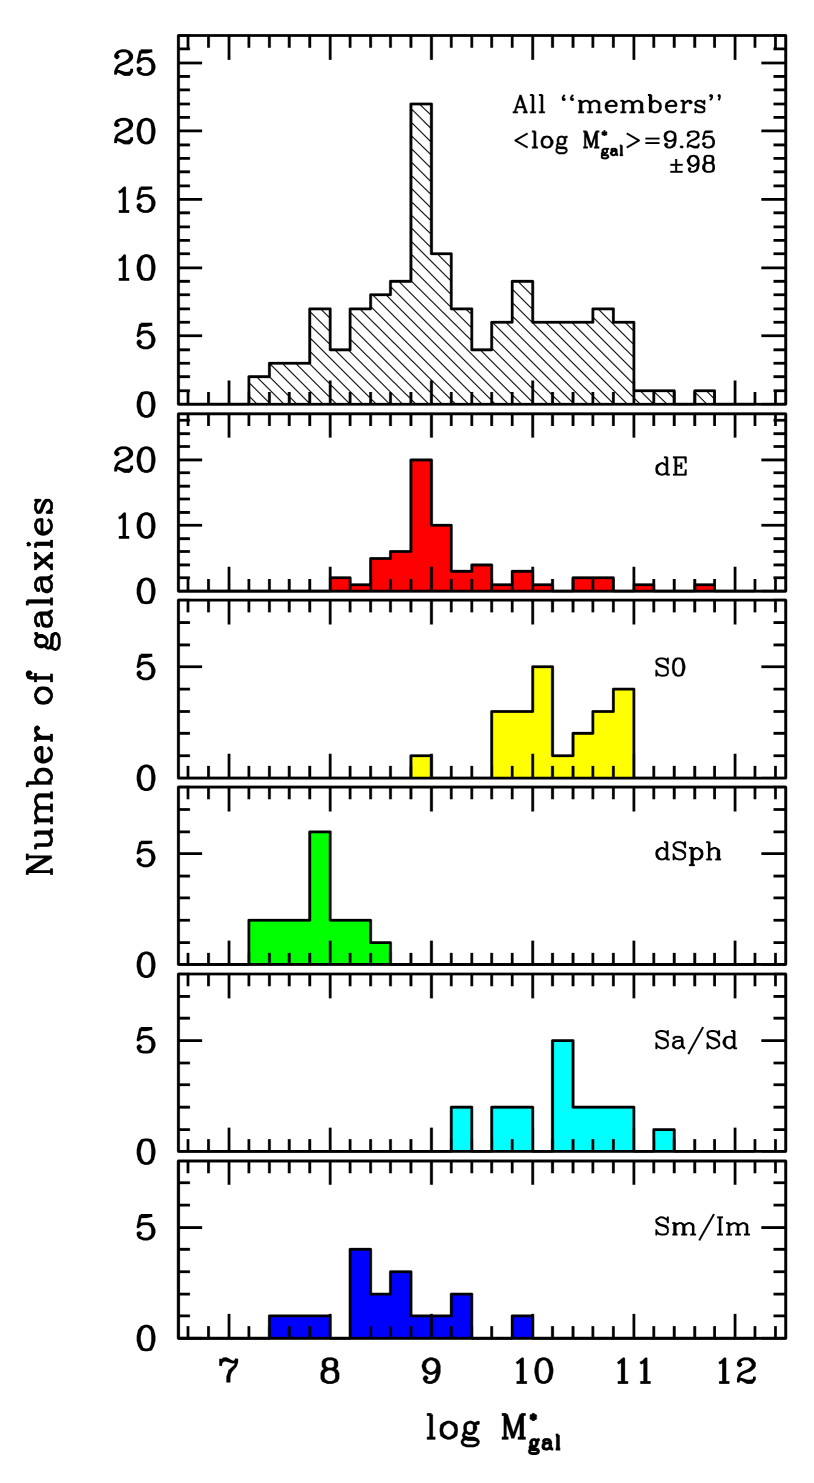
The results of our excercise, for the 63 likely member galaxies (membership code in Tables 9 and 10) in our sample plus the Ferguson & Sandage (1990) and Mendel et al. (2008) extra sample (50+23 objects with available photometry and morphological classification) are reported in Table 5, and 6, respectively, where for each entry the nominal output of eq. (7) is displayed.999For those Mendel et al. (2008) galaxies lacking photometry, eq. (7) has still been used, relying on the observed magnitude and an appropriate colour, according to morphology, as from Table 4. The distribution for the likely-member galaxy sample is displayed in Fig. 9 splitting the contribution of the different morphological classes in the vertical panel sequence. A sharp lower-mass cutoff is evident in the distribution with a definite lack of galaxies below M⊙ and with the M⊙ population almost uniquely consisting of dSph type. The mean logarithmic mass of the whole sample results , that is M⊙, with galaxy mass spreading along nearly one order of magnitude.
A comparison with Mendel et al. (2009) can be attempted, by relying on the mass estimate for the 28 galaxies in common. For this set, these authors obtain a total of M⊙ versus our estimate of M⊙, that is roughly a factor of four larger. This difference is mainly due to the adopted M/L ratio which, for Mendel et al. (2009), comes from a plain SSP fitting of each galaxy, based on the Bruzual & Charlot (2003) population synthesis models. As stated by the authors, their procedure disregarded morphology details and star formation history, thus forcedly leading to younger “luminosity-weighted” ages for their galaxies (see Buzzoni, 2011 and eq. 12 in Buzzoni, 2005 for an estimate of this effect). In addition, the correspondingly lower M/L figures would be further decreased by the adopted Chabrier (2003) IMF. Compared to the Salpeter case, in fact, a Chabrier (2003) dwarf-depleted IMF leads to a brighter SSP (and therefore to a lower M/L ratio) for fixed total stellar mass. According to our calculations, the total bright mass stored in the member galaxies of the group amounts to M⊙, almost half of which being comprised in the three brightest members, that is NGC 5044 (22%), 5054 (11%) and the gorgeous Sab galaxy N68 (4%) (see CB05).
Based on the template galaxy models of Table 4, a nominal estimate of the current galaxy SFR for group members can even be guessed, through the model birthrate, i.e. , so that
| (8) |
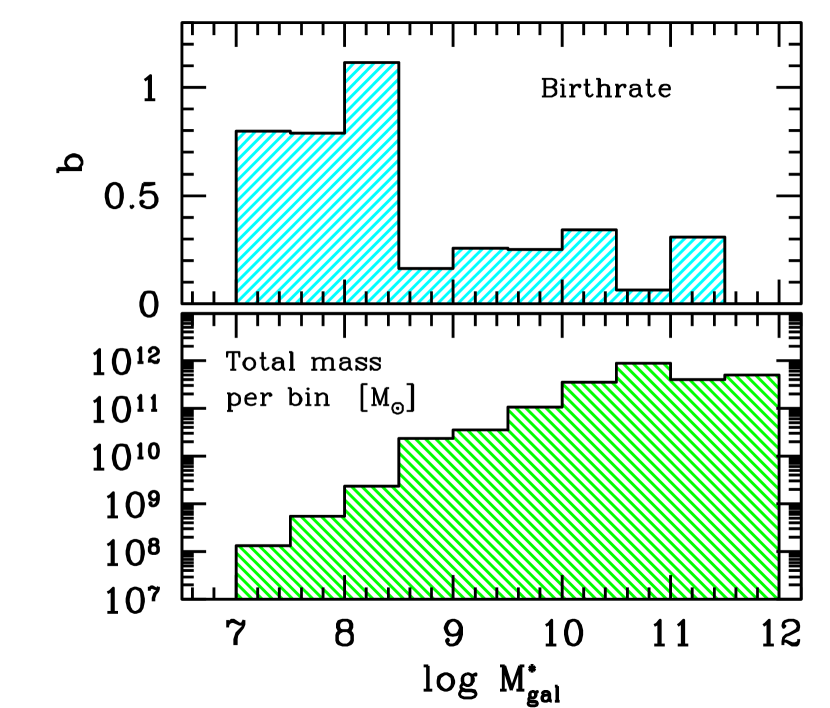
being the assumed galaxy age. By summing up all the entries of Table 5 and 6 we have that fresh stars are produced inside the group at a rate of roughly 23 M⊙ yr-1. Assuming galaxies to be one Hubble time old, in force of eq. (8) this leads to a global birthrate for the group of .
To much extent, such a low figure is mostly induced by the prevailing contribution of early-type galaxies among the more massive members of the NGC 5044 group (see the disaggregated distribution of Fig. 9). As a result, an important fraction of resides in nearly quiescent stellar aggregates (see Fig. 10), while only very low-mass systems (mostly dSph and Im types) are still able to feed fresh stars to the global environment. Even at this small mass scale, therefore, the emerging picture seems consistent with the so-called down-sizing mechanism (Cowie et al., 1996; Gavazzi, 1993), that is an inverse dependence of the birthrate with galaxy mass as the imposing paradigm for galaxy formation in the Universe.
5 Spectroscopic properties
A preliminary analysis of the spectroscopic material collected along our survey has already been provided in Cellone & Buzzoni (2005, see Table 1 therein), where redshift measurements have been presented for 14 galaxies of the sample. For a total of 10 objects, the paper confirmed group membership, while 4 galaxies resulted to lie in the background. After thorough reconsideration of the data, also including the Casleo observing sessions, we can further expand here the original output by including 7 more objects, for which a confident redshift measure can be obtained together with a rough morphological classification according to the detected spectral features. For a further set of 3 spectra no definite conclusions can be achieved, mostly due to the extremely poor S/N level. Our spectroscopic results, then, extend and complement the works of Mendel et al. (2008, 2009), which provided 103 (mostly new) redshifts for galaxies in the NGC 5044 Group catalog, as well as a stellar population analysis through Lick indices for a subset of 67 group members.
| Members | |||
| ID | Type | cz | Remarks |
| [km s-1] | |||
| N17 | 0 | 2682 | H emission |
| N29 | -5 | 2351 | from Casleo |
| N30 | -5 | 2411 | |
| N34 | -5 | 2661 | |
| N42 | 0 | 2462 | |
| N49 | 10 | 1499 | |
| N50 | -5 | 2392 | H emission |
| N75 | 0 | 1831 | |
| N84 | -5 | 2710 | NGC 5044 - H emission |
| N153 | 0 | 2816 | |
| N155 | 2 | 2922 | |
| Background | |||
| ID | Type | z | Remarks |
| N109 | 8 | 0.018 | |
| N33 | 5 | 0.045 | |
| N152 | 7 | 0.045 | H+ [Oiii]5007 emission |
| N39 | -5 | 0.091 | |
| B1 | -5? | 0.097 | |
| B3 | -5 | 0.096 | H+ [Oiii]5007 emission |
| B2 | -5? | 0.282 | |
| B4 | +5? | 0.277 | [Oii]3727 + H emission |
| B6 | -5? | 0.358 | |
| B5 | -5? | 0.424 | |
| Unclassified | |||
| N20 | -5 | ? | [Oiii]5007 emission? |
| N55 | -5 | ? | |
| N156 | 10 | ? | |
| Galaxy type, in italics, refer to a spectroscopic classification alone. | |||
The summary of our results is presented in Table 7, which also recollects the data of Cellone & Buzzoni (2005) for reader’s better convenience. Out of the 25 objects considered by the observations, 10 galaxies, plus NGC 5044, belong to the same physical group, while behind one may guess the presence of at least three galaxy aggregations, that also match the Mendel et al. (2008) data, located respectively at , and 0.28, the farthest one actually confirmed by the coherent X-ray emission studied by XMM-Newton (Gastaldello et al., 2007a). The most distant galaxy in our sample is object B5, located at . According to Table 7, a roughly similar fraction of member and background galaxies is not a surprising feature, of course, given our observing strategy, that included a “bonus” object for each target pointing, as explained in Sec. 2.2. In this regard we stress the very high reliability of morphological membership assignment by Ferguson & Sandage (1990), which reaches % for galaxies (Mendel et al., 2008). As a reference for possible future investigations, we report in Table 12 the accurate coordinates for the 6 “B” galaxies catched by the spectrograph slit101010Note that these coordinates update and complete the corresponding table originally proposed in Cellone & Buzzoni (2005).

A graphical display of the SED for the 11 member galaxies is given in the series of Fig. 11 to 13. The Casleo observations, obtained with a “bluer” setup are reported first in Fig. 11, while the Eso spectra are collected in the other two figures. For a closer “quick-look” analysis of the two data sets, and to increase S/N in the plots, all the displayed spectra have been homogeneously degraded to a FWHM resolution of 12 Å. Once comparing the three objects in common between Eso and Casleo (namely galaxies N30, N42, and N50, as in Fig. 11 and 12) one sees that along the wavelength region in common the spectral pattern of absorption features is consistently reproduced in both data sets.
Some difference can be noticed, on the contrary, for the overall slope of the continuum emission. One has to consider, in this regard, that Casleo spectra have all been taken at fixed (E/W) slit position angle; this is not the case for the Eso spectra for which a range of slit inclinations led in some cases to a larger departure from the parallactic angle, and therefore to a slightly poorer flux calibration. This effect has been explored by means of repeated spectra for the dE galaxy N34 taken in different nights. On the basis of the observed drift in the continuum shape we estimate that the induced internal uncertainty of our flux calibration can be quantified in %.


Concerning the background galaxy population, object B3 is probably the most striking case as the object is well resolved in our images, in spite of its relatively large redshift, and therefore was included in our photometry (see Table 9 and 10). Its Sérsic index () corresponds to a profile steeper than a de Vaucouleurs law, while the spectrum revealed an active elliptical with strong H and [Oiii]5007 line emission.
| Name | Type | G | Fe | Ca | Fe | C2 | H | Fe | Mg1 | Mg2 | Mgb | Fe | Fe | Fe | Fe | Fe | NaD |
|---|---|---|---|---|---|---|---|---|---|---|---|---|---|---|---|---|---|
| 4300 | 4383 | 4455 | 4531 | 4668 | 5015 | 5270 | 5335 | 5406 | 5709 | 5782 | |||||||
| ESO sample | |||||||||||||||||
| N17 | 0 | 3.22 | 0.78 | 0.60 | 2.16 | 1.88 | 0.07 | 1.22 | 0.016 | 0.138 | 3.44 | 2.27 | 1.77 | 1.48 | 0.38 | ||
| (0.83) | |||||||||||||||||
| N30 | -5 | 3.48 | 0.68 | 2.26 | 3.77 | 4.47 | 1.44 | 5.08 | 0.064 | 0.189 | 2.82 | 2.99 | 2.02 | 1.24 | 0.61 | 1.78 | |
| N34 | -5 | 2.47 | 3.37 | 1.66 | 2.44 | 4.23 | 2.34 | 4.91 | 0.054 | 0.166 | 2.73 | 3.19 | 2.02 | 1.18 | 0.71 | 0.72 | 1.85 |
| N42 | 0 | 3.36 | 2.63 | 1.27 | 2.99 | 6.00 | 2.26 | 4.53 | 0.051 | 0.136 | 2.35 | 3.22 | 2.59 | 1.36 | 0.55 | 0.48 | 1.48 |
| N49 | 10 | -3.44 | -0.82 | 0.25 | -0.22 | 0.60 | -0.29 | 1.12 | 0.001 | 0.072 | 1.89 | 0.39 | 1.43 | 0.95 | -0.48 | 0.06 | 1.95 |
| N50 | -5 | 1.43 | 1.57 | 0.98 | 2.63 | 2.17 | 0.54 | 4.50 | 0.041 | 0.130 | 1.97 | 2.97 | 1.90 | 1.03 | 0.79 | 0.78 | 1.76 |
| (1.68) | |||||||||||||||||
| N75 | 0 | 5.08 | 5.06 | 1.58 | 2.45 | 4.37 | 1.95 | 4.88 | 0.055 | 0.171 | 2.69 | 3.13 | 2.54 | 1.57 | 1.00 | 0.58 | 1.92 |
| N84 | -5 | 3.72 | 4.51 | 1.07 | 3.36 | 5.84 | 0.04 | 4.14 | 0.160 | 0.286 | 4.60 | 2.83 | 1.94 | 1.29 | 0.54 | 0.66 | 4.76 |
| (0.64) | |||||||||||||||||
| N153 | 0 | 4.97 | 3.26 | 1.36 | 3.40 | 5.20 | 2.06 | 4.76 | 0.036 | 0.161 | 2.84 | 2.67 | 1.87 | 1.62 | 0.73 | 0.27 | 1.63 |
| N155 | 2 | 1.88 | 3.55 | 0.09 | 1.99 | 0.93 | 1.35 | 2.76 | 0.034 | 0.090 | 0.79 | 2.45 | 1.40 | 1.06 | 0.67 | 0.56 | 2.14 |
| Casleo sample | |||||||||||||||||
| N29 | -5 | 4.95 | 4.19 | 0.77 | 2.88 | 4.08 | 2.06 | 3.78 | 0.042 | 0.154 | 2.50 | 3.44 | 1.72 | 1.42 | |||
| N30 | -5 | 4.93 | 5.54 | 1.36 | 2.24 | 1.57 | 3.14 | 0.040 | 0.138 | 2.59 | 2.21 | 0.45 | 0.80 | ||||
| N42 | 0 | 6.10 | 3.15 | 0.86 | 2.67 | 3.63 | 1.35 | 3.51 | 0.045 | 0.124 | 1.88 | 2.49 | 1.61 | 1.51 | |||
| N50 | -5 | 2.16 | 2.71 | 1.51 | 2.95 | 2.63 | 0.28 | 1.75 | 0.026 | 0.113 | 2.08 | 2.12 | 1.54 | 0.96 | |||
| (0.78) | |||||||||||||||||
| Background galaxies | |||||||||||||||||
| N109 | 8 | -0.69 | 4.42 | -1.25 | 5.93 | 0.63 | 3.31 | -2.76 | 0.052 | 0.071 | 2.63 | 4.27 | 2.91 | 1.17 | 0.69 | -0.31 | 0.50 |
| N33 | 5 | 3.96 | 0.65 | 1.27 | -0.41 | -8.28 | 1.30 | -2.48 | -0.006 | 0.116 | 1.07 | 0.22 | 0.34 | 0.22 | 1.06 | ||
| N152 | 7 | -0.06 | 1.37 | 0.77 | 1.63 | 2.28 | -1.91 | 4.70 | 0.053 | 0.103 | 0.17 | 1.42 | -0.87 | -0.06 | 0.37 | ||
| N39 | -5 | 5.90 | 5.12 | 1.81 | 3.26 | 5.91 | 1.38 | 5.21 | 0.113 | 0.219 | 3.56 | 2.93 | 1.51 | 1.01 | 0.08 | ||
| B1 | -5 | 3.96 | 2.68 | 0.59 | 0.43 | 6.20 | 1.75 | 1.69 | 0.065 | 0.177 | 3.43 | 4.43 | 0.96 | 0.48 | 0.63 | ||
| B3 | -5 | 3.31 | 3.92 | 0.45 | 1.96 | 0.07 | -4.38 | 8.27 | 0.082 | 0.167 | 3.50 | 2.54 | 0.98 | 1.19 | -0.05 | ||
5.1 Lick Indices
In addition to the redshift information, the good spectroscopic material allowed us to tackle in finer detail the study of spectral properties of member and background galaxies in our sample. In particular, spectral resolution of both the Eso and Casleo observations closely matched the canonical prescription (i.e. Å FWHM) to consistently reproduce the Lick system (Worthey et al., 1994), thus allowing a wide set of narrow-band indices to be easily computed from the original data.
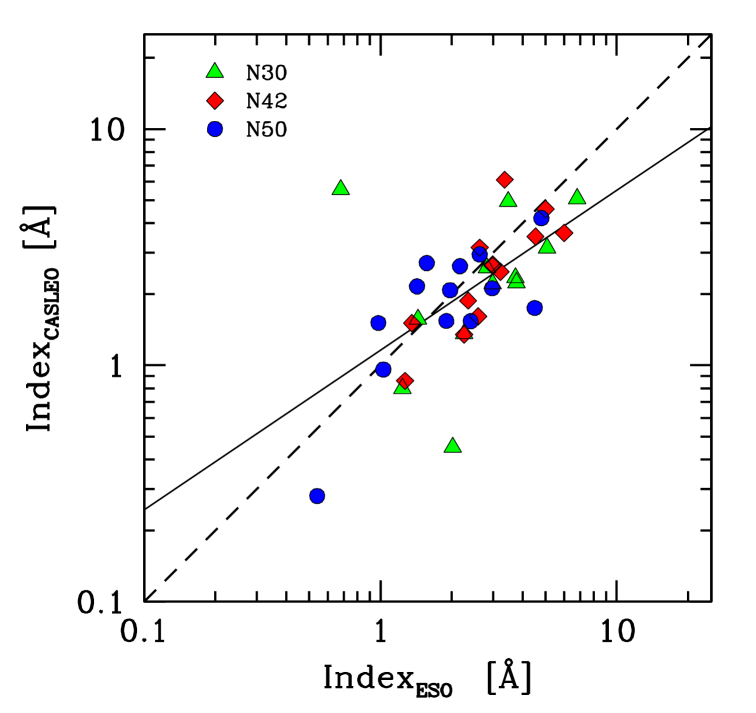
As for the Eso observations, our calculations have been carried out after slightly degrading the spectra to the Lick resolution by convolution with a Gaussian kernel. This transformation cannot be carried out with equivalent accuracy for the Casleo data. Given their slightly poorer resolution (10 Å FWHM), in fact, these spectra tend to display shallower spectral features, and therefore lower index strengths. The effect can be assessed by means of Fig. 14 for the three galaxies in common between Eso and Casleo spectra. The least-squares fit to the data indicates that the corresponding indices (in Å pseudo-equivalent width) relate as111111To ease the comparison, in Fig. 14 and eq. (9) both and indices have been transformed from their magnitude scale to pseudo-equivalent width recalling that, by definition, , being the width of the feature window, according to the standard index definition (Worthey et al., 1994). Therefore, we have that Å for and 42.5 Å for .
| (9) |
with and .
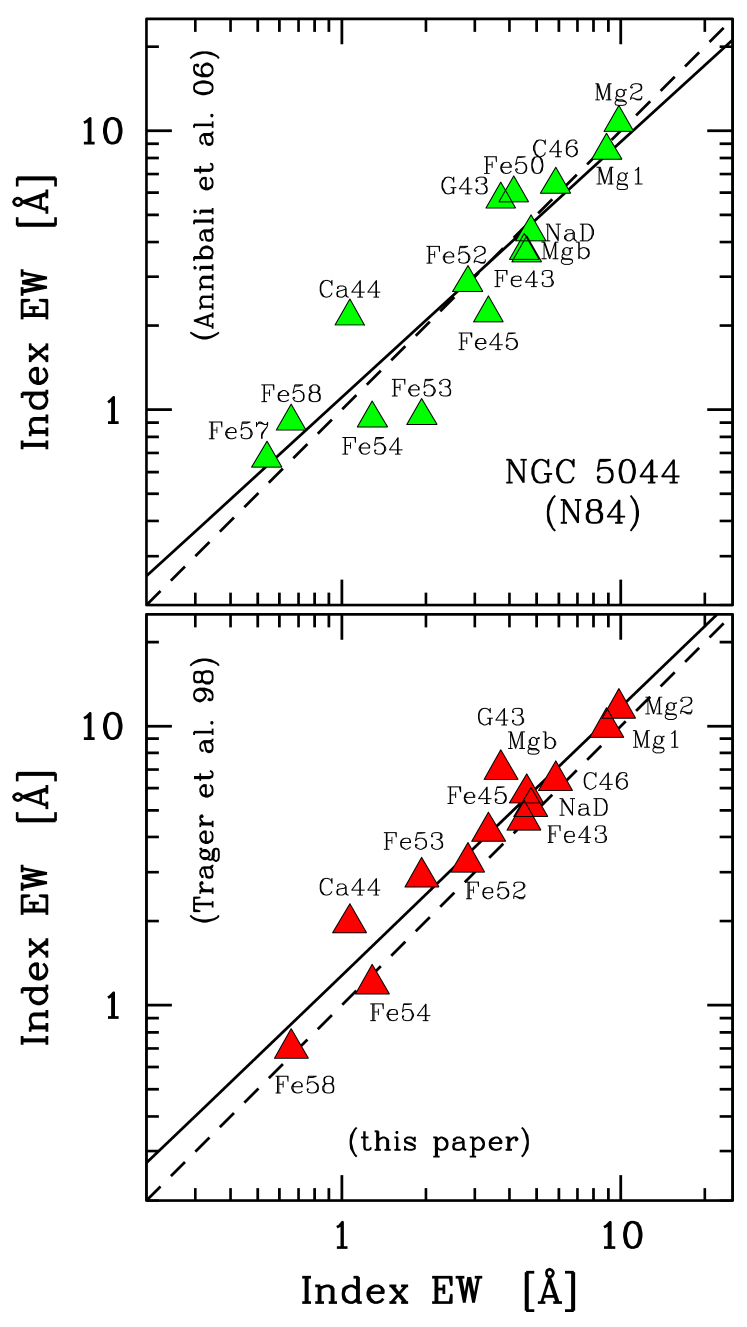
Although the lack of Lick primary calibrators in our sample prevented us to fully standardize our index scale, nevertheless a direct comparison can be done of our output for NGC 5044 itself with two reference sources in the literature, namely the work of Trager et al. (1998) and Annibali et al. (2006). As shown in Fig. 15, in both cases the index correlation is quite good ( with Trager’s data in the - index domain and with the Annibali’s ones) assuring that the Lick standard system is correctly reproduced, on average, by our observations. Table 8 gives a general summary of our results.
5.1.1 H versus Magnesium
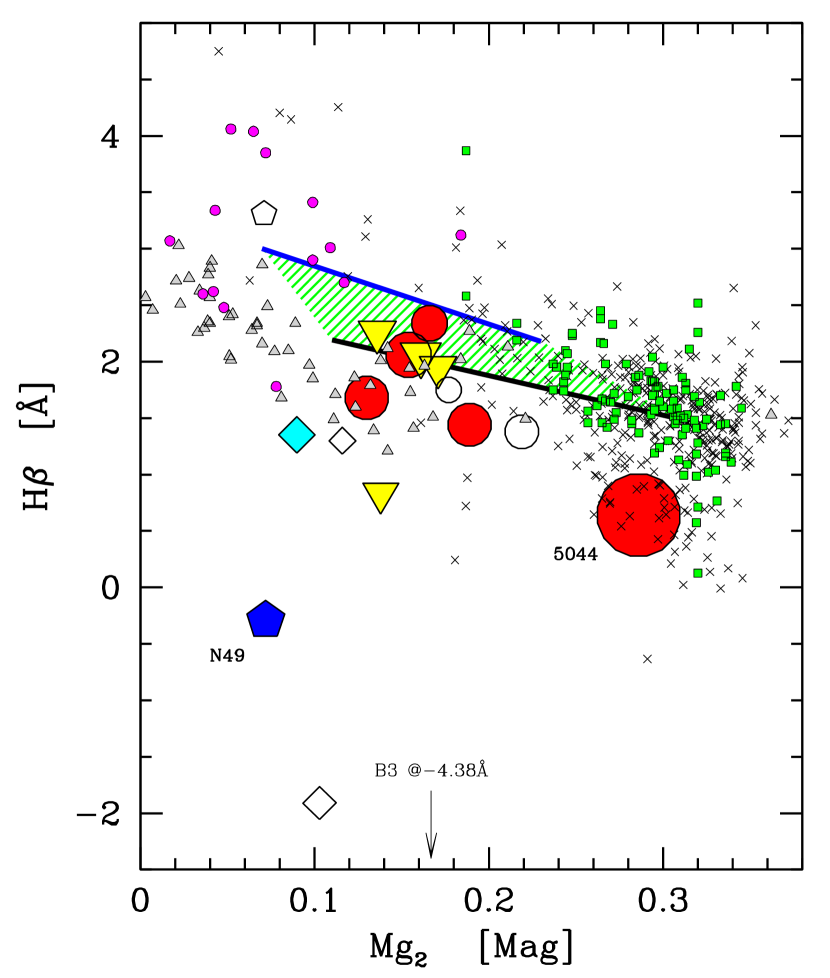
An instructive view can be gained for the NGC 5044 group (and its surrounding background galaxies) in the Lick-index domain. The Magnesium Mg2 index, together with the Balmer H strength are certainly among the most popular reference tracers for this kind of analysis for their better dependence on metallicity (Mg2) and age (H), as extensively studied in the literature (see, e.g. Gorgas, Efstathiou, & Aragon Salamanca, 1990; Buzzoni, 1995; Thomas, Maraston, & Bender, 2003; Tantalo & Chiosi, 2004, for a discussion). The distribution of our sample is displayed in Fig. 16, comparing with the theoretical expectations for simple stellar population models (Buzzoni, Gariboldi, & Mantegazza, 1992; Buzzoni, Mantegazza, & Gariboldi, 1994) along an age range between 5 and 15 Gyr, and with metallicity spanning the interval . The sample of 50 old M31 and Galactic globular clusters, and 370 standard ellipticals from the work of Trager et al. (1998) is also superposed to the plot, together with a supplementary sample of 108 ellipticals with mild emission lines from Rampazzo et al. (2005) and Annibali et al. (2006) for a differential comparison with the distribution of high-mass systems likely experiencing some moderate star-formation activity. As a guideline for the distribution of young (metal-poor) stellar systems, we also added to the plot the sample of 14 globular clusters belonging to the Magellanic Cloud systems, according to de Freitas Pacheco, Barbuy, & Idiart (1998).
As expected, the Mg2-H diagnostic is very poor for late-type galaxies, for which the H index is strongly affected by gas emission; the location of the Im galaxy N49 in the plot is illustrative in this sense, once considering its strong spectral emission, as in Fig. 13. As far as the early-type galaxy component is concerned, however, one has to remark a pretty clean distribution of our dE+dS0 sample, fully intermediate between Magellanic globular clusters and standard ellipticals, and pointing to a low (sub-solar) metallicity and an old age, consistent with the Hubble time.
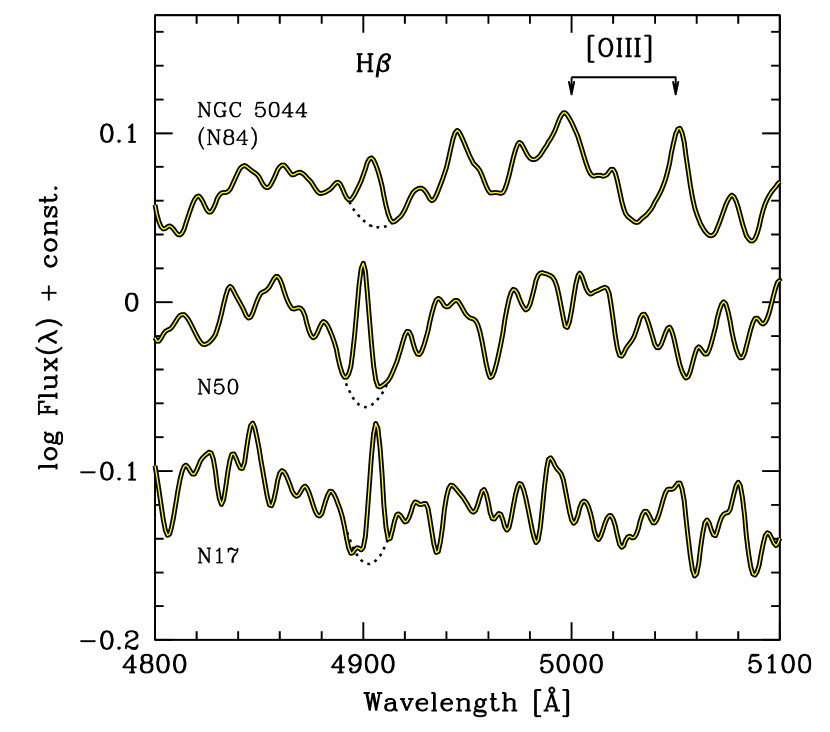
In the latter respect, however, a word of caution still imposes in our conclusions as even for these galaxies a somewhat peculiar H strength might be envisaged to a closer analysis of the individual spectra (see Fig. 17). NGC 5044 itself (alias N84 in our catalog classification) is certainly a case in this regard, displaying an evident emission component, likely related to residual star formation and/or to a low-luminosity AGN (see Gastaldello et al., 2009; Brough et al., 2007, and references therein), superposed to the H absorption bulk. The same pattern also appears in the spectra of galaxies N17 (dS0) and N50 (dE). For the latter object, in particular, a composite stellar population spanning a wide age range has been suggested by Cellone & Buzzoni (2001) from a thorough study of the galaxy surface brightness distribution. Allover, these data show that the presence of excited residual gas, triggered by fresh star formation, might be a somewhat pervasive condition marking the evolution of low-mass ellipticals even at present day.
A proper correction of the H index such as to single out the genuine stellar absorption has widely proved, in the past, to be not a simple task. A standard procedure has been devised by González (1993), relying on the parallel measurement of the [Oiii]5007 strength, taken as a “proxy” of the intrinsic H emission.121212In case a significant equivalent width E[OIII] could be appreciated for the [Oiii]5007 forbidden emission, then González (1993) suggested to enhance the observed value of H by . However, such a relationship has found controversial evidence in the literature (see Carrasco et al., 1995; Trager et al., 2000; Serven & Worthey, 2010, for a range of opinions), as Hydrogen and Oxygen coupling might be not so univocally constrained within the ISM gaseous phase depending on the range of thermodynamical conditions (e.g. Osterbrok, 1974). Galaxy N50 itself, in Fig. 17, provides an outstanding example in this sense, as its spiked H emission does not seem to be accompanied by any evident [Oiii]5007 counterpart. Further support on this line is offered by Mendel et al. (2009, see Fig. 14 therein).
As sketched in Fig. 17, only for the macroscopic case of elliptical galaxies N17, N50 (both in the ESO and Casleo spectra), and N84 we eventually adopted a plain and very prudent correction procedure to the H index, by means of a spline fitting such as to remove at least the visible emission spike. The corrected galaxy points have been plotted in Fig. 16, while their resulting H index is reported in Table 8 as an italics entry. In any case, it is clear that any hidden residual emission would reduce the H strength thus leading to overestimate the galaxy age, especially in case of younger star-forming ellipticals.
5.1.2 Iron versus -elements
Together with H and Mg2, the sub-set of Fe5270 and Fe5335 indices, tracing the Fei features close to the strong Mg absorption at 5170 Å, complete the bulk of popular indices extensively used in literature for galaxy diagnostic. In particular, while Mg2 is naturally sensitive to the abundance of the elements, the Fei indices provide a complementary piece of information to probe the overall metallicity of a stellar population (Buzzoni, Bertone, & Chavez, 2009).
As sometimes attempted in the past literature (e.g. Idiart & Pacheco, 1995; Gorgas et al., 1997; Zhu, Blanton, & Moustakas, 2010), a better display of the data can be done by averaging the two Fe features, like in a composite index
| (10) |
which actually sums up the equivalent width of both features.
An even cleaner result could also be secured for our dataset by taking advantage of the full observation of the 5 “Fe” indices comprised in the Lick system within the 4350-5406 Å range (see, again, Table 8), excluding the Fe5015 feature possibly affected in case of [Oiii]5007 emission. A further composite index can therefore be built up as
| (11) |
Figure 18 gives a summary of our results. Again, for reader’s better reference, our observed galaxy sample is matched in all the plots of the figure with the Rampazzo et al. (2005) and Annibali et al. (2006) standard ellipticals, as well as with the compilation of M31 and Galactic globulars according to Trager et al. (1998). The index can also be easily computed for the theoretical models of Buzzoni, Mantegazza, & Gariboldi (1994) and it is displayed in the upper plot of the figure as a reference locus for 10 Gyr old SSPs to compare with the observed distribution.
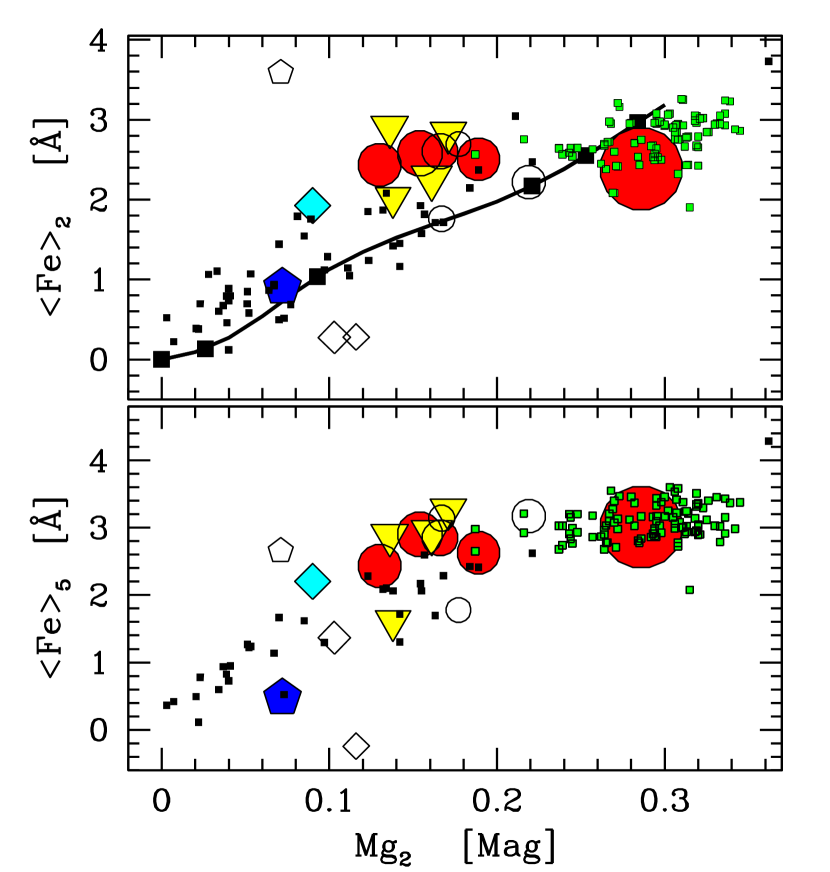
As for the standard ellipticals, even our dwarf early-type galaxies display a flat distribution vs. Mg2. This apparent decoupling between Iron and the other elements (as traced by Magnesium) is a well recognized feature (Gorgas, Efstathiou, & Aragon Salamanca, 1990; Worthey, Faber, & Gonzalez, 1992; Buzzoni, Mantegazza, & Gariboldi, 1994), and probably the most direct evidence of the different enrichment channels that provided metals to the galaxies in the past. According to stellar evolution theory, in fact, we know that -elements are important yields for high-mass stars () dying as Type II SNe; on the contrary, the Fe-Ni enrichment is more efficiently carried on by the Type Ia SNe, likely related to the binary-star environment. A steady trend of vs. Mg might therefore be resilient of a constant abundance of Iron, that is of a constant rate of Type Ia SNe (Buzzoni, Mantegazza, & Gariboldi, 1994).
Apparently at odds with previous conclusions, however, the study of the meta-index reports a more explicit correlation between Fe and Mg along the entire mass range of standard and dwarf ellipticals. To a finer detail, this puzzling behaviour is mostly induced by a trend in place among the “bluer” Fe indices (namely Fe4383 and Fe4531). Contrary to the “red” indices (i.e. Fe5270, Fe5335 and Fe5406), when split into the different elemental contributions (see, for instance, Table 2 in Trager et al., 1998), all the “blue” indices are actually blends including an important presence of Ti and Mg, and this may eventually explain the apparent correlation between and Mg2.
As a final remark dealing with Fig. 18, one has to note the somewhat unexpected general correlation of galaxy indices along the different morhological types. Although with larger individual uncertainties, in fact, also spirals and dwarf irregulars seem to obey in the plots the established relationship as for ellipticals. This interesting behaviour is largely in consequence of the much poorer (and similar) response of both Mg and Fe indices to SSP age, that simply displaces their location in the plots along the SSP “universal” locus independently from the galaxy star-formation history.
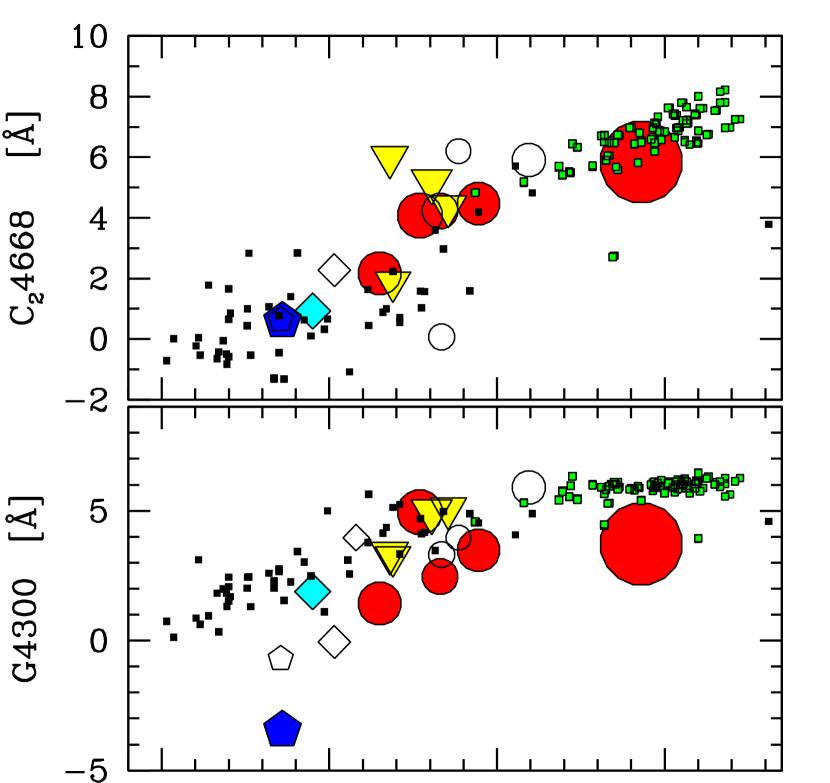
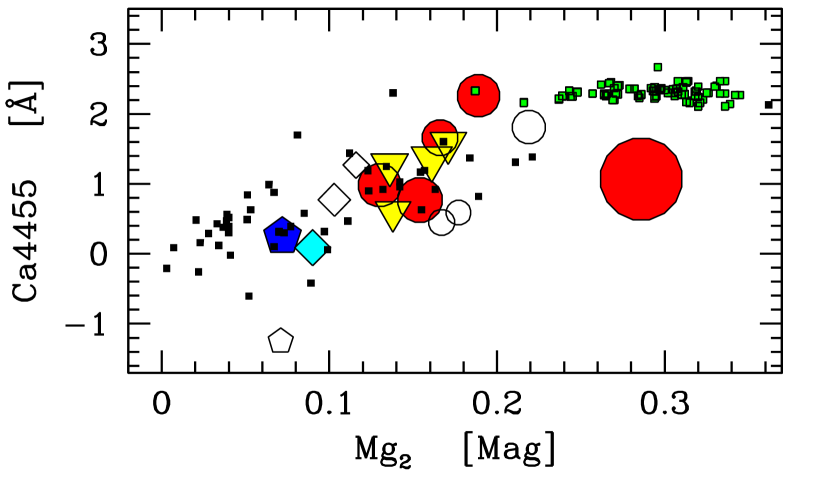
5.1.3 The - element correlation
The natural correlation among elements within our galaxy sample can be verified by means of the two molecular features of Carbon, namely CH (alias G4300) and C2 at 4668 Å (see the two upper panels of Fig. 19), and the Calcium Ca4455 feature (as in the lower panel of the same figure). In both cases, a beautiful trend is in place with the NGC 5044 dwarf-galaxy population linking standard ellipticals with globular clusters. A slightly more scattered plot may be noticed for the G4300 index, however, perhaps in some cases affected by the influence of the closeby H emission.
Overall, one has also to report in the different panels of Fig. 18 and 19 a tendency for NGC 5044 itself to display slightly shallower absorption features compared to the expected strength for standard ellipticals of similar Mg2 value. We are inclined to ascribe this effect to the larger velocity dispersion of this galaxy, which is by far the most massive one of the group. The line broadening especially affects the shallowest features lowering the corresponding index strength. This is especially true, for instance, for the Ca4455 feature, as displayed in Fig. 19. A hint in this sense also appears in Fig. 15, when comparing with the standard indices of Annibali et al. (2006) and Trager et al. (1998).
6 Summary & conclusions
With this third paper of a series (see also Cellone & Buzzoni, 2001, 2005), we conclude our long-term project on the study of the galaxy group surrounding the standard elliptical NGC 5044. As widely recognized in the recent literature (Faltenbacher & Mathews, 2005; Sengupta & Balasubramanyam, 2006; Brough et al., 2006; Mendel et al., 2008, 2009) this group is an outstanding aggregate in the local Universe for its notable population of low-mass (both dwarf and LSB) galaxies, which take part in a massive (, Betoya-Nonesa, Fukazawa, & Ohsugi, 2006) dynamically relaxed stucture, as traced by the diffuse X-ray emission of the group (Buote et al., 2003; Brough et al., 2006).
Along several observing runs carried out at the Casleo (San Juan, Argentina) and Eso (La Silla, Chile) telescopes we collected multicolour photometry for a significant fraction (79 objects) of the faintest galaxies projected on the NGC 5044 sky region assessing cluster membership on the basis of apparent morphological properties (through accurate Sérsic profile fitting) and low-resolution () spectroscopy to estimate redshift for 25 objects in the field.
Both on the basis of the morphological and spectrophotometric properties of the member galaxies, it is evident from our analysis a marked segregation effect within the global population. As far as the galaxy surface-brightness profile is concerned, a clear separation can be made in the Sérsic parameter space between early- and late-type systems, the first showing in nearly all cases a “concave” (shape parameter ) radial brightness profile. Magellanic systems, on the contrary, stand out in the distribution for their clean exponential profile (, see Fig. 3), while dwarf spheroidals confirm their sort of “acephalous” structure, where the “convex” profile () lacks of any nuclear design, and the galaxy body vanishes into a thiny external envelope of extremely faint mean surface brightness ( mag arcsec-2, see Fig. 4). Overall, compared with a de Vaucouleurs profile, typical for standard ellipticals, the dwarf early-type galaxies in the group (dE, dS0, dSph) characterize for their “broader” (i.e. poorly-nucleated) surface-brightness distribution.
The intrinsically bluer colour and the larger colour spread, compared to the other morphological sub-groups (see, in particular, Fig. 5 and Table 3), marks the population of Magellanic irregulars, pointing to a wide range of star-formation histories. The case of the Sm galaxy N134 is a notable one in this regard, appearing to be the youngest member of the N5044 group with an age well less than 1 Gyr (see Fig. 8), probably as a result of its ongoing interaction with NGC 5054. On the other hand, a drift toward bluer integrated colours is also an issue for dE’s, a feature that may point to some moderate star-formation activity even among these nominally “quiescent” stellar systems (see, e.g. Cellone & Forte, 1996, for similar results with the Fornax cluster dE’s).
Once rescaling for the group distance, the absolute magnitude distribution indicates that in the NGC 5044 group we are dealing with a prevailing fraction of systems fainter than (see Sec. 4.2). In particular, dwarf ellipticals and irregulars, together, mark the bulk of the galaxy population around , while dSph’s characterize the faint-end tail of the galaxy distribution (Fig. 6 and 7). The leading role of disk galaxies may even better impose when considering that, apart from NGC 5044 that leads the group as an elliptical, the other three brightest members (heading then the underlying dS0 line in the c-m diagram) are all spirals, namely NGC 5054 (type Sb), N68 (Sab) and N18 (Sab).
To some extent, this further emphasizes the quite special location of the NGC 5044 group, within the cosmic aggregation scale, being strategically placed just “midway” between the high-density environment of galaxy clusters, and the low-density conditions of looser galaxy clumps like our Local Group. Recalling the recent discussion of Gavazzi et al. (2010) about the “nurture” effects on galaxy evolution, it is interesting to remark that this “duality” of the NGC 5044 group reflects also in the prevailing galaxy mix within the aggregate, where the gas-depleted population of dwarf ellipticals (a typical sign of dense cosmic environments) coexists with an important population of dwarf (gas-rich) irregulars (the typical inhabitants of low-density regions in the Universe).
A tentative assessment of the mass budget sampled by the group member galaxies has been carried out in Sec. 4.2 on the basis of the observed colours and the morphology of each object. By relying on the Buzzoni (2005) template models of Table 4, this combined piece of information allowed us to assign a representative M/L such as to convert absolute magnitudes into bright (baryonic) mass. Overall, the 63 member galaxies in our sample complemented by other 50 likely members comprised in the Ferguson & Sandage (1990) original catalog (which includes NGC 5044 and 5054 themselves), and by 23 additional member galaxies with available photometry and morphological type from the Mendel et al. (2008) survey (see Table 5 and 6) collect a total of M⊙, with a mean representative value of for the member galaxies (see Fig. 9). Roughly one fourth of is stored in NGC 5044 itself, while the three brightest members, alone, represent nearly half the total bright mass of the group.
The derived total bright mass is about one seventh of the total dynamical mass of the group as inferred from the X-ray emission map. This fraction might however be getting even smaller if one accounts for a larger estimate between (Gastaldello et al., 2007b) and M⊙, according to Mendel et al. (2008), just on the basis of the galaxy velocity dispersion.
Like in the luminosity function, a clear morphological segregation is also in place for galaxy masses with dE and dS0 systems which surmount the Im and dSph component. The latter, in particular, constrains the low-mass tail of the mass function providing the key connection between galaxies and globular clusters, around the - M⊙ mass range. A more marked presence of later-type systems among the faintest galaxy population naturally complies with the downsizing mechanism (Gavazzi et al., 2010) making active star formation to better confine among low-mass aggregates, as shown in Fig. 10.
As discussed in Sec. 4, fresh stars are produced within the NGC 5044 group at a rate of roughly 23 M⊙ yr-1, implying a global birthrate . This figure might however be a prudent lower limit, as it does not account for the contribution of the two brightest members of the group and for the possible star-forming activity even among dE and dS0 galaxies. Some evidence in this sense stems, in fact, from the broad colour spread of these galaxies in Fig. 8, but even clearer signs emerge from the spectroscopic analysis of Sec. 5. In particular, Fig. 17 shows that the general presence of H emission in the spectra of many dwarf ellipticals (and in NGC 5044 itself) is resilient of a moderate but pervasive activity of fresh star formation throughout in the group environment.
The good spectroscopic material, collected along the same photometric observing runs added a number of useful details to characterize the evolutionary status of the NGC 5044 group. These data allowed a univocal membership classification in most ambiguous cases discriminating between genuine dwarf galaxies belonging to the group and bright background galaxies (see Table 7); the case of objects B3 and N39 is illustrative in this sense, as both ellipticals eventually resulted to be part of a background structure at . In this regard, at least three relevant galaxy aggregates appear beyond our group, the farthest one being a confirmed galaxy cluster at (Gastaldello et al., 2007a).
The resolution and wavelength coverage for Eso and Casleo spectra also allowed us to self-consistently derive a series of Lick narrow-band indices, as summarized in Table 8. In particular, eight relevant features of Iron between 4300 and 5800 Å have been sampled, while elements can be traced by means of the 4455 Å Ca feature and the striking Mg feature at 5170 Å. In addition, two molecular bands of Carbon (CH at 4300 Å, and C2 at 4668 Å) complete our diagnostic tools. As far as early-type galaxies are concerned, spectroscopic analysis clearly indicate for them a sub-solar metallicity (, see especially Fig. 18), and in general an old age, consistent with the Hubble time. In the latter respect, however, one has to be aware of the possible hidden bias (toward higher values) in age diagnostic via H absorption strength (Fig. 17) due to the effect of gas emission.
As for the established relationship for high-mass ellipticals (Worthey, Faber, & Gonzalez, 1992), also the dwarf population of NGC 5044 shows a decoupled trend between Iron and elements (as in the uppel panel of Fig. 18), consistent with the mild trend between and stellar mass for galaxies shown by Mendel et al. (2009). This feature supports and further extends also to the low-mass framework the canonical picture for galaxy chemical evolution as a result of the two distinct enrichment channels dealing with Type I and Type II SNe (see, e.g. Matteucci & Greggio, 1986).
Acknowledgments
We warmly thank Eso and Casleo staffs for their skillful assitance. The anonymous referee is also acknowledged for several timely comments to the original draft. Funding from ANPCT (Argentina), PICT 03-00339 (1998) is also acknowledged. SAC would like to thank CONICET and UNLP for funding through personal grants, and the Astronomical Observatories of Brera-Merate and Bologna, Italy, for their hospitality. The Universidad Nacional de La Plata is also acknowledged by one of us (AB) for friendly and generous support along the many visits to Argentina in the framework of this project.
References
- Aloisi et al. (2007) Aloisi A., et al., 2007, ApJ, 667, L151
- Annibali et al. (2006) Annibali F., Bressan A., Rampazzo R., Zeilinger W. W., 2006, A&A, 445, 79
- Arimoto (1995) Arimoto N., 1995, ASPC, 86, 239
- Arimoto & Tarrab (1990) Arimoto N., Tarrab I., 1990, A&A, 228, 6
- Baldwin & Stone (1984) Baldwin J. A., Stone R. P. S., 1984, MNRAS, 206, 241
- Betoya-Nonesa, Fukazawa, & Ohsugi (2006) Betoya-Nonesa J. G., Fukazawa Y., Ohsugi T., 2006, PASJ, 58, 103
- Binggeli, Sandage, & Tammann (1985) Binggeli B., Sandage A., Tammann G. A., 1985, AJ, 90, 1681
- Blanton & Roweis (2007) Blanton M. R., Roweis S., 2007, AJ, 133, 734
- Brough et al. (2007) Brough, S., Proctor, R., Forbes, D. A., Couch, W. J., Collins, C. A., Burke, D. J., & Mann, R. G. 2007, MNRAS, 378, 1507
- Bothun & Mould (1988) Bothun G. D., Mould J. R., 1988, ApJ, 324, 123
- Brodie & Huchra (1991) Brodie J. P., Huchra J. P., 1991, ApJ, 379, 157
- Brough et al. (2006) Brough S., Forbes D. A., Kilborn V. A., Couch W., 2006, MNRAS, 370, 1223
- Bruzual & Charlot (2003) Bruzual G., Charlot S., 2003, MNRAS, 344, 1000
- Buote et al. (2003) Buote D. A., Lewis A. D., Brighenti F., Mathews W. G., 2003, ApJ, 594, 741
- Burstein & Heiles (1982) Burstein D., Heiles C., 1982, AJ, 87, 1165
- Buzzoni (1995) Buzzoni A., 1995, ApJS, 98, 69
- Buzzoni (2005) Buzzoni A., 2005, MNRAS, 361, 725
- Buzzoni (2011) Buzzoni A., 2011, MNRAS, 415, 1155
- Buzzoni, Gariboldi, & Mantegazza (1992) Buzzoni A., Gariboldi G., Mantegazza L., 1992, AJ, 103, 1814
- Buzzoni, Mantegazza, & Gariboldi (1994) Buzzoni A., Mantegazza L., Gariboldi G., 1994, AJ, 107, 513
- Buzzoni, Bertone, & Chavez (2009) Buzzoni A., Bertone E., Chavez M., 2009, ApJ, 703, L127
- Campos, Mendes de Oliveira, & Bolte (2004) Campos P. E., Mendes de Oliveira C., Bolte M., 2004, Outskirts of Galaxy Clusters: Intense Life in the Suburbs. Eds. A. Diaferio, IAU Coll. #195, p.441
- Carrasco et al. (1995) Carrasco L., Buzzoni A., Salsa M., Recillas-Cruz E., 1995, Fresh views of elliptical galaxies. ASP Conf. Series, 86, eds. A. Buzzoni, A. Renzini, and A. Serrano (San Francisco: ASP), p.235
- Cellone (1999) Cellone S. A., 1999, A&A, 345, 403
- Cellone & Buzzoni (2001) Cellone S. A., Buzzoni A., 2001, A&A, 369, 742
- Cellone & Buzzoni (2005) Cellone S. A., Buzzoni A., 2005, MNRAS, 356, 41
- Cellone & Buzzoni (2007) Cellone S. A., Buzzoni A., 2007, Groups of Galaxies in the Nearby Universe, 91
- Cellone & Forte (1996) Cellone S. A., Forte J. C., 1996, ApJ, 461, 176
- Cellone, Forte & Geisler (1994) Cellone S. A., Forte J. C., Geisler D., 1994, ApJS, 93, 397
- Chabrier (2003) Chabrier G., 2003, PASP, 115, 763
- Conselice, Gallagher, & Wyse (2001) Conselice C. J., Gallagher J. S., III, Wyse R. F. G., 2001, ApJ, 559, 791
- Cowie, Songaila, & Hu (1991) Cowie L. L., Songaila A., Hu E. M., 1991, Nature, 354, 460
- Cowie et al. (1996) Cowie L. L., Songaila A., Hu E. M., Cohen J. G., 1996, AJ, 112, 839
- Davies et al. (1988) Davies J. I., Phillipps S., Cawson M. G. M., Disney M. J., Kibblewhite E. J., 1988, MNRAS, 232, 239
- Deady et al. (2002) Deady J. H., Boyce P. J., Phillipps S., Drinkwater M. J., Karick A., Jones J. B., Gregg M. D., Smith R. M., 2002, MNRAS, 336, 851
- de Freitas Pacheco, Barbuy, & Idiart (1998) de Freitas Pacheco J. A., Barbuy B., Idiart T., 1998, A&A, 332, 19
- Dressler (1980) Dressler A., 1980, ApJ, 236, 351
- Drinkwater et al. (2001) Drinkwater M. J., Gregg M. D., Holman B. A., Brown M. J. I., 2001, MNRAS, 326, 1076
- Eskridge et al. (2002) Eskridge P. B., et al., 2002, ApJS, 143, 73
- Faltenbacher & Mathews (2005) Faltenbacher A., Mathews W. G., 2005, MNRAS, 362, 498
- Ferguson (1989) Ferguson H. C., 1989, AJ, 98, 367
- Ferguson & Binggeli (1994) Ferguson H. C., Binggeli B., 1994, A&AR, 6, 67
- Ferguson & Sandage (1990) Ferguson H. C., Sandage A., 1990, AJ, 100, 1
- Ferrarese et al. (2006) Ferrarese L., et al., 2006, ApJS, 164, 334
- Forbes (2007) Forbes D. A., 2007, Groups of Galaxies in the Nearby Universe, eds. I. Saviane, V.D. Ivanov, J. Borissova, ESO Astrophys. Symp. (Heidelberg: Springer-Verlag), p. 97
- Gastaldello et al. (2007a) Gastaldello F., Buote D. A., Humphrey P. J., Zappacosta L., Seigar M. S., Barth A. J., Brighenti F., Mathews W. G., 2007a, ApJ, 662, 923
- Gastaldello et al. (2007b) Gastaldello F., Buote D. A., Humphrey P. J., Zappacosta L., Bullock J. S., Brighenti F., Mathews W. G., 2007b, ApJ, 669, 158
- Gastaldello et al. (2009) Gastaldello F., Buote D. A., Temi P., Brighenti F., Mathews W. G., Ettori S., 2009, ApJ, 693, 43
- Gavazzi (1993) Gavazzi G., 1993, ApJ, 419, 469
- Gavazzi et al. (2005) Gavazzi G., Donati A., Cucciati O., Sabatini S., Boselli A., Davies J., Zibetti S., 2005, A&A, 430, 411
- Gavazzi et al. (2010) Gavazzi G., Fumagalli M., Cucciati O., Boselli A., 2010, A&A, 517, A73
- González (1993) González J. J., 1993, PhDT,
- Gorgas, Efstathiou, & Aragon Salamanca (1990) Gorgas J., Efstathiou G., Aragon Salamanca A., 1990, MNRAS, 245, 217
- Gorgas et al. (1997) Gorgas J., Pedraz S., Guzman R., Cardiel N., Gonzalez J. J., 1997, ApJ, 481, L19
- Grebel (2005) Grebel E. K., 2005, Near-fields cosmology with dwarf elliptical galaxies, IAU Coll. 198, eds. Jerjen, H. & Binggeli, B. (Cambridge: Cambridge Univ. Press), p.1
- Gutiérrez-Moreno et al. (1988) Gutiérrez-Moreno A., Moreno H., Cortés G., Wenderoth E., 1988, PASP, 100, 973
- Held (2005) Held E. V., 2005, Near-fields cosmology with dwarf elliptical galaxies, IAU Coll. 198, eds. Jerjen, H. & Binggeli, B. (Cambridge: Cambridge Univ. Press), p.11
- Held & Mould (1994) Held E. V., Mould J. R., 1994, AJ, 107, 1307
- Helsdon & Ponman (2003) Helsdon S. F., Ponman T. J., 2003, MNRAS, 339, L29
- Hilker et al. (1999) Hilker M., Kissler-Patig M., Richtler T., Infante L., Quintana H., 1999, A&AS, 134, 59
- Ichikawa, Wakamatsu, & Okamura (1986) Ichikawa S.-I., Wakamatsu K.-I., Okamura S., 1986, ApJS, 60, 475
- Idiart & Pacheco (1995) Idiart T. P., Pacheco J. A. D. F., 1995, AJ, 109, 2218
- Jerjen & Dressler (1997) Jerjen H., Dressler A., 1997, A&AS, 124, 1
- Jerjen, Kalnajs & Binggeli (2000) Jerjen H., Kalnajs A., Binggeli B., 2000, A&A, 358, 845
- Jørgensen (1994) Jørgensen I. 1994, PASP, 106, 967
- Karachentseva, Karachentsev, & Boerngen (1985) Karachentseva V. E., Karachentsev I. D., Boerngen F., 1985, A&AS, 60, 213
- Kaufmann et al. (1993) Kaufmann et al. 1993, MNRAS, 264, 201
- Kelm, Focardi, & Sorrentino (2005) Kelm B., Focardi P., Sorrentino G., 2005, A&A, 442, 117
- Kent (1985) Kent S. M., 1985, PASP, 97, 165
- Knezek, Sembach, & Gallagher (1999) Knezek P. M., Sembach K. R., Gallagher J. S., III, 1999, ApJ, 514, 119
- Kuzio de Naray, McGaugh, & de Blok (2004) Kuzio de Naray R., McGaugh S. S., de Blok W. J. G., 2004, MNRAS, 355, 887
- Landolt (1992) Landolt A. U., 1992, AJ, 104, 340
- Lisker et al. (2007) Lisker T., Grebel E. K., Binggeli B., Glatt K., 2007, ApJ, 660, 1186
- Maia & da Costa (1990) Maia M. A. G., da Costa L. N., 1990, ApJ, 352, 457
- Matteucci & Greggio (1986) Matteucci F., Greggio L., 1986, A&A, 154, 279
- Mendel et al. (2008) Mendel J. T., Proctor R. N., Forbes D. A., Brough S., 2008, MNRAS, 389, 749
- Mendel et al. (2009) Mendel J. T., Proctor R. N., Rasmussen J., Brough S., Forbes D. A., 2009, MNRAS, 396, 2103
- Mieske, Hilker, & Infante (2004) Mieske S., Hilker M., Infante L., 2004, A&A, 418, 445
- Osterbrok (1974) Osterbrok D. E., 1974, Astrophysics of Gaseous Nebulae and Active Galactic Nuclei. University Science Books, Mill Valley
- Paturel et al. (2003) Paturel G., Petit C., Prugniel P., Theureau G., Rousseau J., Brouty M., Dubois P., Cambrésy L., 2003, A&A, 412, 45
- Portinari, Sommer-Larsen, & Tantalo (2004) Portinari L., Sommer-Larsen J., Tantalo R., 2004, MNRAS, 347, 691
- Postman & Geller (1984) Postman M., Geller M. J., 1984, ApJ, 281, 95
- Rampazzo et al. (2005) Rampazzo R., Annibali F., Bressan A., Longhetti M., Padoan F., Zeilinger W. W., 2005, A&A, 433, 497
- Roberts et al. (2004) Roberts S., et al., 2004, MNRAS, 352, 478
- Sabatini et al. (2005) Sabatini S., Davies J., van Driel W., Baes M., Roberts S., Smith R., Linder S., O’Neil K., 2005, MNRAS, 357, 819
- Sandage & Bedke (1994) Sandage A., Bedke J., 1994, The Carnegie Atlas of Galaxies, (Washington DC: Carnegie Inst. of Washington with the Flintridge Foundation)
- Sandage, Tammann, & Yahil (1979) Sandage A., Tammann G. A., Yahil A., 1979, ApJ, 232, 352
- Saracco et al. (1999) Saracco P., D’Odorico S., Moorwood A., Buzzoni A., Cuby J.-G., Lidman C., 1999, A&A, 349, 751
- Schechter (1976) Schechter P., 1976, ApJ, 203, 297
- Schlegel, Finkbeiner, & Davis (1998) Schlegel D. J., Finkbeiner D. P., Davis M., 1998, ApJ, 500, 525
- Schneider, Gunn & Hoessel (1983) Schneider D. P., Gunn J. E., Hoessel J. G. 1983, ApJ, 264, 337
- Secker & Harris (1997) Secker J., Harris W. E., 1997, PASP, 109, 1364
- Secker, Harris & Plummer (1997) Secker J., Harris W. E., Plummer J. D., 1997, PASP, 109, 1377
- Sengupta & Balasubramanyam (2006) Sengupta C., Balasubramanyam R., 2006, MNRAS, 369, 360
- Sérsic (1968) Sérsic J. L., 1968, Atlas de galaxias australes. Córdoba, Argentina: Observatorio Astronómico
- Serven & Worthey (2010) Serven J., Worthey G., 2010, AJ, 140, 152
- Smith Castelli et al. (2008) Smith Castelli A. V., Bassino L. P., Richtler T., Cellone S. A., Aruta C., Infante L., 2008, MNRAS, 386, 2311
- Smith Castelli et al. (2011) Smith Castelli A. V., Cellone S. A., Faifer F. R., Bassino L. P., Richtler T. Romero G. A., Calderón J. P., Caso J. P. 2011, MNRAS, in press (doi:10.1111/j.1365-2966.2011.19901.x)
- Straizys & Sviderskiene (1972) Straizys V., Sviderskiene Z., 1972, VilOB, 35, 3
- Tantalo & Chiosi (2004) Tantalo R., Chiosi C., 2004, MNRAS, 353, 917
- Thomas, Maraston, & Bender (2003) Thomas D., Maraston C., Bender R., 2003, MNRAS, 339, 897
- Thuan & Gunn (1976) Thuan T. X., & Gunn J. E. 1976, PASP, 88, 543
- Tolstoy, Hill, & Tosi (2009) Tolstoy E., Hill V., Tosi M., 2009, ARA&Ap, 47, 371
- Trager et al. (1998) Trager S. C., Worthey G., Faber S. M., Burstein D., Gonzalez J. J., 1998, ApJS, 116, 1
- Trager et al. (2000) Trager S. C., Faber S. M., Worthey G., González J. J., 2000, AJ, 119, 1645
- Wade et al. (1979) Wade R. A., Hoessel J. G., Elias J. H.,Huchra J. P. 1979, PASP, 91, 35
- Worthey, Faber, & Gonzalez (1992) Worthey G., Faber S. M., Gonzalez J. J., 1992, ApJ, 398, 69
- Worthey et al. (1994) Worthey G., Faber S. M., Gonzalez J. J., Burstein D., 1994, ApJS, 94, 687
- Zandivarez & Martinez (2011) Zandivarez A., Martinez H. J., 2011, MNRAS, 415, 2553
- Zhu, Blanton, & Moustakas (2010) Zhu G., Blanton M. R., Moustakas J., 2010, ApJ, 722, 491
Appendix A Relevant properties of the NGC 5044 group galaxies
We summarize in Tables 9 and 10 the main distinctive properties of the observed galaxy population in the NGC 5044 group. Column caption, for both tables is as follows:
- col. 1
-
- Galaxy ID (see, in this regard, Footnote 2);
- col. 2
-
- Membership code, : 1 = definite; 2 = likely; 3 = possible; 4 = non member. Membership is assigned according to: i) km s-1 if redshift is available from either CB05 and/or Mendel et al. (2008) and/or other),ii) morphology (if no redshift available).
- col. 3
-
- Morphological classification according to CB05. See Cellone & Buzzoni (2007) for the meaning of “mixed” morphological classes;
- col. 4
-
- Morphological classification according to FS90;
- col. 5
-
- De Vaucouleurs’ morphological type, ;
- cols. 6 and 7
-
- Isophotal radius () at mag arcsec-2, and effective radius (), which encircles 50% of the luminosity within . The -band imagery is taken as a reference for the Eso sample, and -band for the Casleo galaxies;
- cols. 8,9, and 10
-
- Sérsic fitting parameters from -band (Eso sample) and -band imagery (Casleo sample). These are central brightness () in mag arcsec-2, scale radius () in arcsec, and “shape index” ;
- col. 11
-
- Total apparent magnitude encircled within the mag arcsec-2 isophote in the (Eso) and (Casleo) bands;
- col. 12
-
- Mean surface brightness within isophotal radius in the (Eso) and (Casleo) bands;
- col. 13
-
- Mean surface brightness within one effective radius in the (Eso) and (Casleo) bands;
- col. 14 to 19
-
(Table 9) - Gunn colours within the -band values of and for the Eso galaxies;
- col. 14 to 15
-
(Table 10) - Johnson colours within the -band values of and for the Casleo galaxies.
![[Uncaptioned image]](/html/1112.4493/assets/x22.png)
![[Uncaptioned image]](/html/1112.4493/assets/x23.png)
| Name | ||
|---|---|---|
| N46A | ||
| N72A | ||
| N80A | ||
| N82A | ||
| N94A | ||
| N94B |
| Name | ||
|---|---|---|
| B1 | ||
| B2 | ||
| B3 | ||
| B4 | ||
| B5 | ||
| B6 |